Bellessa is found in central Gondar, which is affected frequently by drought thanks to spatial and temporal failure of rainfall. Therefore, the agriculture in this area has to be supported by surface irrigation. For this, land suitability analysis for surface irrigation is extremely important to scale back food security problem. GIS-based land suitability analysis was conducted using analytical hierarchy process methods. Eight factors like slope, elevation, distance to water source, land use, soil texture, type, depth, and drainage are considered and therefore the weight of every parameter was estimated using 8x8 pairwise comparison matrix. After all, final land suitability map was generated using weighted overlay method under GIS tool. the ultimate map was classified into four land suitable classes using natural break classification method as highly suitable (S1), moderately suitable (S2), marginally suitable (S3), and not suitable class (S4). The result showed that highly suitable, moderately suitable, marginally suitable and not suitable class are covered 13.9%, 46.9%, 26.9%, and 12.2% of the whole area, respectively. This study finding will features a vital role in conducting surface irrigation considering the input parameters and therefore the final demarcated suitable land classes.
Research
GIS-based Land Suitability Analysis for Surface Irrigation Using Analytical Hierarchy Process Method in East and West Bellessa, Northwestern Ethiopia
https://doi.org/10.21203/rs.3.rs-768423/v1
This work is licensed under a CC BY 4.0 License
Version 1
posted
You are reading this latest preprint version
It is documented that agriculture in Ethiopia is that the core driver for the expansion of the economy of the country and long-term food security. It directly supports quite 85% of the population’s livelihoods and 43% of the gross domestic product (GDP) (Sleshi et al., 2007). However, it is traditionally subsistence-based and rain-fed which is suffering from spatial and temporal variability of the rainfall in several parts of the country (Sleshi and Camberlin, 2006). This resulted in food insecurity problems in its different parts thanks to the occurrence of drought within the regions that follow rain-fed crop production. As reported by Funk et al. (2003), Mario and Prisca (2010), the entire annual food production within the country covers approximately 90 – 95, which there has produced during the short and variable rainfall seasons. Relied on the rain-fed crop production system resulted in major food insecurity problems in several parts of the country (Pankhurst and Johnson, 1988). Therefore, it is important to support the rain-fed crop production by an irrigation agriculture system. Irrigation is one among the solutions to unravel the shortage of food within the area during which they followed the rain-fed agriculture system. It brings water from somewhere during which many water is out there to the fields where water is not available through man-made structures. It can help to alleviate poverty and achieve food security to enhance the income of the farmers through generating additional income during non-rain seasons. However, irrigation does not applicable everywhere. Thus, before surface irrigation is applied, land suitability analysis is extremely important to work out available suitable lands for surface irrigation. Land suitability analysis is typically conducted to work out suitable land classes for specific land use or crop production (Abdel et al., 2016). It are often conducted using the GIS-based analytical hierarchy process (AHP) method considering a group of criteria or parameters, typically, physical and chemical properties of soils, terrain condition, proximate to a water source, and land use the land cover can consider as limiting factor. Land suitability classification for surface irrigation is an integral a part of multi-objective land-use planning for usage, development, and operation water sources as land projects for irrigation components. They will support land use planning and management by determining suitable lands for surface irrigation (USDIBR, 2005).
Bellessa is one among the Districts in Ethiopia, which has many water sources in which rain-fed agriculture is that the only solution for food crop production. Thanks to the variability of rainfall in temporal and spatial, the Districts are usually suffering from food insecurity. This unpredicted and erratic distribution of rainfall in the study area resulted in crop failure and drought. Thus, food insecurity often turns into famine with the slightest adverse incident, particularly affecting the livelihood of the poor community of the rural. Hence, agricultural productivity is decline in rain-fed agriculture; it is important to use water to double crop productivity in dry season, which is the most important technique to transform low productivity of rain-fed agriculture into most effective, and efficient irrigated support agriculture (FAO, 1994). However, in this area, there is no study conducted associated with land suitability analysis for surface irrigation. Therefore, land suitability analysis for surface irrigation in this area is extremely important to support rain-fed agriculture by irrigation, which will help to alleviate poverty within the District. As mentioned overhead, the major objective of this study is to gauge and determine land suitability for surface irrigation within the study area (Bellessa Districts) using the GIS-based analytical hierarchy process (AHP) method.
Description of the Study Area
The study area is found within the central Gondar zone of Amhara Regional State, northwestern highlands of Ethiopia. It lies within the latitude, 1,352, 953 m N to 1, 1462, 596 m N, and therefore the longitude 304,377 m E to 461, 434 m E. The study area includes East Belessa, and West Belessa Districts. They will be accessed through asphalted and gravel roads as foot trials. The minimum and maximum altitudes of the study area are 1,114.8 m of the river gorge and 3076.7 m in hills and plateau lands (Fig. 1). The study area is characterized by concentrated streams, large rivers like Fota River, Mena River, Zana River, Nili River, and Bahir Libo River. The Mena and Nili River, which drains into the Tekeze River, join these tributaries. Both Mena and Nili River have many fish that the local people have used as an income source within the traditional way. The study area is characterized by a ridge, cliff, hill, plateau, deep River gorge, and delicate slope. A mean of 99% of the entire rainfall of the year delivers in July and August. The rainfall in these Districts is variable both temporally and spatially. This rainfall condition caused the failures of sustainable crop production thanks to the decline of soil moisture. This resulted in food insecurity and a lacks of potable water within the region. The temperature of the study area varies from place to put, as an example within the cool and subtropical zones, the temperature ranges from cool to moderate temperature. However, the tropical climate zone within the study area is characterized by hot to extremely popular temperatures. Approximately 100% of the population within the study area depends on agriculture to get income. Agriculture is that the key to livelihood within the proposed project area. it's a source of home consumption food needs and source of money that required to expense to satisfy other household needs including cloth, food oil, fuel oil, salt, coffee, and other social and economic expenses. These are produced using rainfall. Teff, maize, bean, pea, chickpea, potato, barley, wheat, and sorghum are major crops grown within the study area. Most of the proposed study area has not been covered with forest except seasonal crop cover. Very small bushes characterize the Torrid Zone, which is sparsely distributed.
Geologically, Ethiopia comprised the Precambrian basement rock, Paleozoic rock, Mesozoic marine rock, and Cenozoic volcanic rocks. However, the study area comprised mainly one formation besides recent soil sediments of the study area, which is that the Cenozoic of volcanic rocks (flood basalt).
Material
Data Used
Inland suitability evaluation, adequate and quality data is extremely important to supply a highly precious land suitability map of the study area. Thus, relevant data including soil physical characteristics, topographic, accessibility, and water source were collected (Table 2). These data were collected from the FAO, and Earthexplorer.org (Table 1). Eight input parameters, which were used for analysis, were selected based on data availability, agricultural history, literature review, and native condition of the study area (Table 1). These are slope, elevation, soil depth, soil drainage, soil type, soil texture, distance from the water source, and land use /land cover. The physical parameters were extracted from the food and agricultural organization (FAO) includes soil depth, soil drainage, soil texture, and soil type. Topographic condition is one among the factors, which will affect the suitability of land for agricultural activity. Slope can control the speed of erosion and deposition whereas elevation can control the climatic condition within the region. The slope gradient and elevation are sorts of topographic parameters, which were extracted from the SRTM DEM (30m resolution). Distance from the river was generated using Euclidian distance. The land use and land cover map of the study area were prepared from Landsat 8 satellite images using ERDAS and GIS 10.3.
Table 1 Data used
|
Data type |
Criteria |
Data sources |
Data format |
|
Soil physical parameter |
Soil texture Soil depth Soil type Soil drainage |
http://www.fao.org/soils-portal/data-hub/soil-maps-and-databases/faounesco-soil-map-of-the-world/en/ |
vector |
|
Topography |
Slope |
USGS |
raster |
|
Elevation |
USGS |
raster |
|
|
Landsat 8 satellite image |
Land use land cover |
USGS |
raster |
|
Water |
Distance to river |
ethiogis-mapserver.org/ |
vector |
Methods
For this research, data collection, satellite image analysis, land suitability factor evaluation, and mapping, and GIS-based analytical hierarchy process land suitability modeling were applied. In GIS-based land suitability analysis, the input file should be converted into an identical projection and same pixel sizes. For this purpose, after collecting the info, all the parameters were converted into a 30m resolution raster with an equivalent projection type. The rasterized parameters were reclassified and standardized supported the importance of every sub-criteria. After all, the suitability of the parameters was reclassified and rescaled which range from 1-7 (Effat and Hassan, 2013). The size of 1 refers to rock bottom importance, but 7 is that the higher importance. Besides, projection and pixel size, geo-database is extremely essential in data management within the GIS environment, therefore, two geo-database were built. After the database was built, an evaluation of the connection between land suitability and factors also because the significance of every parameter and sub-criteria was performed using the principle of the analytical hierarchy process. Therefore, eight land suitability factors were reclassified and rescaled. Then, the load of every criterion was calculated employing a pairwise comparison matrix. The weighted parameters (criteria) were sum up using weighted overlay methods in ArcGIS to get a land suitability index. After all, the land suitability index map was reclassified into four suitability classes using the natural break method within the ArcGIS tool. These are highly suitable (S1), suitable (S2), marginally suitable (S3), and unsuitable class (S4). The general methodology flow chart for this study is summarized in Fig.6.
Evaluation of Criteria Maps
Topographic parameters (slope and elevation)
The map of elevation and slope was generated from the Shuttle Radar Topography Mission (SRTM) digital elevation model (DEM) data of 30 m resolution which is downloaded from Earth explorer.org (Moore and Hansen 2011; Gorelick, 2013). Considering FAO (2003) manual, the slope and elevation of the study area were classified into different suitability classes (Table 3). The slope is one among the many parameters in land suitability analysis for surface irrigation which may also affect the irrigation land preparation, irrigation operation, production costs, method of irrigation, soil depth, and erosion (USDIBR, 2003; Kassaye et al., 2019). within the present study, the slope is taken into account as input parameters that were extracted from 30 m DEM resolution which was classified into four suitable classes of 0-2%, 2-5%, 5-8%, and >8% (USDIBR, 2003; Kassaye et al., 2019). The slope angle can affect the suitability of the land for surface irrigation in terms of land preparation for irrigation and operation also as moisture content and erosion rate. The steeper the slope, the harder surface irrigation operation and therefore the higher erosion rate. This results in the less agricultural productivity of the farm field.
Soil
As stated by Dagnenet (2013); USDIBR (2003), the soil is a crucial factor to work out the suitability of land for sustainable surface irrigation and agriculture. The soil can affect productivity capacity, production and irrigation operation, and development (Kasaye et al., 2019). The physical soil data were downloaded from Harmonized World Soil Database (HWSD). The physical characteristics of soil are often evaluated to work out soil suitability of irrigation (USDIBR 2003). The consequences of soil for irrigation and agriculture are primarily associated with soil fertility, toxicity, moisture content, depth, and credibility (USDIBR, 2003). The first factors are soil-moisture relationships, toxicity, fertility, depth to gravel and cobble, continuing layer, and erosion hazard. Therefore, for this study, physical (soil type, soil drainage, soil depth, and texture classes) are primary soil factors that extracted from HWSD (Table 3). the detail of degree of significance of parameter classes are summarized in Table 1 that has been organized by International Institute for Applied analysis (IIASA), ISRIC World Soil Information Institute of Soil Science Chinese Academy of Sciences (ISSCAS), Joint research facility of European Commission (JRC), and FAO (Nachtergaeele et al., 2009, Kassaye et al., 2019).
Land use land cover
Land use is one among the important parameters in land suitability analysis for surface irrigation. The land use map was generated from Landsat 8 satellite image that downloaded from the USGS website. It had been classified into four suitable classes of highly suitable (S1), suitable (S2), marginally suitable (S3), and not suitable (S4). Cropland was grouped as highly suitable (S1), but grassland is assessed as moderately suitable (S2).Woodland/Shrub/bush was classified as marginally suitable (S3) because it required initial investment for land preparation (Kassaye et al., 2019). The Forest/Barren land/Water body/Settlements are classified as not suitable (S4).
Distance to Streams
Evaluation and determination of the space to the water source are one among the foremost important inland suitability analyses for surface irrigation. Distance from water source was generated using Euclidean distance in ArcGIS which was classified into 0-1.23 (S1), 1.23-2.5 (S2), 2.5-3.7 km (S3), and > 3.7 (S4).
Table 2 Significance of physical factors for surface irrigation (Kassaye et al., 2019)
|
Parameters |
Parameters classes |
Degree of significance |
Sources |
|
Drainage |
Well Moderately Well Imperfectly Poor excessive |
Optimum moderate marginal Not ideal for upland crops has little significance |
Nachtergaele et al., 2009 Kassaye et al. 2019 |
|
Soil Depth(cm) |
< 10 .10 - 50 50 - 100 > 100 |
very low low Marginal Optimum |
Mandal et al., 2017 Kassaye et al. 2019 |
|
Soil Type |
Chromic Luvisols Humic Nitosols Eutric Vertisols Haplic Calcisols Rendzic Leptosols Lithic Leptosols |
Optimum Moderate marginal low very low very low |
FAO and UNESCO,1988 Kassaye et al. 2019 |
|
Texture Classes |
Sandy Loam Loamy Sandy Loam Silt Loam |
Marginal low Optimum Moderate |
USDIBR, 2003 Mandal et al., 2017 Kassaye et al. 2019 |
|
Euclidean Distance (km) |
0 - 5 5 - 10 10 - 20 > 20 |
optimum moderate marginal low |
Mandal et al, 2017 Kassaye et al. 2019 |
|
LULC |
Rangelands Farmland Dispersed Forest Settlement Bush Bare land |
Moderate Optimum Low Not optimal Marginal Not optimal |
Mandal et al, 2017 Kassaye et al. 2019 |
|
Slope (%) |
0 - 2 2 - 5 5 – 8 >8 |
Optimum Moderate Marginal Low |
Mandal et al, 2017 USDIBR, 2003 Buhari, 2014 Kassaye et al. 2019 |
Parameter Reclassification
Reclassification will tell us the degree of suitability of every class by partitioning it into different parts supported evidence. Parameter reclassification usually needs modeling experience and adequate field knowledge (Forkuo, 2011). Besides, assistance from other experts like from agricultural exports, and climatologist is extremely important to urge critical information during which soil texture, depth, type, drainage, elevation, slope, distance to a water source, and land use conditions are favorable for surface irrigation land suitability mapping. The values within the parameters must be prioritized in a single raster. Values in a particular raster might not be fit or fit the proposed objective (ESRI, 2017). For instance, the soil texture class (clay) is grouped under a highly suitable soil class (S1) compared to other classes. During this study, the parameter reclassification was performed using the size of 0.5 to 7 using the rule of land classification of ICARDA (2019) in Table 2. As shown in Table 3, all criteria are reclassified to different land suitability categories considering their suitability for surface irrigation. the number seven is assigned for highly suitable land class (S1), six is assigned for suitable land class (S2), three is assigned for marginally suitable land (S3) one is assigned for unsuitable land class at current condition (S4) and 0.5 is assigned for permanently unsuitable land class (S5).
Table 3 Reclassified parameters
|
Parameters |
Drainage Class |
Degree of importance |
Land suitability |
|
Soil drainage |
Excessive (LP) |
0.5 |
S5 |
|
Poor (VR) |
1 |
S4 |
|
|
Imperfect (CM) |
3 |
S3 |
|
|
Moderate (NT) |
6 |
S2 |
|
|
Well (LV) |
7 |
S1 |
|
|
Parameter |
Soil type Class |
Degree of importance |
Land suitability |
|
Soil type |
LP |
1 |
S4 |
|
VR |
3 |
S3 |
|
|
NT |
6 |
S2 |
|
|
CM/LV |
7 |
S1 |
|
|
Parameter |
Elevation Class |
Degree of importance |
Land suitability |
|
Elevation |
2225-2821 |
1 |
S4 |
|
1862-2225 |
3 |
S3 |
|
|
1609-1862 |
6 |
S2 |
|
|
1168-1609 |
7 |
S1 |
|
|
Parameter |
Distance to stream |
Degree of importance |
Land suitability |
|
Distance to stream |
<1.23 |
7 |
S1 |
|
1.23-2.5 |
6 |
S2 |
|
|
2.5-3.7 |
3 |
S3 |
|
|
> 3.7 |
1 |
S4 |
|
|
Parameter |
Texture |
Degree of importance |
Land suitability |
|
Soil texture |
Sandy loam |
3 |
S3 |
|
Loam |
6 |
S2 |
|
|
Clay |
7 |
S1 |
|
|
Parameter |
Depth |
Degree of importance |
Land suitability |
|
Soil depth (cm) |
10 |
3 |
S3 |
|
100 |
6 |
S2 |
|
|
Parameter |
LULC |
Degree of importance |
Land suitability |
|
LULC |
Forest/Barren land/Water body/Settlements |
1 |
S4 |
|
Woodland/Shrub/bush |
3 |
S3 |
|
|
Grassland |
6 |
S2 |
|
|
Cropland |
7 |
S1 |
|
|
Parameter |
Slope |
Degree of importance |
Land suitability |
|
Slope (%) |
<2 |
7 |
S1 |
|
2-5 |
6 |
S2 |
|
|
5-8 |
3 |
S3 |
|
|
>8 |
1 |
S4 |
Land Suitability Classification Structure
As stated by FAO (1976), Land suitability is that the fitness of a given sort of land for an outlined use. FAO (1976 and 2007) developed land suitability classes of highly suitable to not suitable lands (Table). These classes are generally classified into suitable and not suitable (S4 or N). In 1976 and 1983, FAO further classified the land into three and two classes respectively. This classification was made considering the advantages and limitations (Table 4). These are highly suitable (S1), moderately suitable (S2), marginally suitable (S3), temporarily not suitable (S4/N1), and permanently not suitable (S5/N2). Source: FAO, 1976 and 1981.
Table 4 Land suitability classification structures (FAO, 1976 and 1981)
|
Class |
Description |
|
S1 Highly Suitable |
Land without significant limitations. This land is the best possible and does not reduce productivity or require increased inputs.
|
|
S2 Moderately Suitable |
Land that is clearly suitable but has limitations that either reduce productivity or require an increase of inputs to sustain productivity compared with those needed on S1 land |
|
S3 Marginally Suitable |
Land with limitations so severe that benefits are reduced, and/or the inputs required sustaining production need to be increased so that this cost is only marginally justified. |
|
N1 Currently Not Suitable |
Land having limitations which may be surmountable in time, but which cannot be corrected with existing knowledge at currently acceptable cost; the limitations are so severe as to preclude successful sustained use of the land in the given manner |
|
N2 Permanently Not Suitable: |
Land having limitations that appear as severe as to preclude any possibilities of successful sustained use of the land in the given manner. |
Preparation of Datasets or Criteria Maps
Parameter preparation is one among the important steps of inland suitability analysis in surface irrigation. In this study, one database was built for criteria maps, which contains eight parameters. The parameters were converted into an equivalent pixel size and projection system. This study considers eight parameters like slope (Figure 3d), elevation (Figure 2b), land use (Figure 3c), soil texture (Figure 5h), depth, type (Figure 4f), and drainage (Figure 4e). The physical soil maps with attributes were extracted from HWSD and converted into roasters with an equivalent pixel size and projection using GIS. The slope, elevation, and distance from the water source are generated from 30 m DEM resolution. The land use /land cover map was derived from Landsat 8 satellite image (Figure 3c).
Analytical Hierarchy Process (AHP) and Pairwise Comparison Matrix
One of the semi-quantitative methods that won’t to determine land suitability for surface irrigation is named AHP. AHP may be a structured tool that helps to research difficult decisions supported mathematics and psychology (Cho et al. 2015; Nguyen et al. 2015; Saaty 2000). during this study, a pairwise comparison matrix was conducted using excel to supply weights for every parameter or criteria considering Saaty’s ranking scale (Luu et al. 2018; Saaty 2008). Before a pairwise comparison matrix is performed, scale is extremely important. For this, Saaty (2008) was developed a scale, which ranges from 1 to 9. This enables for the equitable comparison of the intensity of land suitability. One indicated equal importance of parameters whereas nine indicated extreme importance of the factor or the parameters (Malczewski, 1999; Saaty, 1980). During this study, an 8x8 comparison matrix was performed by assigning a worth from the range of 1-9 by comparing the parameter within the row to the parameter within the column (Table 5). for instance , from the matrix (Table 4), 9 was assigned for distance to water source compared to texture, depth, type, drainage, and LULC while 1/9 was assigned for texture, depth, type, drainage, and LULC compared to the space to a water source. After a completed comparison among all possible criteria or parameters, normalization was performed by dividing the cell by the column total (Saaty, 1977). Normalization of the matrix is extremely important to work out the standards weight. The load of every criterion or parameter is extremely important to gauge the importance of every parameter ashore suitability analysis or evaluation. This will be calculated using AHP calculators during a pairwise comparison matrix (Saaty, 1977). The load of every parameter is employed to gauge the relative importance of every criterion. Within the current study, Saaty’s method of eigenvectors or relative weights is calculated from the normalization table (Table 6). Within the analytical hierarchy process, consistency of calculated weight for every parameter or criteria is one among the issues that require examination (Luu et al. 2018; Saaty 2001). Therefore, after the load of the criterion was calculated, the consistency of the calculation was evaluated to gauge the strength of the tactic (Saaty, 1990; Garcı ́a et al., 2014). This will be determined using consistency ratio or relationship (CR) which may be estimated using Eq. 1.
 (1)
(1)
The CI was calculated using Eq. 2.
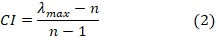
CI is that the consistency index (0.1396) and RI is that the random index; n may be a number of parameters (n=8) and λmax (8.977) is that the principal Eigenvalue. RI (1.41) is that the average of the consistency index during which it depends on the matrix given by Saaty (1977). CR is that the consistency ratio, which refers to the degree of the consistency or inconsistency of the parameters or criteria (Chen et al., 2010b). When CR>0.1, the pairwise comparison matrix is not correct and it needs revision. Supported the reason, the CR value for the present study area is <0.1 which is CR= 0.098987, therefore the matrix is correct. Then after evaluated the consistency condition of the weighted criteria, the land suitability class was generated using weight sum methods in ArcGIS (Rahmati et al., 2016c) as showed in Eq.3.
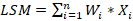 (3)
(3)
Where LSM is land suitability map, n is number of criteria or parameter, Wi is criteria weight, and Xi is criteria or parameter.
Table 5 Comparison matrix
|
Distance to Water source |
Slope |
Elevation |
Soil texture |
Soil drainage |
Soil depth |
LULC |
Soil type |
|
|
Distance to Water source |
1 |
5 |
7 |
9 |
9 |
9 |
9 |
9 |
|
Slope |
0.2 |
1 |
3 |
2 |
5 |
7 |
7 |
7 |
|
Elevation |
0.14 |
0.33 |
1 |
2 |
7 |
5 |
5 |
5 |
|
Soil texture |
0.11 |
0.5 |
0.5 |
1 |
5 |
7 |
7 |
7 |
|
Soil drainage |
0.11 |
0.2 |
0.14 |
0.2 |
1 |
1 |
2 |
5 |
|
Soil depth |
0.11 |
0.14 |
0.2 |
0.14 |
1 |
1 |
2 |
2 |
|
LULC |
0.11 |
0.14 |
0.2 |
0.14 |
0.5 |
0.5 |
1 |
2 |
|
Soil type |
0.11 |
0.14 |
0.2 |
0.14 |
0.2 |
0.5 |
0.5 |
1 |
|
Total |
1.89 |
7.45 |
12.24 |
14.62 |
28.7 |
31 |
33.5 |
38 |
|
Number of comparisons = 28 |
||||||||
|
Consistency Ratio CR = 9.9% |
||||||||
|
Principal Eigen value = 8.977 |
||||||||
Table 6 Normalized table
|
Distance to water source |
Slope |
Elevation |
texture |
drainage |
depth |
LULC |
type |
Eigenvector of Weights |
Weight % |
|
|
Distance to water source |
0.53 |
0.67 |
0.57 |
0.62 |
0.31 |
0.29 |
0.27 |
0.24 |
0.44 |
44% |
|
Slope |
0.11 |
0.13 |
0.25 |
0.14 |
0.17 |
0.23 |
0.21 |
0.18 |
0.18 |
18% |
|
Elevation |
0.07 |
0.04 |
0.08 |
0.14 |
0.24 |
0.16 |
0.15 |
0.13 |
0.13 |
13% |
|
texture |
0.06 |
0.07 |
0.04 |
0.07 |
0.17 |
0.23 |
0.21 |
0.18 |
0.13 |
13% |
|
drainage |
0.06 |
0.03 |
0.01 |
0.01 |
0.03 |
0.03 |
0.06 |
0.13 |
0.05 |
5% |
|
depth |
0.06 |
0.02 |
0.02 |
0.01 |
0.03 |
0.03 |
0.06 |
0.05 |
0.04 |
4% |
|
LULC |
0.06 |
0.02 |
0.02 |
0.01 |
0.02 |
0.02 |
0.03 |
0.05 |
0.03 |
3% |
|
Soil type |
0.06 |
0.02 |
0.02 |
0.01 |
0.01 |
0.02 |
0.01 |
0.03 |
0.02 |
2% |
Land suitability analysis is extremely important to work out the foremost suitable areas for surface irrigation considering various factors. For this, the present study was conducted on two Districts/Woredas to work out the doubtless suitable farmlands for surface irrigation. in this study, an analytical hierarchy processing method with GIS was wont to evaluate the connection between soil physical parameters, topography (slope and elevation), and land-use factors on the suitability of lands for surface irrigation. As shown in Table 5, the connection between governing factors and land suitability was determined using an 8x8 pairwise comparison matrix. For this study, eight governing factors like physical factors (soil texture, soil drainage, type, and soil depth), land use, topographic factors (slope and elevation), and distance to water source were considered as input parameters. The pair-wise comparison matrix was performed for eight major factors compared one to at least one and scored using the Saaty scale (Saaty,1977). The load of every parameter was calculated from the normalized table by the average sum of the row of the matrix (Table 6). The relative significance of every parameter is summarized in Table. Distance from a water source (44%), slope (18%), elevation (13%), soil texture (13%), and soil drainage (5%) have scored high weight criteria and that they are the foremost important factors in determining suitable lands for surface irrigation (Table) followed by soil depth (4%), LULC (3%), and soil type (2%).
Pairwise comparison matrix result
8x8 pairwise matrix was performed after reclassified and ranking eight criteria layers using AHP calculator and excel (Table 5) during which the diagonal line is equal to one. The importance of every criterion for surface irrigation is represented within the row of the pairwise matrix (Table 5). After the pairwise matrix was performed, normalization of the matrix was conducted to work out the standards weight (Table 6), which is that the average sum of the normalized row of the matrix. After the load of the standards was calculated, the correctness of the pairwise comparison matrix was evaluated using consistency ratio (CR). As stated by Saaty (1978), when CR<0.1, the matrix is correctly performed. The CR value in this study is <0.1 and it indicted no weight inconsistency.
Soil Physical Characteristics
In this study, soil type, texture, depth, and drainage were used which are classified into four sub-criteria like highly suitable, suitable, marginally suitable, and not suitable (Table 4 and 7). As indicated in Table 7, three soil texture types including loam, sandy loam, and clay are available within the study area. Soil texture can be controlled soil drainage, which may be good or bad for surface irrigation. If the soil is characterized by very coarse texture with very well sorted grain arrangements, the soil will loss the required water due to infiltration that might be affect the moisture content that could be required for crop growth. However, if the soil is fine, it will keep moisture content in soil mass that could be save time and water for irrigation. The soil texture in the study area was reclassified and standardized into three major land suitability classes as highly suitable (S1-clay) covers 15.9%/ 433.0 km2 or 43296.5 ha (Table 7) of the entire study area. The suitability class S1 is spatially distributed within the northwest and southeast parts of the study area. Moderately suitable class (S2) is characterized by loam soil texture, which covered about 62.5%/ 1697.6 km2 or 169763.6 ha (Table 7) large area of the study area. Marginally suitable land class (S3- sandy loam) is roofed moderately a good area compared to S1, which is about 21.6% / 586.2 km2 or 58619.1 ha (Table 7).
The soil depth is one among the foremost important parameters for effective surface irrigation. When the soil depth is shallow, the crop root depth and soil water content will be decreased, which can be resulted in crop failure in areas in which irrigation is not implemented and requires more frequent irrigation frequency. The soil depth of the study area ranges from moderately suitable to not suitable land classes. The moderately suitable (S2) class is spatially distributed within the central a part of the study area (Figure 2a) that's covered about 78.4%/2130.6 km2 or 213060.1 ha (Table 7) of the study area. The marginally suitable land class (S3) is extremely shallow soil depth, which is roofed about 21.6%/586.2 km2 or 213060.1 ha (Table 7) of the study area. It is spatially distributed within the south, the western and eastern parts of the study area (Figure 2a).
Soil drainage of the study area has reclassified into highly suitable (S1), moderately suitable (S2), marginally suitable (S3), and not an appropriate land class (S4). The land class S1 is roofed a few relatively large portion of the study area that is about 42.5%/1156 km2 or 115603.2 ha (Table 7) from the entire area. Moderately suitable class (S2) is roofed about 11.6%/316 km2 or 31547.8 ha (Table 7). The marginally suitable land class (S3) is roofed about 7.7%/208.6 km2 or 20862 ha (Table 7). Marginally suitable land class is roofed relatively very small area compared to S1. Not suitable land class (S4) is roofed 13%/354 km2 or 35403.7 ha (Table 7).
The soil type within the study area is reclassified and scaled into four land suitability classes (highly suitable, suitable, marginally suitable, and not suitable classes). The highly suitable land class (S1) is roofed about 50.2%/1364.7 km2 or 136465.2 ha (Table 7). The moderately suitable land class (S2) is roofed about 11.6%/316 km2 or 31597.8 ha (Table 7). The marginally suitable land class (S3) is roofed about 13%/354 km2 or 35403.7 ha (Table 7). The not suitable land class (S4) is roofed about 25%/682.3 km2 or 68231 ha (Table 7).
The topography (slope and elevation) were considered as input parameters in land suitability assessment. The topography can be controlled the speed of erosion, rate of soil deposit, and human activities. The slope gradient was reclassified and rescaled into four land suitability classes (Table 7) using the GIS tool. The highly suitable class (S1) is roofed about 3.2%/86.5 km2 or 8654.1 ha (Table 7). The moderately suitable land class (S2) is roofed about 12.7%/344.6 km2 or 34461.5 ha (Table 7). The marginally suitable land class (S3) is roofed about 11%/298.3 km2 or 29834.5 ha (Table 7). The land class S4 is roofed at about 73.1%/1987.3 km2 or 198729.9 ha (Table 7).
The second topographic factor is altitude or elevation, which may be controlled sort of act, land use, rainfall, and temperature condition. The elevation of the study area was reclassified and rescaled into highly suitable class (S1), moderately suitable land class (S2), the marginally suitable class (S3), and unsuitable land class (S4). The highly suitable land class is roofed at about 23.6%/640.2 km2 or 64022.4 ha (Table 7), which is dominantly found within the north, and eastern a part of the study area (Figure 2b). The moderate suitability class (S2) is roofed about 48.5%/1317.6 km2 or 131763.6 ha (Table 7), which is spatially distributed within the central a part of the study area (Figure 2b). The marginally suitable land class (S3) is roofed at about 21.5%/584.8 km2 or 58475.1 ha (Table 7), which is spatially distributed within the central, western, and southern parts of the study area (Figure 2b). The 6.4%/174.2 km2 or 17419 ha (Table 7) is roofed by unsuitable land class (S4), which is distributed within the western and south a part of the study area (Figure 2b).
Land use is one among the key elements, which helps to work out land suitability for surface irrigation. This parameter is employed to gauge the kinds of land use/cover within the region. The LULC of the study area was reclassified and rescaled into four land suitability classes (Table 7) of highly suitable (S1), suitable (S2), marginally suitable class (S3), and unsuitable class (S4 or N1). The highly suitable land class (S1), which covered about 38.8%/1053.2 km2 or 105316.9 ha (Table 7), but the second class (S2) is roofed about 4.2% / 1053.2 km2 or 105316.9 ha (Table 7). The third land suitability class (S3) is roofed about 32.3% / 877.5 km2 or 87747.7 ha (Table 7). About 24.8% / 673.5 km2 or 67348.4 ha (Table 7) is roofed by unsuitable land class (S4 or N1).
Distance to water source
Distance from the water source is one of the most important parameters in land suitability analysis for surface irrigation which indicated that the amount of lands close to the water source. 68.2% (1854.4 km2 or 185437.8 ha) of the area is found as highly suitable lands (S1) for surface irrigation. 28.2% (765.3 km2 or 76530.3 ha), 3.1% (83km2 or 8299.2 ha), and 0.5% (14.1 km2 or 1412.1 ha) of the areas are found as moderately suitable (S2), marginally suitable (S3) and not suitable (S4), respectively.
Table 7 Area coverage of suitability of parameters class
|
Soil drainage |
Drainage Class |
Degree of importance |
Land suitability |
Pixel area (m2) |
% Area |
Area (km2) |
Area (ha) |
|
Excessive |
0 |
S5 |
758122 |
25.1 |
682.3 |
68231.0 |
|
|
Poor |
1 |
S4 |
393374 |
13.0 |
354.0 |
35403.7 |
|
|
Imperfect |
3 |
S3 |
231800 |
7.7 |
208.6 |
20862.0 |
|
|
Moderate |
6 |
S2 |
351087 |
11.6 |
316.0 |
31597.8 |
|
|
Well |
7 |
S1 |
1284480 |
42.5 |
1156.0 |
115603.2 |
|
|
Parameter |
Soil type Class |
Degree of importance |
Land suitability |
Pixel area (m2) |
% Area |
Area (km2) |
Area (ha) |
|
Soil type |
LP |
1 |
S4 |
758122 |
25.1 |
682.3 |
68231.0 |
|
VR |
3 |
S3 |
393374 |
13.0 |
354.0 |
35403.7 |
|
|
NT |
6 |
S2 |
351087 |
11.6 |
316.0 |
31597.8 |
|
|
CM/LV |
7 |
S1 |
1516280 |
50.2 |
1364.7 |
136465.2 |
|
|
Parameter |
Elevation Class |
Degree of importance |
Land suitability |
Pixel area (m2) |
% Area |
Area (km2) |
Area (ha) |
|
Elevation |
2225-2821 |
1 |
S4 |
193544 |
6.4 |
174.2 |
17419.0 |
|
1862-2225 |
3 |
S3 |
649723 |
21.5 |
584.8 |
58475.1 |
|
|
1609-1862 |
6 |
S2 |
1464040 |
48.5 |
1317.6 |
131763.6 |
|
|
1168-1609 |
7 |
S1 |
711360 |
23.6 |
640.2 |
64022.4 |
|
|
Parameter |
Distance to stream |
Degree of importance |
Land suitability |
Pixel area (m2) |
% Area |
Area (km2) |
Area (ha) |
|
Distance to stream |
<1.23 |
7 |
S1 |
2060420 |
68.3 |
1854.4 |
185437.8 |
|
1.23-2.5 |
6 |
S2 |
850337 |
28.2 |
765.3 |
76530.3 |
|
|
2.5-3.7 |
3 |
S3 |
92213 |
3.1 |
83.0 |
8299.2 |
|
|
> 3.7 |
1 |
S4 |
15690 |
0.5 |
14.1 |
1412.1 |
|
|
Parameter |
Texture |
Degree of importance |
Land suitability |
Pixel area (m2) |
% Area |
Area (km2) |
Area (ha) |
|
Soil texture |
Sandy loam |
3 |
S3 |
651323 |
21.6 |
586.2 |
58619.1 |
|
Loam |
6 |
S2 |
1886262 |
62.5 |
1697.6 |
169763.6 |
|
|
Clay |
7 |
S1 |
481072 |
15.9 |
433.0 |
43296.5 |
|
|
Parameter |
Depth |
Degree of importance |
Land suitability |
Pixel area (m2) |
% Area |
Area (km2) |
Area (ha) |
|
Soil depth (cm) |
10 |
3 |
S3 |
651323 |
21.6 |
586.2 |
58619.1 |
|
100 |
6 |
S2 |
2367334 |
78.4 |
2130.6 |
213060.1 |
|
|
Parameter |
LULC |
Degree of importance |
Land suitability |
Pixel area (m2) |
% Area |
Area (km2) |
Area (ha) |
|
LULC |
Forest/Barrenland/Water body/Settlements |
1 |
S4 |
748315 |
24.8 |
673.5 |
67348.4 |
|
Woodland/Shrub/bush |
3 |
S3 |
974974 |
32.3 |
877.5 |
87747.7 |
|
|
Grassland |
6 |
S2 |
125386 |
4.2 |
112.8 |
11284.7 |
|
|
Cropland |
7 |
S1 |
1170188 |
38.8 |
1053.2 |
105316.9 |
|
|
Parameter |
Slope |
Degree of importance |
Land suitability |
Pixel area (m2) |
% Area |
Area (km2) |
Area (ha) |
|
Slope (%) |
<2 |
7 |
S1 |
96157 |
3.2 |
86.5 |
8654.1 |
|
2-5 |
6 |
S2 |
382906 |
12.7 |
344.6 |
34461.5 |
|
|
5-8 |
3 |
S3 |
331494 |
11.0 |
298.3 |
29834.5 |
|
|
>8 |
1 |
S4 |
2208110 |
73.1 |
1987.3 |
198729.9 |
Land Suitability
Bojorquez et al. (2001) stated that land suitability analysis for surface irrigation is required an interdisciplinary approach which including information from various sources like soils, LULC, distance from the water source, and topography. Land suitable potential for surface irrigation decided supported specific criteria for all eight factors dataset. Then, the weighted criteria maps were sum up together to supply the ultimate land suitability map using the weighted sum method within the ArcGIS tool. The ultimate suitability map showed the spatial distribution of the acceptable land classes for surface irrigation (Figure 7). Out of the entire study area, 12.2% (331.2km2 or 33170.9 ha) (Table 8) of the study area is roofed by a not suitable area (S4). this is often thanks to far distance from the water source, steep slope, excessive drainage, shallow soil depth, high altitude, settlements, forest, waterbody, leptosols, and poor drainage, which is in line with the work of Albaji et al. (2009); Abraham et al. (2013); Kassaye et al. (2019). The 26.9% (731.1 km2 or 73170.3 ha) (Table 8) area was covered by a touch suitable class (S3). Because, this region is characterized by imperfect soil drainage, moderately elevated area, marginally on the brink of a water body, sandy loam soil texture, very shallow soil depth, and bushland, which is in line with the work of Albaji et al. (2009); Abraham et al. (2013); Kassaye et al. (2019). The 46.9% (1273.97 km2 or 127397.2 ha) (Table 8) area from the entire study area is roofed by moderately suitable class (S2). Thanks to the presence of moderately deep soil, grassland, moderately on the brink of a water source, nitisols, and moderately drained soil mass, which is in line with the work of Albaji et al. (2009); Abraham et al. (2013); Kassaye et al. (2019). the primary suitable class (S1) is roofed about 13.9% /378.8 km2 or 37876.9 ha (Table 8) thanks to the presence of well drainage soil, camisoles/luvisols type, low elevated land, closest to water sources, clay soil texture, and currently cultivated lands, which is in line with the work of Albaji et al. (2009); Abraham et al. (2013); Kassaye et al. (2019). the general results showed that the physical factors like slope, soil depth, drainage, texture, type, and altitude highly determined the suitability of land for surface irrigation within the study area which is in line with the work of Albaji et al. (2009); Abraham et al. (2013); Kassaye et al. (2019). As showed in Figure 8, the existed irrigation is fall under the highly suitable and moderately suitable lands, which confirms the present land suitability model is accurate.
Table 8 Land suitability class
|
Land suitability class |
Pixel Area (m2) |
Area (%) |
Area (km2) |
Area (ha) |
|
Not suitable (S4) |
368566 |
12.2 |
331.7 |
33170.9 |
|
Marginally suitable (S3) |
812337 |
26.9 |
731.1 |
73110.3 |
|
Moderately suitable (S2) |
1415524 |
46.9 |
1273.97 |
127397.2 |
|
Highly suitable (S1) |
420854 |
13.9 |
378.8 |
37876.9 |
In the present study, eight parameters were evaluated using the rule of analytical hierarchy process method integrated with ArcGIS to supply a final land suitability map for surface irrigation. The results of the pairwise comparison matrix from the normalized table showed that distance from a water source (44%), slope (18%), elevation (13%), soil texture (13%), and soil drainage (5%) have scored high weight criteria. Moreover, they are the foremost important factors in determining suitable lands for surface irrigation (Table) followed by soil depth (4%), LULC (3%), and soil type (2%). After the load of every parameter decided, the final suitable map was generated with four classes of highly suitable (S1), moderately suitable (S2), marginally suitable (S3), and not suitable (S4) which will leave surface irrigation to support the rain-fed agriculture by surface irrigation. The result showed that 13.9%, 46.9%, 26.9%, and 12.2% of the study area is roofed by highly suitable (S1), moderately suitable (S2), marginally suitable (S3), and not suitable (S4), respectively. Hence, this work showed the spatial distribution of suitable and not suitable lands for surface irrigation, the concerned body could also be at the Zonal/Woreda level should take a measurement to implement surface irrigation on highly suitable regions (S1). Hence, this work is only focused on the assessments of the suitability of the land for surface irrigation; it can be recommended that evaluation of the availability of water a
Acknowledgments
First, I would like to thanks the almighty God who allowed me to accomplish this research work. Next, I would like to give my gratitude to my lovely family and friends for their continuous support during the research work. Finally, I would like to thank the University of Gondar.
Authors’ Contributions
All activities starting from the conception and design of the work, the developments of the models as well as the analytical hierarchy process analysis and interpretations of the results were done by me.
Funding
It is not applicable in this case.
Available of data and material
All the datasets that have been used and analyzed during the current study is available from the corresponding author on reasonable request.
Competing interests
I have declared that there are no competing interests.
Author details’
The author has MSc in Engineering Geology at Department of Geology in University of Gondar, Ethiopia
[email protected], +251935452268
- Abdel Rahman MAE, Natarajan A, Hegde R (2016) Assessment of land suitability and capability by integrating remote sensing and GIS for agriculture in Chamarajanagar district, Karnataka, India. The Egyptian Journal of Remote Sensing Space Science, 19(1), 125–141. Doi: 10.1016/j. ejrs.2016.02.001
- Mehari A, and Alebachew (2013) A Land Suitability Evaluation for Irrigation in Dejen District, Ethiopia. International Journal of Scientific Research Publications 3(9):2250–3153
- Albaji M, Boroomand S, Ali H, Naseri A (2009) Comparison Of Different Irrigation Methods Based On The Parametric Evaluation Approach In The Plain West Of Shush, Iran
- Bojorquez TLA, Diaz-Mondragon S, Ezcurra E (2001) GIS-Based Approach for Participatory Decision-Making and Land Suitability Assessment. Int J Geogr Inf Sci 15(2):129–151
- U.S. Department of the Interior Bureau of Reclamation (2005) Technical Guidelines for Irrigation Suitability Land Classification. Technical Service Center Land Suitability and Water Quality Group Denver, Colorado
- Mandal B, Dolui G, Satpathy S (2017) Land suitability assessmentfor potential surface irrigation of river catchment for irrigation development in Kansaiwatershed, Purulia, West Bengal,India.Springer International Publishing,DOI 10.1007/s40899-017-0155-y
- Nachtergaele F, Van HV, Verelst L, Batjes N, Dijkshoorn K van, Fischer VE, Jones G, Montanarella A, Petri L, Prieler M, Teixeira S, Wiberg E,D., and Shi X (2009) Harmonized World Soil Database (version 1.1). FAO, Rome
- USDIBR (United State Department of the Interior Bureau of Reclamation) (2003) Technical
- Guidelines for Irrigation Suitability Land Classification. Technical Service Center Land Suitability and Water Quality Group Denver, Colorado
- Kassaye Hussien1*, Gezahagn Woldu1and Shimelis Birhanu (2019) A GIS-Based Multi-Criteria Land Suitability Analysis for Surface Irrigation along the Erer Watershed, Eastern Hararghe Zone, Ethiopia. East African Journal of Sciences 13(2):169–184
- Funk C, Asfaw A, Stffen P, Senay C, Rowland J, Verdin J (2003) Estimating meher crop production using rainfall in the long cycle region of Ethiopia (FEWS net special report)
- Mario Z, James B, Prisca K (2010) Special Report: FAO/WFP crop and food security assessment mission to Ethiopia. publication of food and agriculture organization of United Nations and world food program, Rome
- Pankhurst R, Jonson DH (1988) The great drought and famine of 1988–92 in northeast Africa. The ecology of survival: case Studies from Northeast African History, Vol. 47–72
- Sleshi Bekele A, Yilma A, Loulseged D, Loiskandl W, Ayana M, Alamirew T (2007) Water Resources and Irrigation Development in Ethiopia, vol 78. International Water Management Institute, Colombo
- Sleshi Y, Camberlin P (2006) Recent changes in a dry spell and extreme rainfall events in Ethiopia. Theoretical applied climatology 83(1):181–191
- FAO (1976) a framework for land evaluation: Soils Bulletin 32. Food and Agriculture Organization of the United Nations, Rome
- Cho S, Kim J, Heo E (2015) Application of fuzzy analytic hierarchy process to select the optimal heating facility for Korean horticulture and stockbreeding sectors. Renew Sustain Energy Rev 49:1075–1083
- Luu C, Von Meding J, Kanjanabootra S (2018) Assessing food hazard using food marks and analytic hierarchy process approach: a case study for the 2013 food event in Quang Nam. VietnamNat Hazards 90:1031–1050
- Rahmati O, Pourghasemi HR, ZeinivandH (2016) Golastan Province, IranGeocarto Int,31, 42–70,https://doi. org/10.1080/10106049.2015.1041559
- SaatyTL (2000) Fundamentals of decision making and priority theory with the analytic hierarchy process. Rws Publications, Pittsburgh
- Saaty TL (2001) The seven pillars of the analytic hierarchy process. In: Köksalan M, Zionts S (eds) Multiple criteria decision making in the new millennium. Springer, Berlin, pp 15–37
- Saaty TL (2008) Decision making withthe analytic hierarchy process. Int J serv Sci 1:83–98
- Chen Y, Yu J, Khan S (2010b) Spatial sensitivity analysis ofmulti-criteria weights in GIS-based land suitability evaluation.Environ. Model Softw 25(12):1582–1591. http://dx.doi.org/10.1016/j.envsoft.2010.06.001
- Saaty TL (1977) A scaling method for priorities in hierarchicalstructures. J Math Psychol 15:234–281. http://dx.doi.org/10.1016/0022-2496(77)90033-5
- Saaty TL (1980) The Analytic Hierarchy Process. McGraw-Hill, NewYork
- Buhari U (2014) Sugar Cane Modeling Using GIS and Remote Sensing Techniques Thesis submitted in partial fulfillment of the requirements for the degree of MSc Geographical Information Management. School of Applied Sciences. Cranfield University
- Dagnenet Sultan (2013) Assessment of Irrigation Land Suitability and Development of Map for the Fogera Catchment Using GIS, South Gondar. Asian Journal of Agriculture Rural Development 3(1):7–17
- FAO (Food and Agriculture Organization) (1983) Guidelines for the Preparation of Irrigation and Drainage Projects. Revised version
- FAO (Food and Agriculture Organization) (2007) Land Evaluation. Rome
- Forkuo EK (2011) Flood Hazard Mapping using Aster Image data with GIS. International journal of geomatics geosciences 1(4):19
- FAO (Food and Agriculture Organization) (2003) Unlocking the Water Potential of Agriculture, Rome, Italy
- Saaty TL (1978) Exploring the Interface between Hierarchies, Multiple Objectives and the Fuzzy Sets. Fuzzy Sets Syst 1:57–68. http://dx.doi.org/10.1016/0165-0114(78)90032-5
- Effat HA, Hassan OA (2013) designing and evaluation of three alternatives highway routes using the analytical hierarchy process and the least-cost path analysis, application in Sinai Peninsula, Egypt. Egypt J Remote Sens Space Sci 16(2):141–151