Bioinformatics
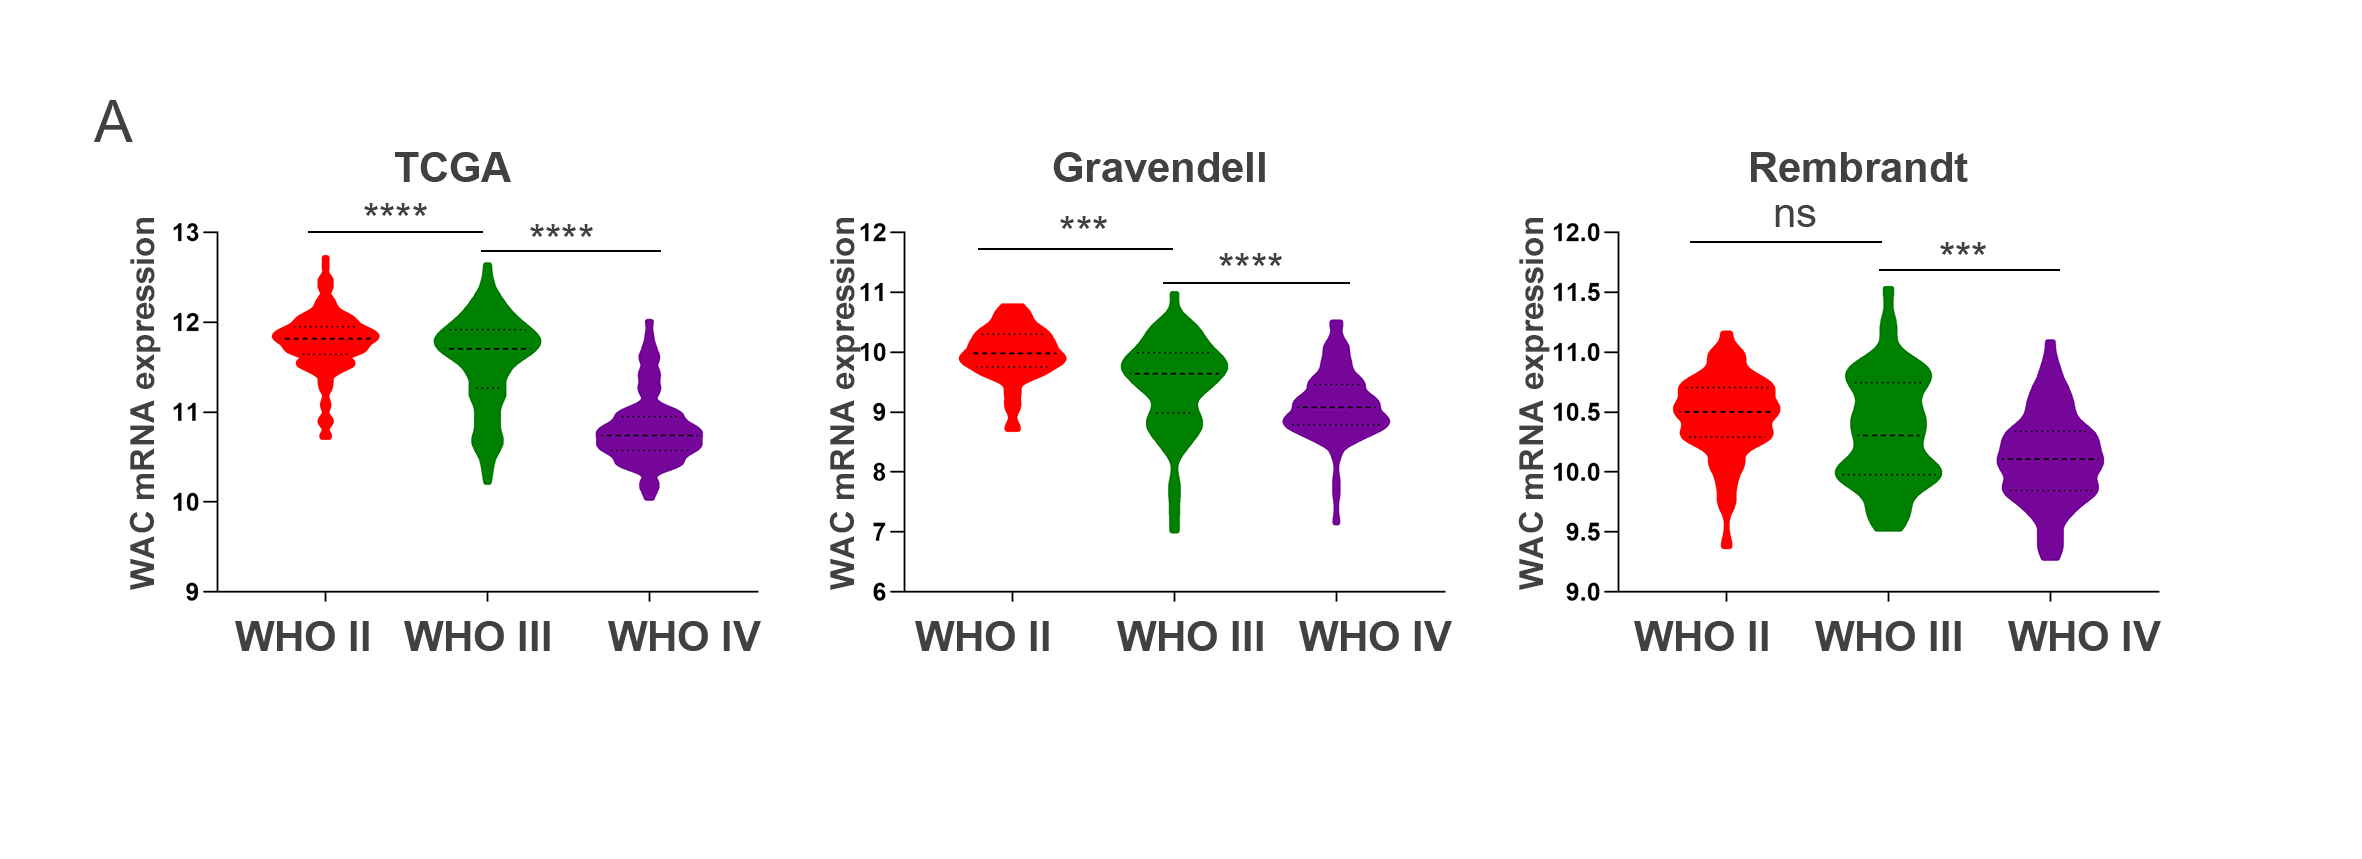
To illustrate the expression pattern and clinical features of WAC in GBM, we used the Gliovis portal (http://gliovis.bioinfo.cnio.es/). Data mining and analysis were performed from three different databases: The Cancer Genome Atlas (TCGA), Gravendell and Rembrandt.
Human tissues
Normal brain tissue and human GBM tissues were collected from the Department of Neurosurgery, Renmin Hospital of Wuhan University. Tumor specimen was confirmed by the pathologists of the Department of Pathology at the Renmin Hospital of Wuhan University. Non glioma specimens were collected from patients with various traumatic brain injuries during the course of surgery with informed consent. Tissue acquisition and use in this study were performed with patients signed informed consent and were approved by the institutional ethics committee of the medical department, Renmin Hospital of Wuhan University.
Cell culture
Human glioblastoma cell lines (U87 and A172) purchased from the Cell Bank of the Shanghai Institute of Biochemistry and Cell Biology, Chinese Academy of Sciences (Shanghai, China), the cells were cultured in high-glucose DMEM (Gibco, Thermo Fisher Scientific) supplemented with 10% fetal bovine serum (Thermo Fisher Scientific) and 1% penicillin/streptomycin (Thermo Fisher Scientific), and the incubating temperature was 37 °C, with 5% CO2.
RNA extraction and quantitative real-time PCR
Total RNA was extracted from tissues and cells using Trizol reagent (Invitrogen, USA). Next, we used the PrimeScript RT reagent kit with gDNA Eraser (Takara, Tokyo, Japan) to prepare for cDNA, and real-time PCR was performed using SYBR Premix Ex Taq II (RR820A, Takara) according to the manufacturer's protocol. The comparative Ct method was adopted to compare the experimental and control groups, and GAPDH was used for normalization. The specific primer pairs were as follows: GAPDH (forward primer, 5´-ACAACTTTGGTATCGTGGAAGG-3'; reverse primer, 5´-GCCATCACGCCACAGTTTC-3'); WAC (forward primer, 5´-GTTCCACAGTCGCCAATACCTC-3'; reverse primer, 5´-GCAGATGGTCCAGCAGTAAGAA-3'); Beclin1(forward primer, 5´-GAGCCATTTATTGAAACTCCTCG-3'; reverse primer, 5'- CCCAGTGACCTTCAGTCTTCG-3'); p62 (forward primer, 5´-GGAAGGTGAAACACGGACACTT-3'; reverse primer,5´-CTCTTCTCCTCTGTGCTGGAACT-3'); LC3B (forward primer, 5'- GTTGGCACAAACGCAGGGTA-3'; reverse primer, 5´-ACACTGCTGCTTTCCGTAACAA-3').
DNA construction and transfection
WAC cDNA was subcloned with a Flag tag (Flag-WAC) into the PCDNA3.1. The cells were seeded into the 6-well plate one night before transfection, and transfected with the help of the transfection reagent Lipofectamine 3000 (L3000015, Thermo Fisher Scientific) according to the guidance of the reagent manufacturer.
Antibodies and reagents
The primary antibodies used were anti-WAC (bs-12787R, Bioss, China), anti-DYKDDDK/Flag-tag (ANT102, Antgene, China), anti-P62 (M162–3, Medical Biological Laboratories, Japan), anti-Beclin1 (11306–1-AP, Proteintech, USA), anti-LC3B (GB11124, Service, China), anti-BAX (50599–2-Ig, Proteintech, USA), anti-Bcl-2 (GTX100064, GeneTex, USA), anti-GAPDH (#5174, Cell Signaling Technology, USA).
Clone formation
U87 and A171 cells were digested with trypsin 24 h after transfection and inoculated into 6-well plates at a density of 1000 cells per well. The cells were then incubated in a humidified incubator at 37°C and 5% CO 2 until the clones were visible to the naked eye. The medium was then removed, the cells were washed with phosphate buffer (PBS), fixed with 4% paraformaldehyde, and stained with crystal violet. The number of colonies with ≥50 cells was counted under an inverted microscope (Olympus, Tokyo, Japan).
Cell count kit-8(CCK-8) assay
CCK-8 (SolarBio Biotech Corp., Beijing, China) was used to detect cell viability according to the manufacturer's instructions. In short, approximately 4×10³ cells were plated into each well of the 96-well plate. At 24, 48 and 72 h after transfection, a 10% volume of CCK8 solution was added to each well and incubated in the dark for two hours. OD values were measured at 450 nm to determine cell viability. Three separate experiments were conducted.
EdU-DNA Synthesis Assay
Cell-Light EdU Apollo567 In Vitro Kit (RiboBio, Guangzhou, China) was used to study the DNA synthesis activity in WAC-treated cells. According to the reagent vendor's protocol, cells were seeded in 96-well plates at 5000 per well. Edu was added to the medium at 50 µl 48 h after transfection, followed 2 h later by fixing the cells in 4% paraformaldehyde for 30 min, permeated with 0.5% Trixon-X 100 for 10 min, and then stained with 10 μM Apollo 567 for 30 min. The cells were then restained with Hoechst 33342 to hide from light for 30 min. EdU was visualized using a fluorescence microscope (Olympus BX51, Japan).
Flow Cytometric analysis
Forty-eight hours after transfection, AN Annexin V-PE/7-AAD Kit (Becton Dickinson, New Jersey, USA) was used to measure the apoptosis rate of GBM cells. The cells were digested with EDTA-free trypsin, collected, and then washed three times with cold PBS. After samples were stained with 5 µl of Annexin V-PE and l of 7-AAD for 15 min in the dark, 400 µl of 1 x Binding Buffer was mixed into the mixture. Finally, apoptosis results were analyzed by Cytoflex Flow Cytometer (Beckman Coulter) and FlowJo 10.0.7 software.
TUNEL assay
Forty-eight hours after transfection, the cells were immobilized in 4% paraformaldehyde for 15 min. Next, we used the Tunel Kit (Roche Diagnostics, Mannheim, Germany) and followed the protocol provided by the reagent vendor to detect apoptosis. Finally, under the Olympus BX51 microscope (Olympus, Japan), TUNEL positive cells show green fluorescence. ImageJ software is used to count the TUNEL positive cells. The experiment was carried out three times independently.
Assay of green fluorescent protein-LC3 Puncta
WAC plasmids were transfected into GBM cells that stably expressed green fluorescent protein (GFP)-LC3. The cells were fixed with 4% paraformaldehyde 48 h after transfection. Then the GFP-LC3 spots in the cells were observed using confocal laser scanning microscopy (Olympus, Japan). Count the mean of GFP-LC3 points/cell in at least 100 cells.
Western blotting
The RIPA lysis buffer containing the protease inhibitor mixture (Beyotime, Shanghai, China) was used to extract the protein, and the protein concentration was determined using the BCA assay (Biosharp, China). The sample and loading buffer were thoroughly mixed. Heat at 100°C for 5 minutes. Next, each sample of the same concentration was separated by 10% or 12% sodium dodecyl sulfate-polyacrylamide gel electrophoresis and transferred to the PVDF membrane. Block with 5% skim milk at room temperature for 1 hour and incubate overnight with diluted primary antibody at 4°C. After three elutions with PBST to remove residual primary antibodies, the membrane was incubated with Alex Fluor 680/790 labeled secondary antibodies (Li-Cor Bioscience, USA) for 1 to 2 h. Finally, the proteins were visualized using the Li-Cor Odyssey Infrared Imaging System (Li-Cor Bioscience). The relative density of the strips was analyzed by Image J software version 1.8.0. GAPDH was used as an internal control.
Immunohistochemistry
After the tissue sections were dewaxed and hydrated, they were immersed in a microwave oven boiling Tris-EDTA buffer (pH 9.0) for antigenic repair and then incubated overnight with anti-WAC (1:100; Bioss) at 4°C. The next day, the slides were washed and incubated with the secondary antibody for 1 hour. Finally, DAB staining was used to detect the signal, and hematoxylin was restained. After dehydration, the film was sealed with neutral resin. Images were visualized by Olympus.
Transmission Electron microscopy (TEM)
Cells transfected with Flag-WAC or control plasmid were fixed with an electronic fixation solution containing 2.5% glutaraldehyde and post-fixed in 1% osmic acid. The fixed sample was then dehydrated using a graded series of ethanol (70-100%) and finally embedded in the EPON resin. An ultrafine slicer was used to cut ultrafine slices and was double-stained with uranium dioxide acetate and lead citrate. The stained sections were then observed using a transmission electron microscope (Hitachi HT7700, Tokyo, Japan).
Statistical analysis
GraphPad Prism 8.0 software was used to analyze and generate graphs in this study, and all data were presented as mean ± standard deviation. Student T-test determined differences between two groups, and One-way ANOVA determined differences between multiple groups. Kaplan-Meier and log-rank tests were used for survival analysis. P < 0.05 was considered statistically significant.