The Landscape of Immune cell Infiltration in the TME of Colorectal Cancer
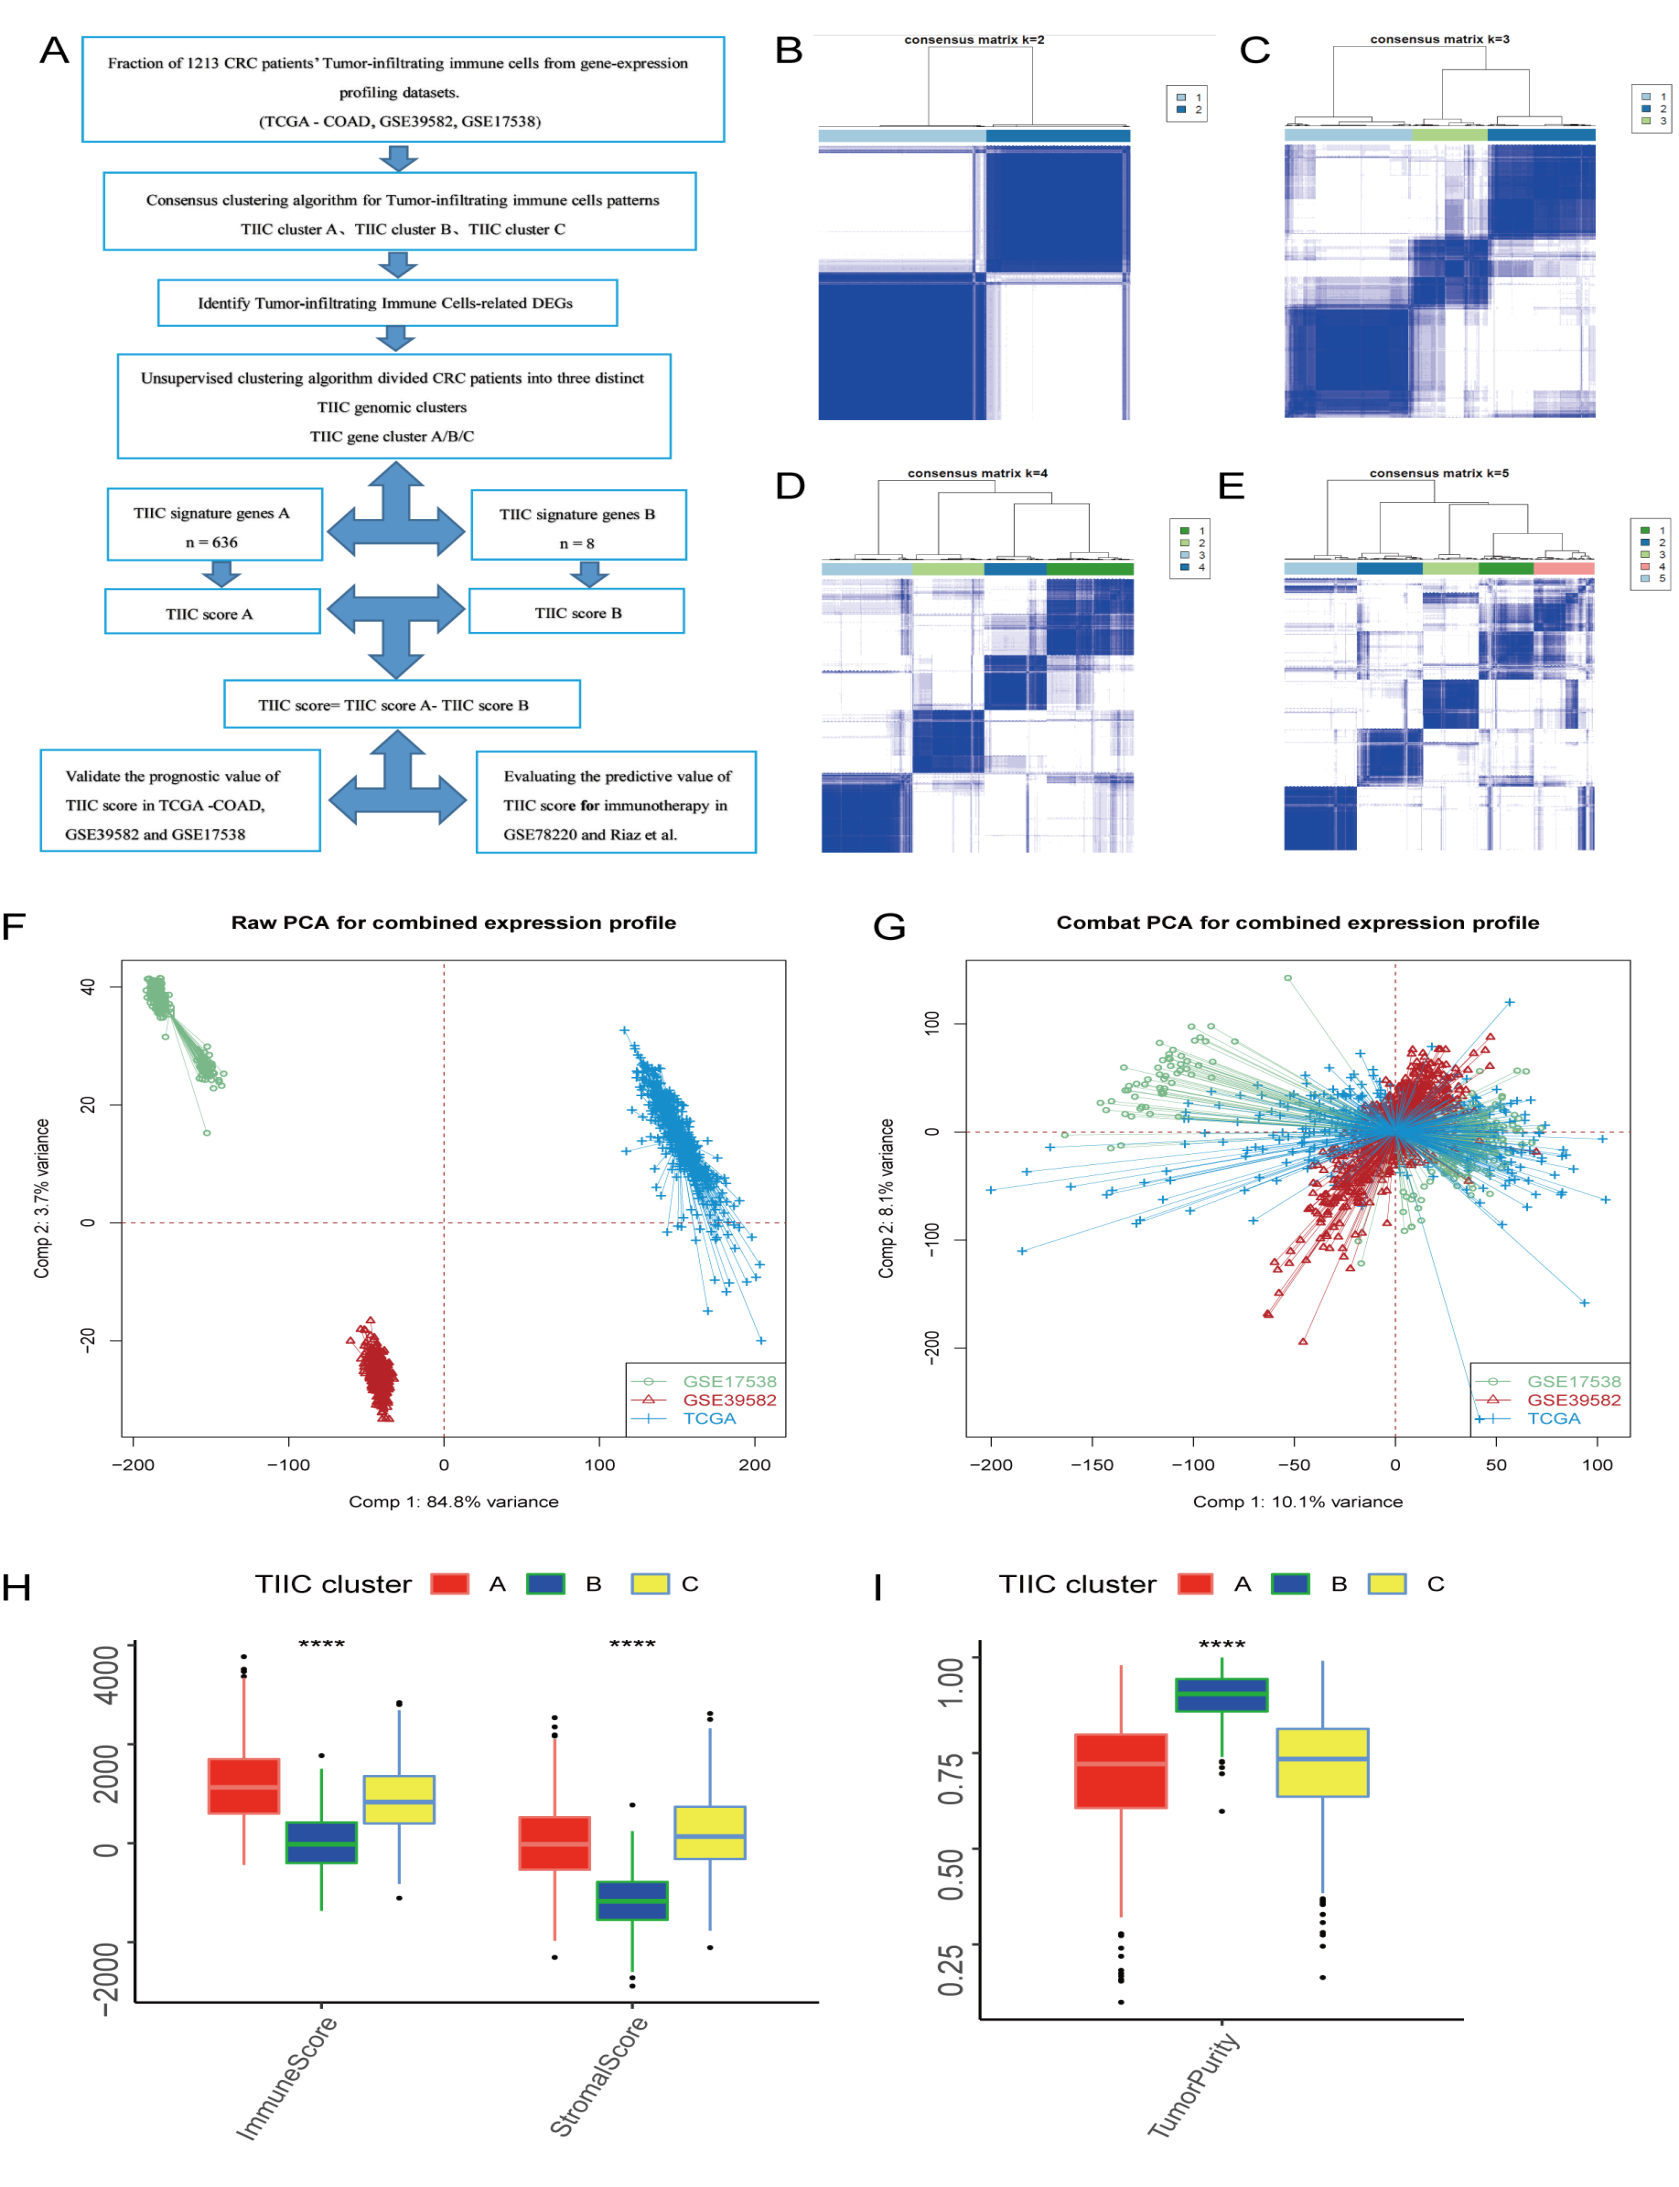
To eliminate the expressional batch effect within meta-cohort consisting of TCGA-COAD, GSE39582 and GSE17538 (Figure S1F), the Combat algorithm in the “sva” R package was used to eliminate batch effects, and the result are shown in (Figure S1G). We next applied the CIBERSORT algorithm to estimate the relative abundance level of 22 immune cell subsets in the TME, and performed the ESTIMATE algorithm to quantified TME components across distinct subtypes (18, 19)(Table S3). Unsupervised clustering of 1213 tumor samples with matched Tumor-infiltrating immune cells (TIIC) profiles from meta-cohort was used to probe the different clinical characteristics and biological behaviors among TIIC subtypes (Fig. 1A; Figure S1B-E). Accordingly, we identified three distinct TME immune cell infiltration clusters, including 503 samples in pattern cluster TIIC-A, 422 samples in cluster TIIC-B and 288 samples in cluster TIIC-C.
Three main TIIC subtypes in prognostic analysis exhibited significant differences (log-rank test, p = 0.007, Fig. 1B). To further explore the differences between these intrinsic phenotypes due to the distinct biological and clinical, we analyzed the different infiltration levels of immune cells in the TME (Fig. 1C). Among these main TIIC subtypes, TIIC-A showed a prominent prognosis in 5-years survival probability (29.0%) and exhibited high infiltration of naive B cells, resting dendritic cells (DCs), M1 macrophages, resting Mast cells (MCs), resting natural killer (NK) cells, activated memory CD4 + T cells, CD8 T cells, follicular helper T cells. The intermediate prognosis in 5-years survival probability of TIIC-B was 28.4% and showed significant enrichment in the infiltration of memory B cells, activated DCs, Monocytes, resting NK cells, Plasma cells, resting memory CD4 T cells, regulatory T cell. Lastly, TIIC-C had the worst prognosis in 5-years survival probability (26.3%). It was marked by high eosinophils, M0/2 macrophages, activated MCs, neutrophils. Aditionally, we examined the significant differences between the TME immune cell infiltration type using Kruskal-Wallis test and visualized the universal landscapes of immune cell types in TME by heatmap of correlation confidence (Fig. 1D). PD-1/L1 as a well-recognised biomarker for evaluating the anti-PD-1/L1 treatment (29), we further analyzed the PD-1/L1 expression level in each TIIC subtype and TIIC-A exhibited significant increase both in the expression of PD-1/L1 (Fig. 1E-F). In terms of “Immune score” and “Stromal score”, the previous score was significantly higher in TIIC-A and the latter score was significantly increase in TIIC-C (Kruskal–Wallis, p < 0.0001 Figure S1H). Conversely, TIIC-B had a higher tumor purity than TIIC-A and TIIC-B (Figure S1I).
Tumor-infiltrating Immune Cells-related DEGs in Colorectal Cancer
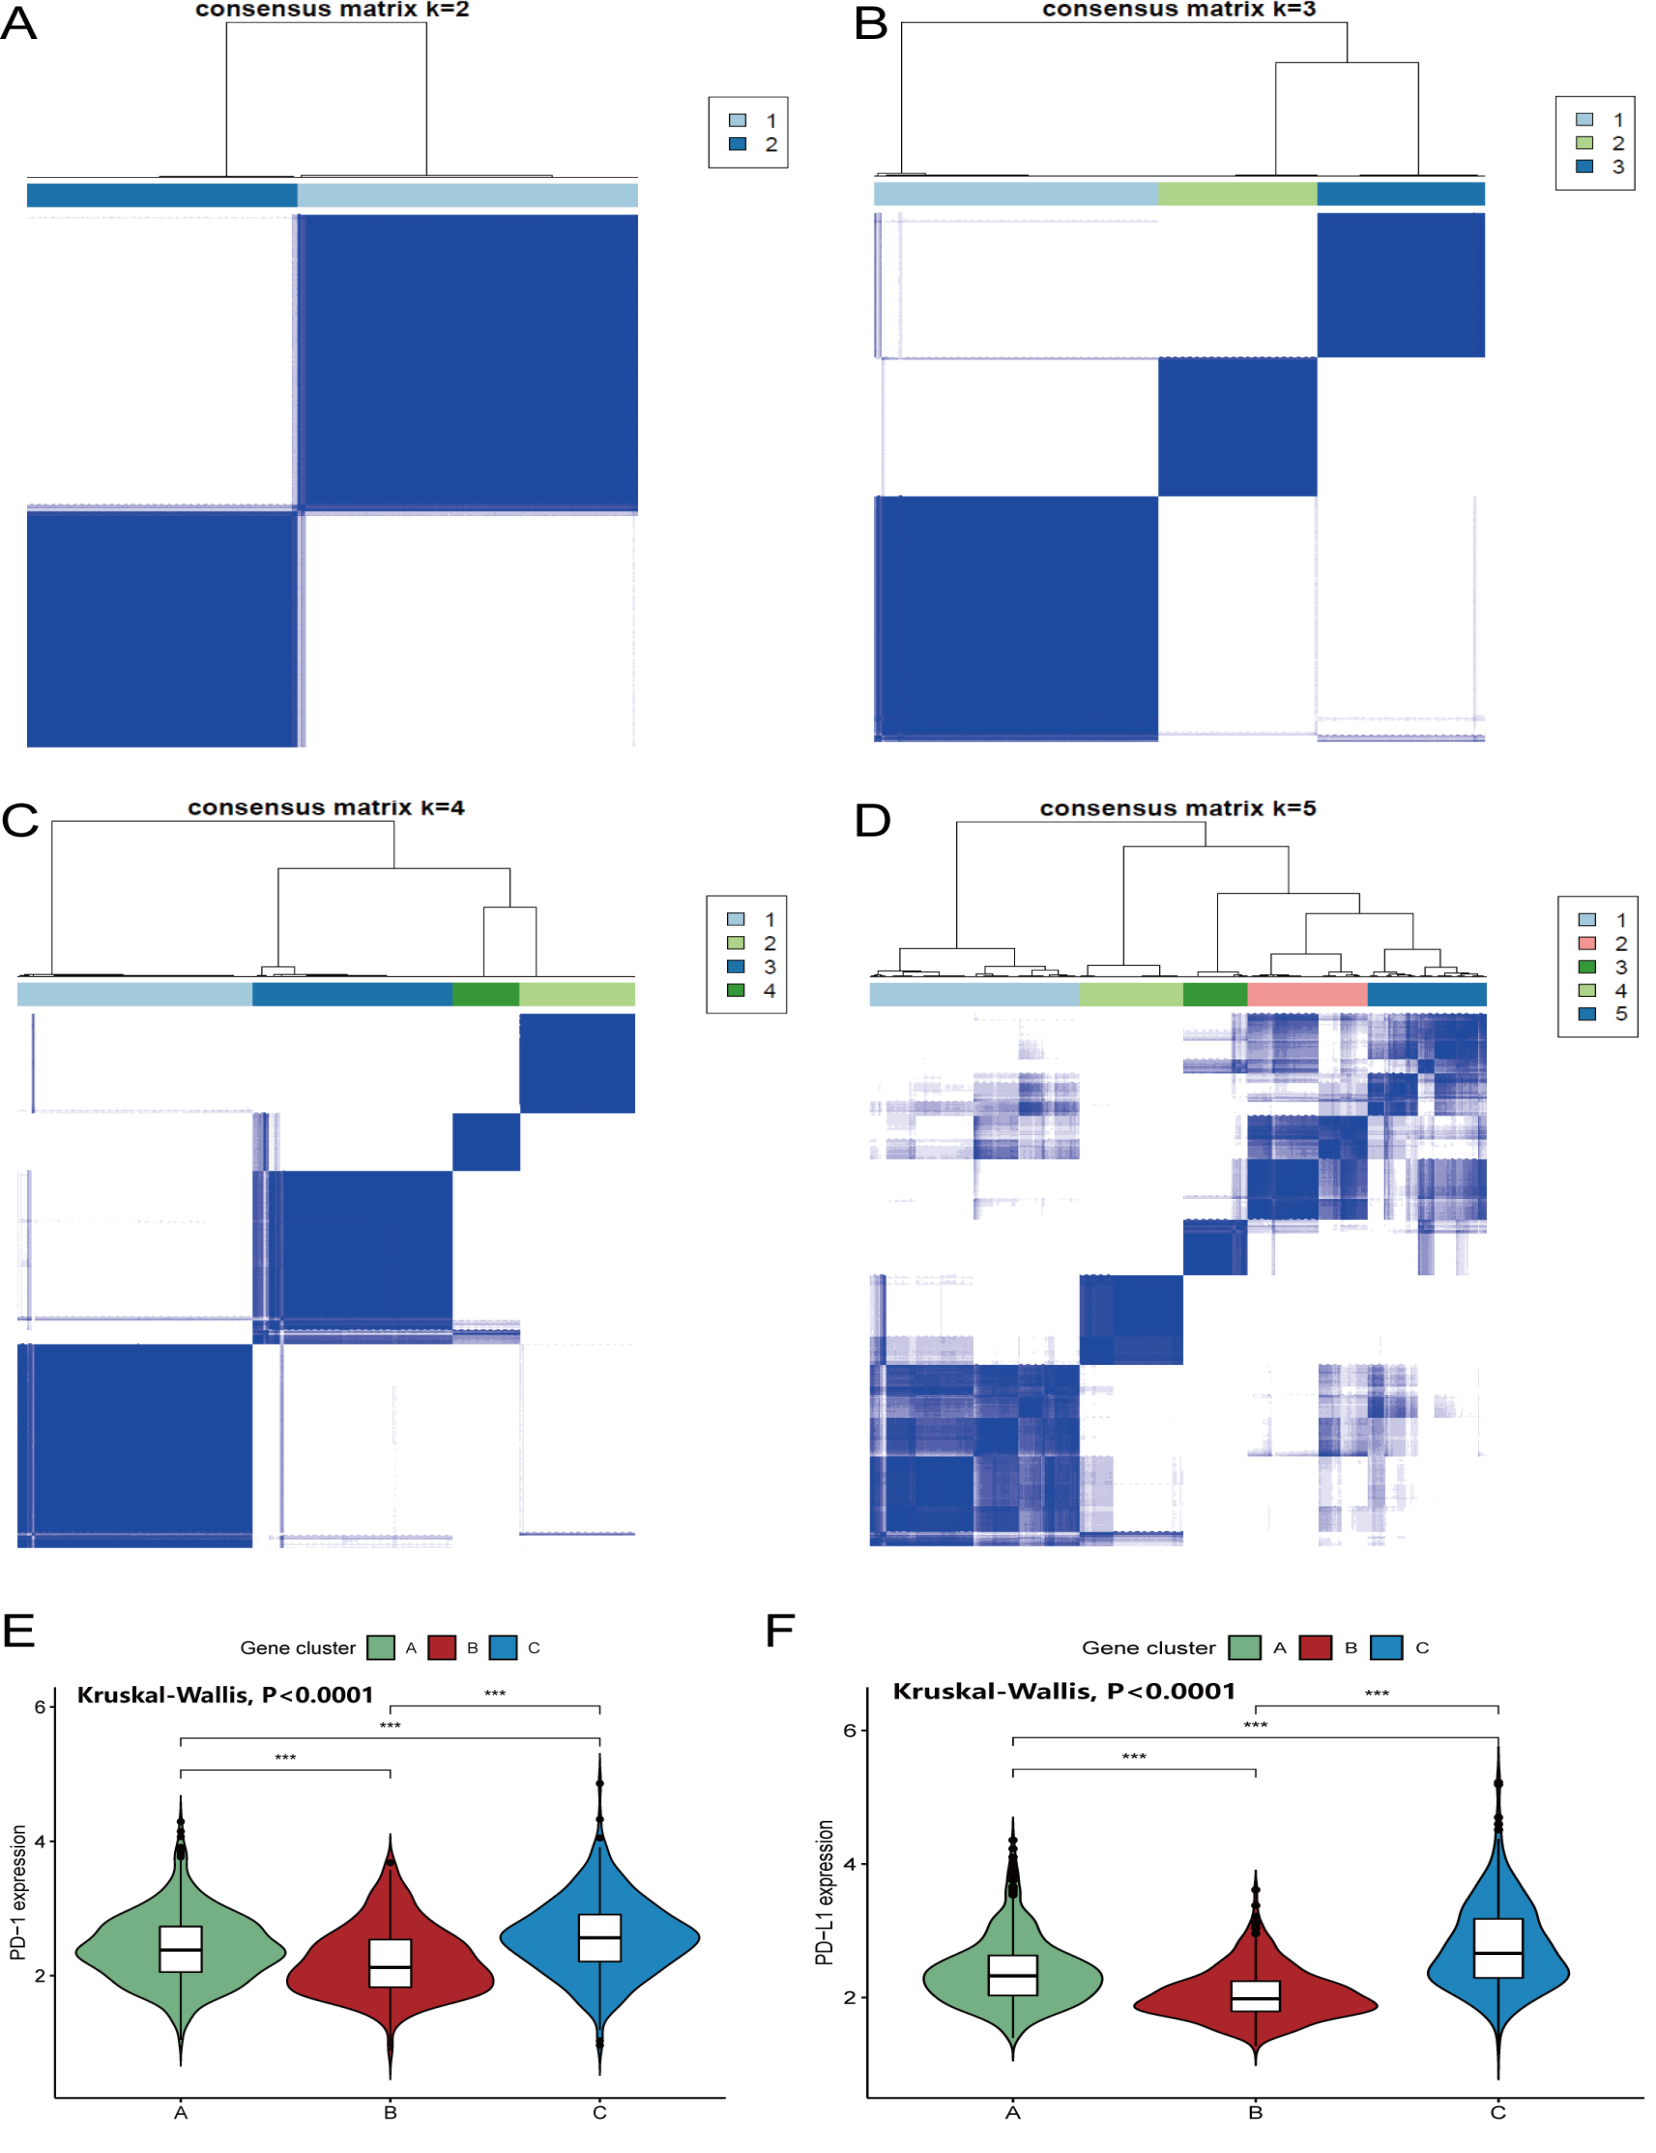
To further identified the potential biological behavior and expression perturbation among distinct TIIC-related phenotypes, the “limma” package (30) was applied to determine transcriptional expression change across three TIIC patterns in CRC. A total of 644 differentially expressed genes (DEGs) that reflected pivotal distinguishing values among these TIIC subtypes were defined as TIIC-related signatures and visualized in Venn diagram (Table S4, Fig. 2A). We next performed unsupervised clustering analyses based on previously obtained 644 TIIC-related genes acquired different genomic phenotypes. Consistent with the stratification of TIIC phenotypes, unsupervised clustering algorithm divided patients into three distinct TIIC genomic clusters with different clinicopathologic features and we named these clusters as gene cluster A-C, respectively (Fig. 2B, Figure S2A-D). A total of 636 gene signatures were termed as the TIIC gene signature A which was positively associated with the gene cluster and the 8 remaining gene signatures that were negatively correlated with the gene cluster were named as TIIC gene signature B (Table S5). Next, we employed Boruta algorithm to perform dimension reduction in the TIIC gene cluster A/B for decreasing noise or redundant genes (21).
GO enrichment analysis revealed the significantly enriched in cellular component (CC), molecular function (MF) and biological process (BP) of DEGs and were summarized in Fig. 3C and Table S6. We further explore the survival analysis by using Kaplan-Meier plotter. The analysis demonstrated significant survival discrepancies among three TIIC gene clusters (the log-rank test, P = 0.0002, Fig. 2D). Three hundred and seventeen patients with colorectal cancer were clustered in gene cluster B, correlated with a better prognosis. While patients with colorectal cancer in TIIC gene cluster C (331 patients) were associated with worse survival outcomes. Intermediate survival prognosis was showed in TIIC gene cluster which included 565 patients. The expression levels of 22 immune cells infiltration among three gene signature subtypes were compared and shown in Fig. 2E. We observed plasma cell, activated DCs and Mast cells was significantly increased in gene cluster B, which can be defined as the active immune phenotypes (31). In contrast, the immune exhausted phenotype was characterized by the enrichment of anti-inflammatory M2 macrophage, decreased DC infiltration and escalated stromal component infiltration (13), which also reflect in gene cluster C. In addition, the expression levels of PD1/L1 among three genomic phenotypes shown significant differences by using the Kruskal-Wallis test (P < 0.001). Intriguingly, TIIC gene cluster C was significant up-regulation in both PD-1 and PD-L1 expression levels, whereas TIIC gene cluster B was characterized by the lowest PD1/L1 expression levels (Figure S2 E-F).
Construction of the TIIC Score and Exploration of its Clinical Relevance
Due to we only focused on the role of TIIC pattern in TME immune infiltration level and survival analysis which based on the patients’ clinical characteristics, these findings could not accurately predict the pattern of TIIC mechanism in individual patients. Therefore, we constructed a scoring scheme, which was developed by the principal-component analysis (PCA) algorithm, to further quantify the TIIC pattern of individual patients with Colorectal Cancer. We termed the scoring scheme as TIIC score. Finally, the 1213 patients in meta-cohort were stratified into high TIIC score and low score groups by using the cutoff value acquired by “survminer” packages of R. For intuitively presented of the attribute changes of individual samples, we visualized the workflow of TIIC score construction with the alluvial diagram (Fig. 3A). The Kruskal-Wallis test was used to explore the difference in TIIC score between TIIC gene clusters. The results showed the score level of the TIIC gene cluster B was significantly increased with greatest prognosis, whereas gene cluster C had the lowest score level with worst prognosis (Fig. 3B). To investigate the stromal-related cytokine and chemokine selected from published research, we focused on the transcripts of COL4A1, CLDN3, ACTA2, TGFBR2, TWIST1, SMAD9, VIM, which was associated with the TGF-b/EMT pathway (32). We were able to observe the most mRNAs relevant to TGF-b/EMT pathway, including COLA41, ACTA2, TGFBR2, TWIST1, VIM, were significantly overexpressed in the low TIIC score group (Fig. 3C). Gene set variation analysis (GSVA) revealed that stromal and carcinogenic activation pathways related to signaling pathways, such as TGF-β, WNT, ECM receptor interaction and VEGF signaling pathways, were significantly enriched in the low TIIC score group. Oppositely, the T cell receptor, NK cell-mediated cytotoxicity signaling pathways were enriched in the high TIIC score group (Fig. 3D). In order to further explore the differentiation between TIIC score subtypes and TME feature, Fig. 3E showed that the high TIIC score group had significantly higher infiltration of immune cells, including CD8 T cell, activated CD4 memory T cell, activated DCs, activated plasma cell, whereas, M2 macrophages with higher infiltration in low TIIC score group.
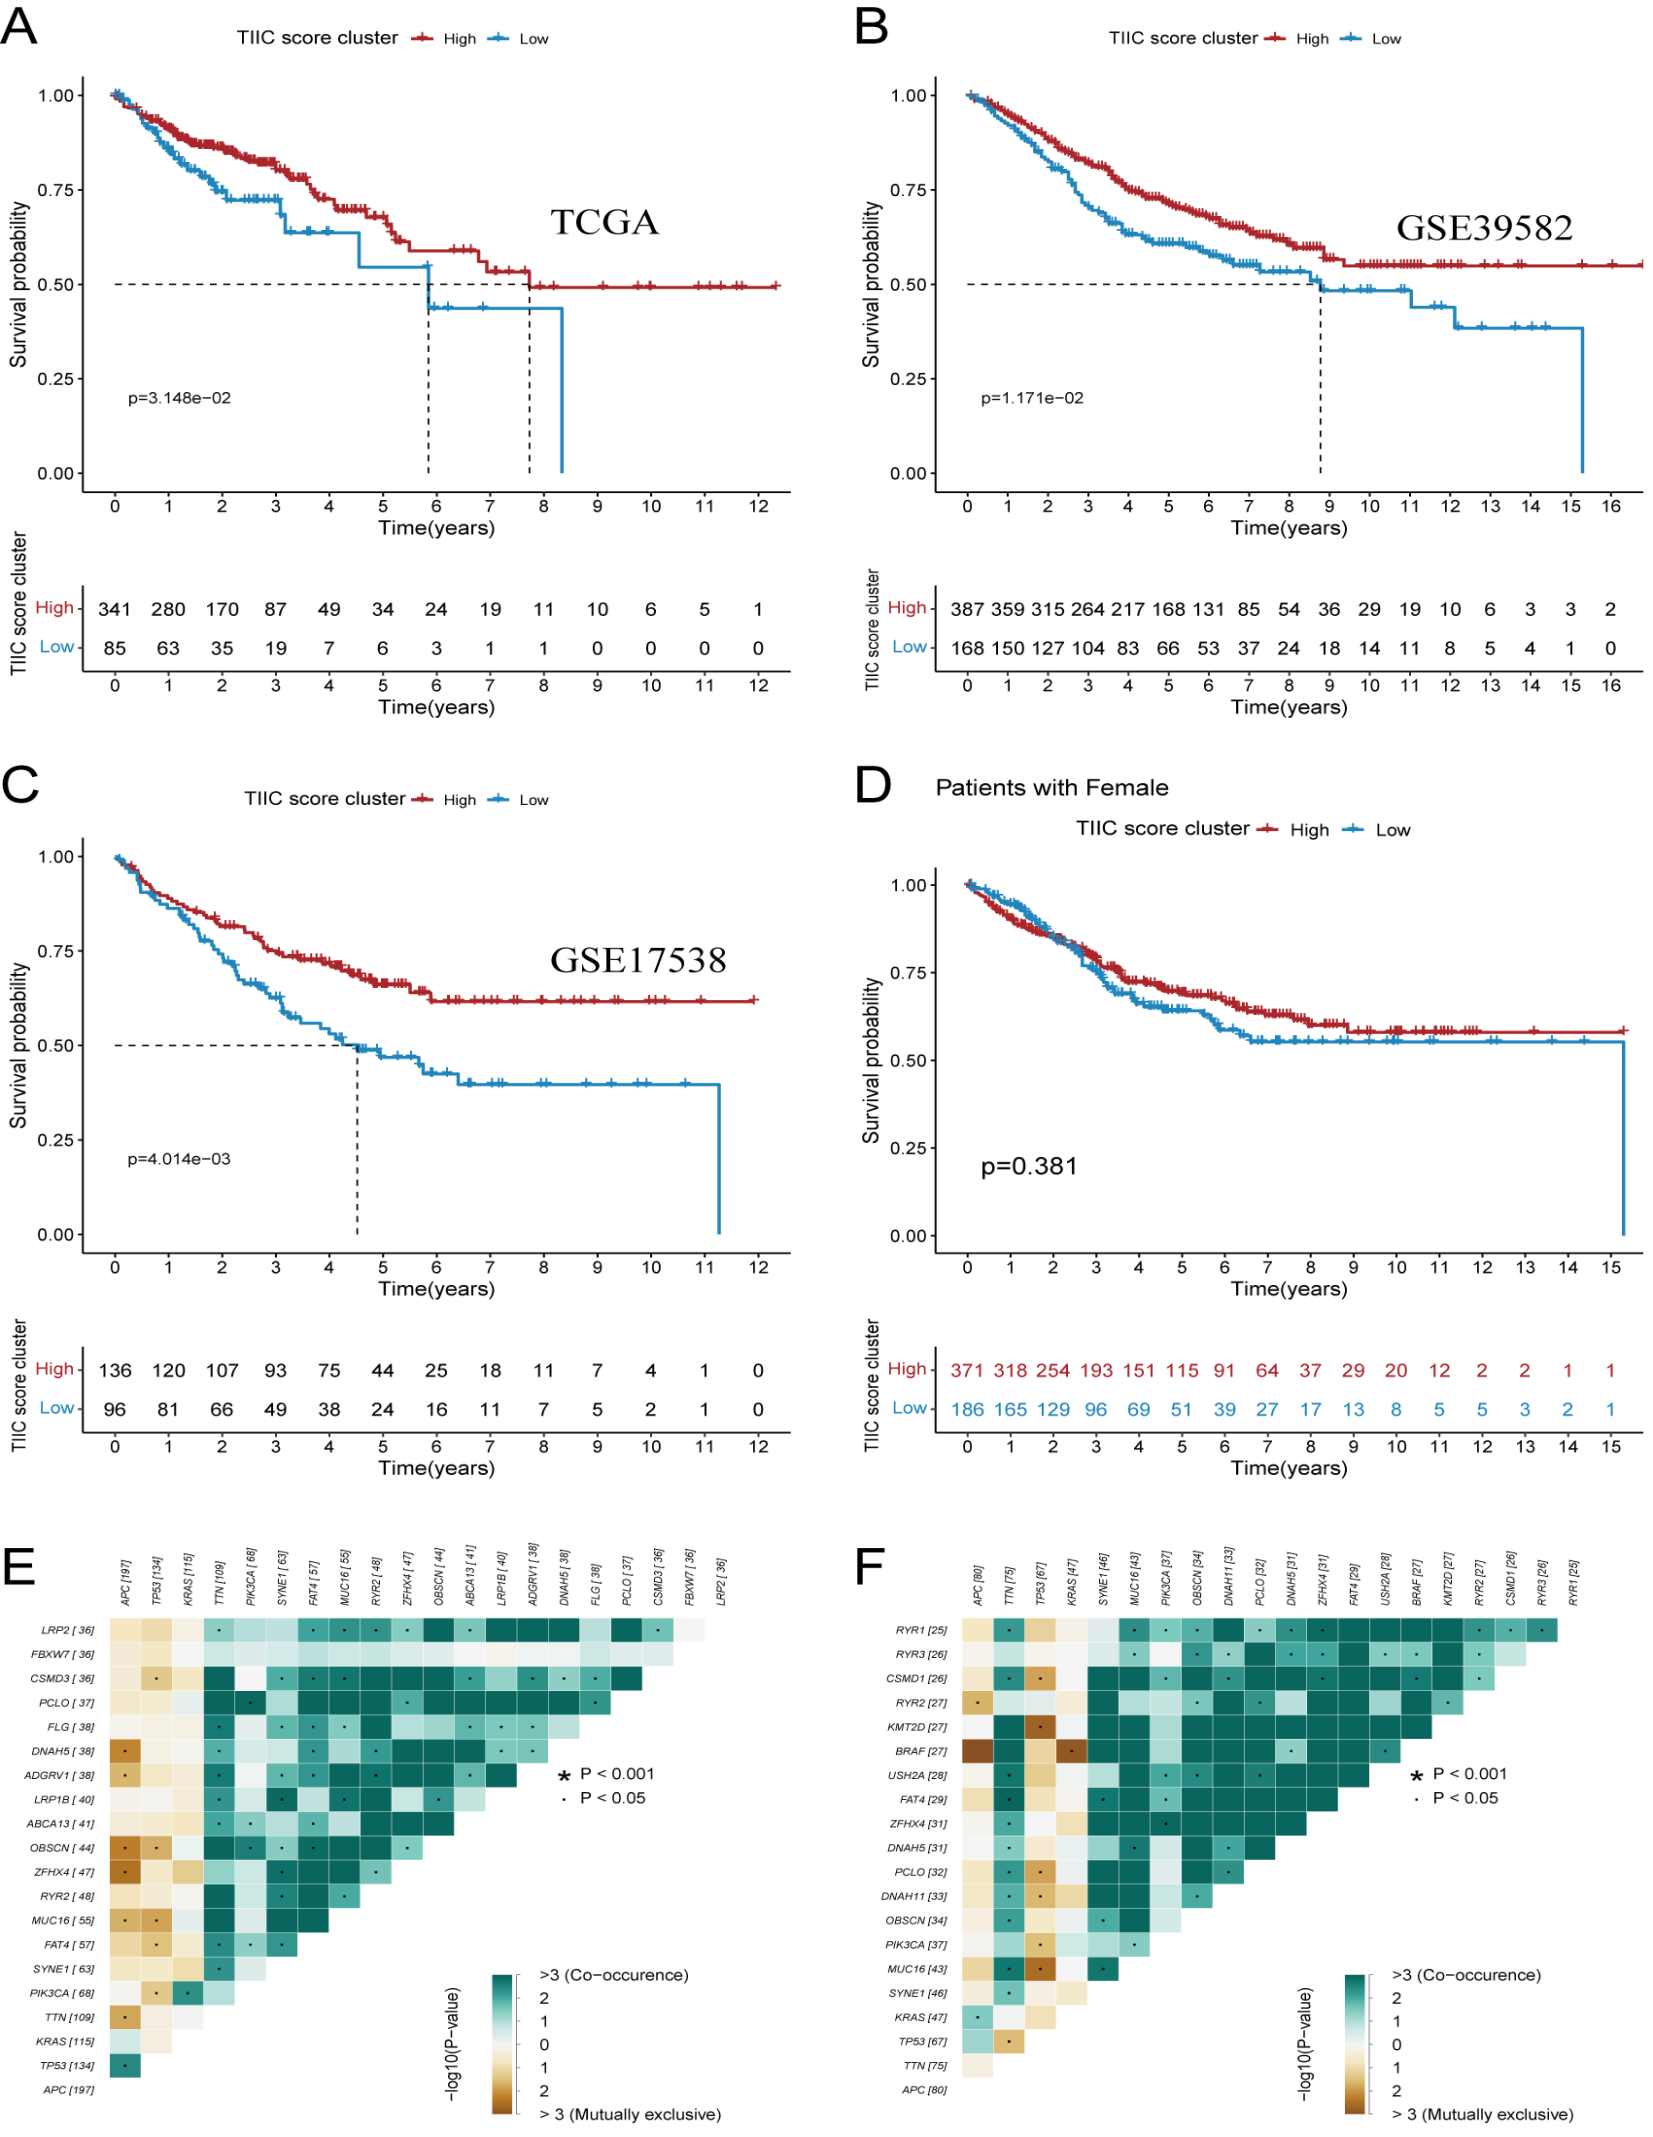
In the next step, we attempted to validate the potential potency of TIIC score in predicting the prognosis of CRC patients. Then, we divided the patients into high or low TIIC score groups with the optimal cut-off value of − 6.22 by “survminer” package. The assessment was performed by using Kaplan-Meier plotter, and patients with high TIIC score were significantly associated with a better prognosis compared with low TIIC score (log-rank test, p < 0.001, 5-years survival probability, 29.3% vs 25.6%, survival rate: 73% vs 63% Fig. 3F-G). As showcased in Fig. 3H, higher TIIC score was significantly exhibited in alive group compared to dead group (Wilcoxon test, p = 0.014). To verify the prognostic efficiency of our findings, we validated the above results using TCGA-COAD cohort (n = 426, log-rank test, p = 0.031, Figure S3 A), GenBank: GSE39582(n = 555, log-rank test p = 0.011, Figure S3 B) and GenBank: GSE17538 (n = 232, log-rank test, p < 0.001, Figure S3 C). Apart from that, we found patients with high TIIC score in male cohort showed significant differences in survival (n = 656, log-rank test p < 0.001, Fig. 4A) but not been characterized in the female cohort (n = 557, log-rank test p = 0.381, Figure S3 D). We next adopted chi-square test to evaluate the correlation between the TIIC score subtypes and clinicopathological factors. The results indicated the CRC patients in high TIIC score group exhibited more alive status and early pathological stage than those in low TIIC score group (chi-square test, alive status: p = 0.0006, pathological stage: p = 0.019, Fig. 4B).
Several studies have indicated high tumor mutation burden status was positively correlated to the response of anti-PD1/L1 and CD8 + T cell infiltration in tumor microenvironment (33). We first compared the survival outcomes between different TMB subgroups and the results show that a better 5-year overall survival was among samples with higher TMB level (11.9% vs 9.6%, log-rank test: 0.03, Fig. 4C). In order to further explore whether TMB status affects the accuracy of the TIIC score to predict survival outcome and whether there is a synergistic action between TMB and TIIC score, we analyzed the survival outcomes of high/low TIIC score subgroup in distinct TMB status subgroup. As demonstrated in Fig. 4D, we found that H-TMB & H-TIIC score showed the best OS than others (5-year survival rates: 13.9 p = 0.045). Taken together, the results demonstrated a synergistic action and positive relationship in predicting survival outcomes. We next assessed the distributions of somatic alterations in different TIIC score groups among CRC and the results were visualized using the maftools. By investigating the mutation annotation files of the TCGA-COAD cohort, we identified APC, TTN, TP53, KRAS, SYNE1, PIK3CA, MUC16, FAT4, ZFHX4, RYR2, OBSCN, DNAH5, PCLO, LRP18, DNAH11, ABCA13, FBXW7, LRP2, MUC4, CSMD3 were top 20 driver gene and significantly mutated gene analysis (SMG) revealed that APC (81.22% vs. 66.32%) had higher somatic mutation rates in high TIIC score group, whereas, TTN had higher mutation somatic mutation rates in low TIIC score group (Fisher’s exact test, APC: p = 0.0017, TTN: p = 0.033, Fig. 4E-F, Table S7). The universal landscape of top 20 driver gene interaction in both high/low TIIC score group was displayed through the correlation coefficient heatmap (Figure S3E-F).
Identification of Potential Chemotherapy drugs and Drug Compounds
Four chemotherapy drugs, including Gefitinib (Fig. 5A), BIBW2992 (Fig. 5B), Sorafenib (Fig. 5C), Methotrexate (Fig. 5D), were selected for analysis of the difference in the estimated IC50 levels. Our results indicated that the estimated IC50 levels of Gefitinib (p = 5.27e-37), BIBW2992 (p = 4.00e-60), Sorafenib (p = 6.83e-18), Methotrexate (p = 2.59e-10) are significantly higher in low TIIC score group. As demonstrated in Fig. 5E, the Spearman correlation analysis between TIIC score and AUC value was estimated to select drug compounds with a negative correlation coefficient. The next analysis yielded 7 CTRP-derived drug compounds (including BRD − K97651142, brefeldin A, daporinad, KX2 − 391, oligomycin A, panobinostat, SR − II − 138A) and 6 PRISM-derived compounds (including clobetasol − propionate, deflazacort, flumethasone, I − BET151, ingenol − mebutate, JQ1− (+)). All of the above drug compounds exhibited a lower estimated AUC value in high TIIC score group and negative correlation with TIIC score (Fig. 5E-F).
The Role of TIIC Score on Response to Anti-PD-1 Immunotherapy
Immune checkpoint blocking therapy represented by anti-PD-1/-L1/-CTLA4 has shown undoubtedly outcome in systemic antitumor therapy. Thus, we further examined whether the TIIC scores could conjecture the efficacy of therapeutic benefit in patients in two independent immunotherapy cohorts. First, the patients who received anti-PD-1 immunotherapy in GSE78220 and Riaz et al. study (28) cohort were segregated into two high and low TIIC score subtypes. As can be seen, patients with a high TIIC score group distinctly exhibited significantly prolonged survival and clinical benefit (log rank test, p = 0.042). The same results were visible in Riaz et al. Study cohort (log-rank test, p = 0.009, Fig. 6A and C). The significant therapeutic benefits and objective response rate of anti-PD-1 treatment were higher in the high TIIC score subgroup compared to those with low TIIC scores (response rate of GSE78220 cohort: 85% vs 35%, response rate of Riaz et al. Study cohort: 40% vs 15%, Fig. 6B and D). These outcomes indicated that TIIC score can be associated with the response to immunotherapy and used as predictors of clinical outcome.