Active ingredients and targets of RRP in the treatment of osteoporosis
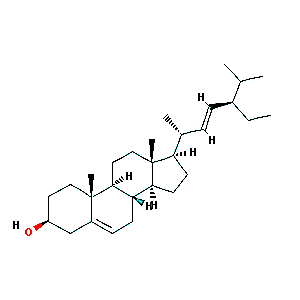
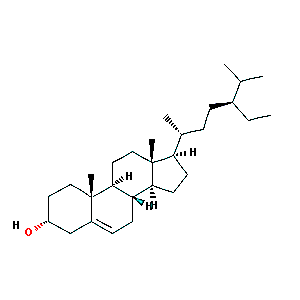
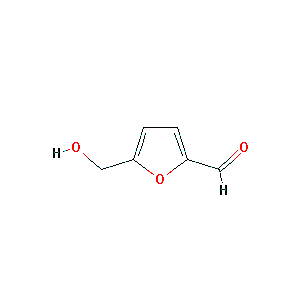
A total of 76 active ingredients of RRP were searched, and 2 active ingredients were screened based on oral bioavailability (OB)>30% and drug-likeness (DL)>0.18, including β-sitosterol (MOL000359) and stigmasterol (MOL000449). It was reported in the literature that 5-HMF could promote osteoblast production and might be one of the components of RRP in the treatment of osteoporosis. Therefore, although the DL value of 5-HMF (MOL000748) did not meet the standard, it was also included as an active ingredient (Table 1). We searched three online Platforms with the keyword “Osteoporosis” and identified 1179 osteoporosis-related targets. And we also obtained 428 RRP targets after removing duplicates. Finally, we found that there were a total of 118 overlapping targets for RRP and osteoporosis.
Table 1 Active ingredients of RRP
|
Molecule ID
|
Molecule Name
|
Structure
|
OB (%)
|
DL
|
|
MOL000449
|
stigmasterol
|
|
43.83
|
0.76
|
|
MOL000359
|
sitosterol
|
|
36.91
|
0.75
|
|
MOL000748
|
5-HMF
|
|
45.07
|
0.02
|
Note: RRP: Rehmanniae Radix Preparata; OB: oral bioavailability; DL: drug-likeness.
Network construction and analysis
After the overlapping targets were uploaded to STRING (at 70% confidence), the PPI network with 98 nodes and 378 edges was constructed using Cytoscape 3.7.2 software (Fig. 2). In the generated network, nodes represented targets, and edges represented the interaction between targets. We used the Cytohub plug-in to analyze the network topology properties. The degree value of node reflected the importance of the node in the network. In the PPI network, the node color changed from yellow to green reflected the degree value changed from low to high. The top 10 genes were MAPK1, MAPK3, AKT1, MAPK8, ESR1, PTG stigmasterol, EGFR, FGF2, SRC, MMP9. Their degree values were more than two fold of the median degree of all nodes in the network [23].
The MCODE plug-in was used to decompose the PPI network, and seven closely connected sub-modules in the network were identified, including two 16-cores (the connectivity of each node in the module is at least 16), one 7-cores, one 6-cores, two 4-cores and one 3-cores (Fig. 3). This sub-module reflected the closely related proteins interaction that completed specific molecular functions. The genes in these sub-modules were closely related to the following molecular functions: enzyme binding, phosphotransferase activity, signaling receptor binding, protein kinase binding, protein tyrosine kinase activity, ion binding, steroid hormone receptor activity, phosphatidylinositol-4,5-bisphosphate 3-kinase activity, heme binding, G protein-coupled receptor activity. And these genes were involved in many important biological processes related to osteoporosis, such as regulation of cell population proliferation, positive regulation of nitrogen compound metabolic process, activation of protein kinase activity, positive regulation of reactive oxygen species metabolic process, regulation of phosphorylation, steroid metabolic process, vitamin D metabolic process, bone development, regulation of protein binding and G protein-coupled receptor signaling pathway.
Enrichment analysis of key targets
In the results of the enrichment of KEGG pathways, the pathways of basic biological processes were screened with false discovery rate (FDR) less than 0.01, and an enriched cluster containing 162 pathways was obtained (enrichment score = 2.12). According to the FDR value of these pathways, 10 pathways related to osteoporosis were screened out, including Estrogen signaling pathway, HIF-1 signaling pathway, VEGF signaling pathway, TNF signaling pathway, Ras signaling pathway, FoxO signaling pathway, MAPK signaling pathway, PI3K-Akt signaling pathway, Osteoclast differentiation and Inflammatory mediator regulation of TRP channels (Table 2). Then we classified and visualized the pathways based on the number of key genes in these pathways (Fig. 4). The classification of these pathways belongs to endocrine system, signal transduction, development and regeneration and sensory system, which were the key target pathways of RRP to interfere with the biological process of osteoporosis.
Table 2 KEGG signaling pathways regulated by important targets
|
Category
|
Pathway
|
Number of genes
|
Mapped targets
|
FDR
|
|
Endocrine system
|
Estrogen signaling pathway
|
99
|
12
|
8.91×10⁻⁷
|
|
Signal transduction
|
HIF-1 signaling pathway
|
96
|
10
|
4.82×10⁻⁵
|
|
Signal transduction
|
VEGF signaling pathway signaling pathway
|
61
|
8
|
1.33×10⁻⁴
|
|
Signal transduction
|
TNF signaling pathway
|
107
|
9
|
4.21×10⁻⁴
|
|
Signal transduction
|
Ras signaling pathway
|
226
|
12
|
5.69×10⁻⁴
|
|
Signal transduction
|
FoxO signaling pathway
|
134
|
9
|
0.001
|
|
Signal transduction
|
MAPK signaling pathway
|
253
|
12
|
0.001
|
|
Signal transduction
|
PI3K-Akt signaling pathway
|
345
|
14
|
0.001
|
|
Development and regeneration
|
Osteoclast differentiation
|
131
|
8
|
0.004
|
|
Sensory system
|
Inflammatory mediator regulation of TRP channels
|
98
|
7
|
0.004
|
Note: KEGG: Kyoto Encyclopedia of Genes and Genomes; FDR: False discovery rate.
Verification of molecular docking
Molecular docking could effectively predict whether the ligand and the receptor could interact with each other through the complementarity of the spatial structure and the principle of energy minimization in the region of the receptor active site [24,25]. The lower the docking score between the ligand and the receptor, the greater the docking activity of the two and the more stable the structure. The molecular docking results showed that the molecular docking score between the active ingredients of RRP and the key targets was all less than -4.2 kcal/mol, suggesting that these active ingredients have a certain affinity and binding activity with the key targets (Table 3). Docking score of the ligand and the receptor was less than -7.0 kcal/mol, which indicated that they had strong binding activity. A total of 14 binding conformations have docking scores less than -7.0. The top 9 binding relationships with the highest docking activity are AKT1-stigmasterol, AKT1-sitosterol, MAPK1-stigmasterol, MAPK1-sitosterol, ESR1-stigmasterol, SRC-stigmasterol, MMP9-stigmasterol, ESR1-sitosterol, MMP9-sitosterol (Fig. 5).
Table 3 Docking score of the active ingredients of RRP and key targets
|
Molecule name
|
PDB ID
|
Docking score(kcal/mol)
|
|
stigmasterol
|
sitosterol
|
5-HMF
|
|
MAPK1
|
4s33
|
-9.7
|
-9.5
|
-4.3
|
|
MAPK3
|
6ges
|
-5.3
|
-5.0
|
-4.2
|
|
AKT1
|
6hhf
|
-10.3
|
-10
|
-4.7
|
|
MAPK8
|
3pze
|
-8.2
|
-8.3
|
-4.4
|
|
ESR1
|
2iok
|
-9.6
|
-8.7
|
-4.3
|
|
PTGS2
|
4cox
|
-7.9
|
-8.1
|
-5.0
|
|
EGFR
|
5y9t
|
-6.3
|
-5.9
|
-3.8
|
|
FGF2
|
4fgf
|
-5.0
|
-4.6
|
-3.2
|
|
SRC
|
4u5j
|
-9.1
|
-8.0
|
-4.3
|
|
MMP9
|
6esm
|
-8.9
|
-8.6
|
-5.6
|
Bone densitometry results
Compared with the sham operation group, the femur and vertebral bone mineral density of the model group were significantly decreased (P <0.01). Compared with the model control group, the RRP group could significantly increase the bone mineral density of the femur of ovariectomized rats (P <0.01), and could significantly increase the bone density of the vertebral body (P <0.05), as shown in Fig. 6-7.
Effect on AKT1, ESR1and SRC-1 mRNA expression
The relative quantitative expression levels of AKT1, ESR1and SRC mRNA were calculated by the 2-ΔΔCT method. The results showed that compared with the sham operation group, the expression levels of AKT1, ESR1and SRC mRNA in the bone tissue of the model group decreased significantly (P<0.05). Compared with the model group, the expression of AKT1, ESR1and SRC mRNA in the bone tissue of the RRP group increased significantly (P<0.05). The results showed that RRP could increase the expression levels of AKT1, ESR1and SRC mRNA in the bone tissue of osteoporotic rats (Fig. 8).