Analysis of reduced graphene oxide
AFM images of reduced graphene oxide were shown in Fig. 1A, it can be seen that GO and rGO were sheet-like structures with overlap and their dimensions reached the nanometer level. The Height of rGO was about 1.34 nm, as measured from the height profiles, which was consistented with the research by the reference (Fernández-Merino et al. 2010). The UV spectra of graphene oxide and reduced graphene oxide were shown in Fig. 1B. The intensities of the UV visible absorption peaks were concentrated at 230–280 nm, and the absorption peak of GO was shifted from 233 nm to 266 nm, indicating the graphene oxide was reduced and the aromatic structure was restored (Fernández-Merino et al. 2010).
The XRD patterns of graphene oxide and reduced graphene oxide were shown in Fig. 1C. Meanwhile, the characteristic diffraction peak of GO appeared at 2 = 10.8°. There was a broad peak at 2 = 23.5° for rGO, which was new of diffraction peaks (Marcano et al. 2010). The XPS spectra of graphene oxide and reduced graphene oxide were shown in Fig. 1D and E. The characteristic peaks of rGO were 289.6 eV, 288.0 eV, 285.8 eV, and 284.0 eV, which were corresponded to O = C-O, C = O, C-O, and C-C/C = C bonds, respectively (Akhavan 2010; Ganguly et al. 2011). Compared with GO ofin the oxygen-containing functional group peaks,the intensity of the characteristic peaks of rGO were all decreased. From the XPS analysis, the oxygen element content fraction of GO was 28.2%, and that of rGO was 16.12 %. The combined analysis of the results of AFM, UV-vis, XRD, and XPS fully demonstrated the successful preparation of reduced graphene oxide dispersions to be used the ascorbic acid reduction graphene oxide method. As shown in Fig. 1F, the color of graphene oxide dispersion (0.1 mg/mL) was changed after the reaction from light yellow to black. These results showed that reduced graphene oxide was prepared successfully.
Chemical structures of the composite films
The FTIR spectra of the QH, CS, and rGO were shown in Fig. 2A. In the rGO spectrum, the characteristic peaks at 1748 and 1067 cm− 1 were attributed to the stretching vibrations of the C = O and C-O bonds, respectively (Emiru and Ayele 2017). In the CS spectrum, the absorption peaks at 1637 and 1549 cm− 1 were assinged to the amide I band and amino group (-NH2), respectively, and the strong peak at 1406 cm− 1 corresponded to the C-N stretching vibration (Xu et al. 2019). The characteristic peaks of QH were mainly distributed at 3431, 2925, 1625, 1048, and 898 cm− 1 (Rao et al. 2019). The absorption peaks at 3431 and 2925 cm− 1 were the stretching vibrations of -OH and C-H, respectively. The peak at 898 cm− 1 was the absorption peak of β-glycosidic bond. Figure 2B showed the FTIR spectra of the composite films. It can be seen from the figure that the main characteristic peaks of the composite films were distributed at 2909, 1718, 1541, 1244, 1049, and 897 cm− 1. The characteristic peaks of the hydroxyl group in the composite films were shifted from 3431 cm− 1 to 3307 cm− 1, mainly due to the hydroxyl group was decreased in the system. Compared with the FTIR spectra of the pure chitosan, the intensity of absorption peak at 1049 cm− 1 was increased after the reaction, indicating that the hemicellulose was successfully cross-linked with chitosan by the ring-opening reaction of ECH (Guan et al. 2016). There was no new peaks appeared in the spectra of the films with the addition of reduced graphene oxide, proving that physically cross-linked was the mainly reaction among the three components.
The XRD patterns of QH and rGO were shown in Fig. 2C. The peak at 2θ = 23.5° was assigned to rGO. The peak at 2θ = 20.1° was shown in the QH pattern was attributed to the hemicelluloses, indicated that the QH was amorphous (Kacurakova et al. 1998). The XRD patterns of the composite films were presented in Fig. 2D. All composite films exhibited a broad peak at 2θ = 19.9° (Fig. 2D), there was amorphous structure here (Guanet al. 2016). A weak peak at 2θ = 23.1° was attributed to rGO. This result indicated that the reduced graphene oxide became disordered and irregular due to the insertion of polymers such as hemicellulose and chitosan between the reduced graphene oxide lamellae, and it was demonstrated that the reduced graphene oxide was uniformly and stably dispersed in the polymer in the form of lamellae. These results suggested that the rGO sheets were suitably exfoliated in the QH and CS matrix, and the chemicaland amorphous structure of QH and CS were not changed by the incorporation of rGO. The results also indicated that QH and CS are mainly physically cross-linked with rGO but not chemically cross-linked. These findings were consistentwith that of FT-IR.
Morphologies of the composite films
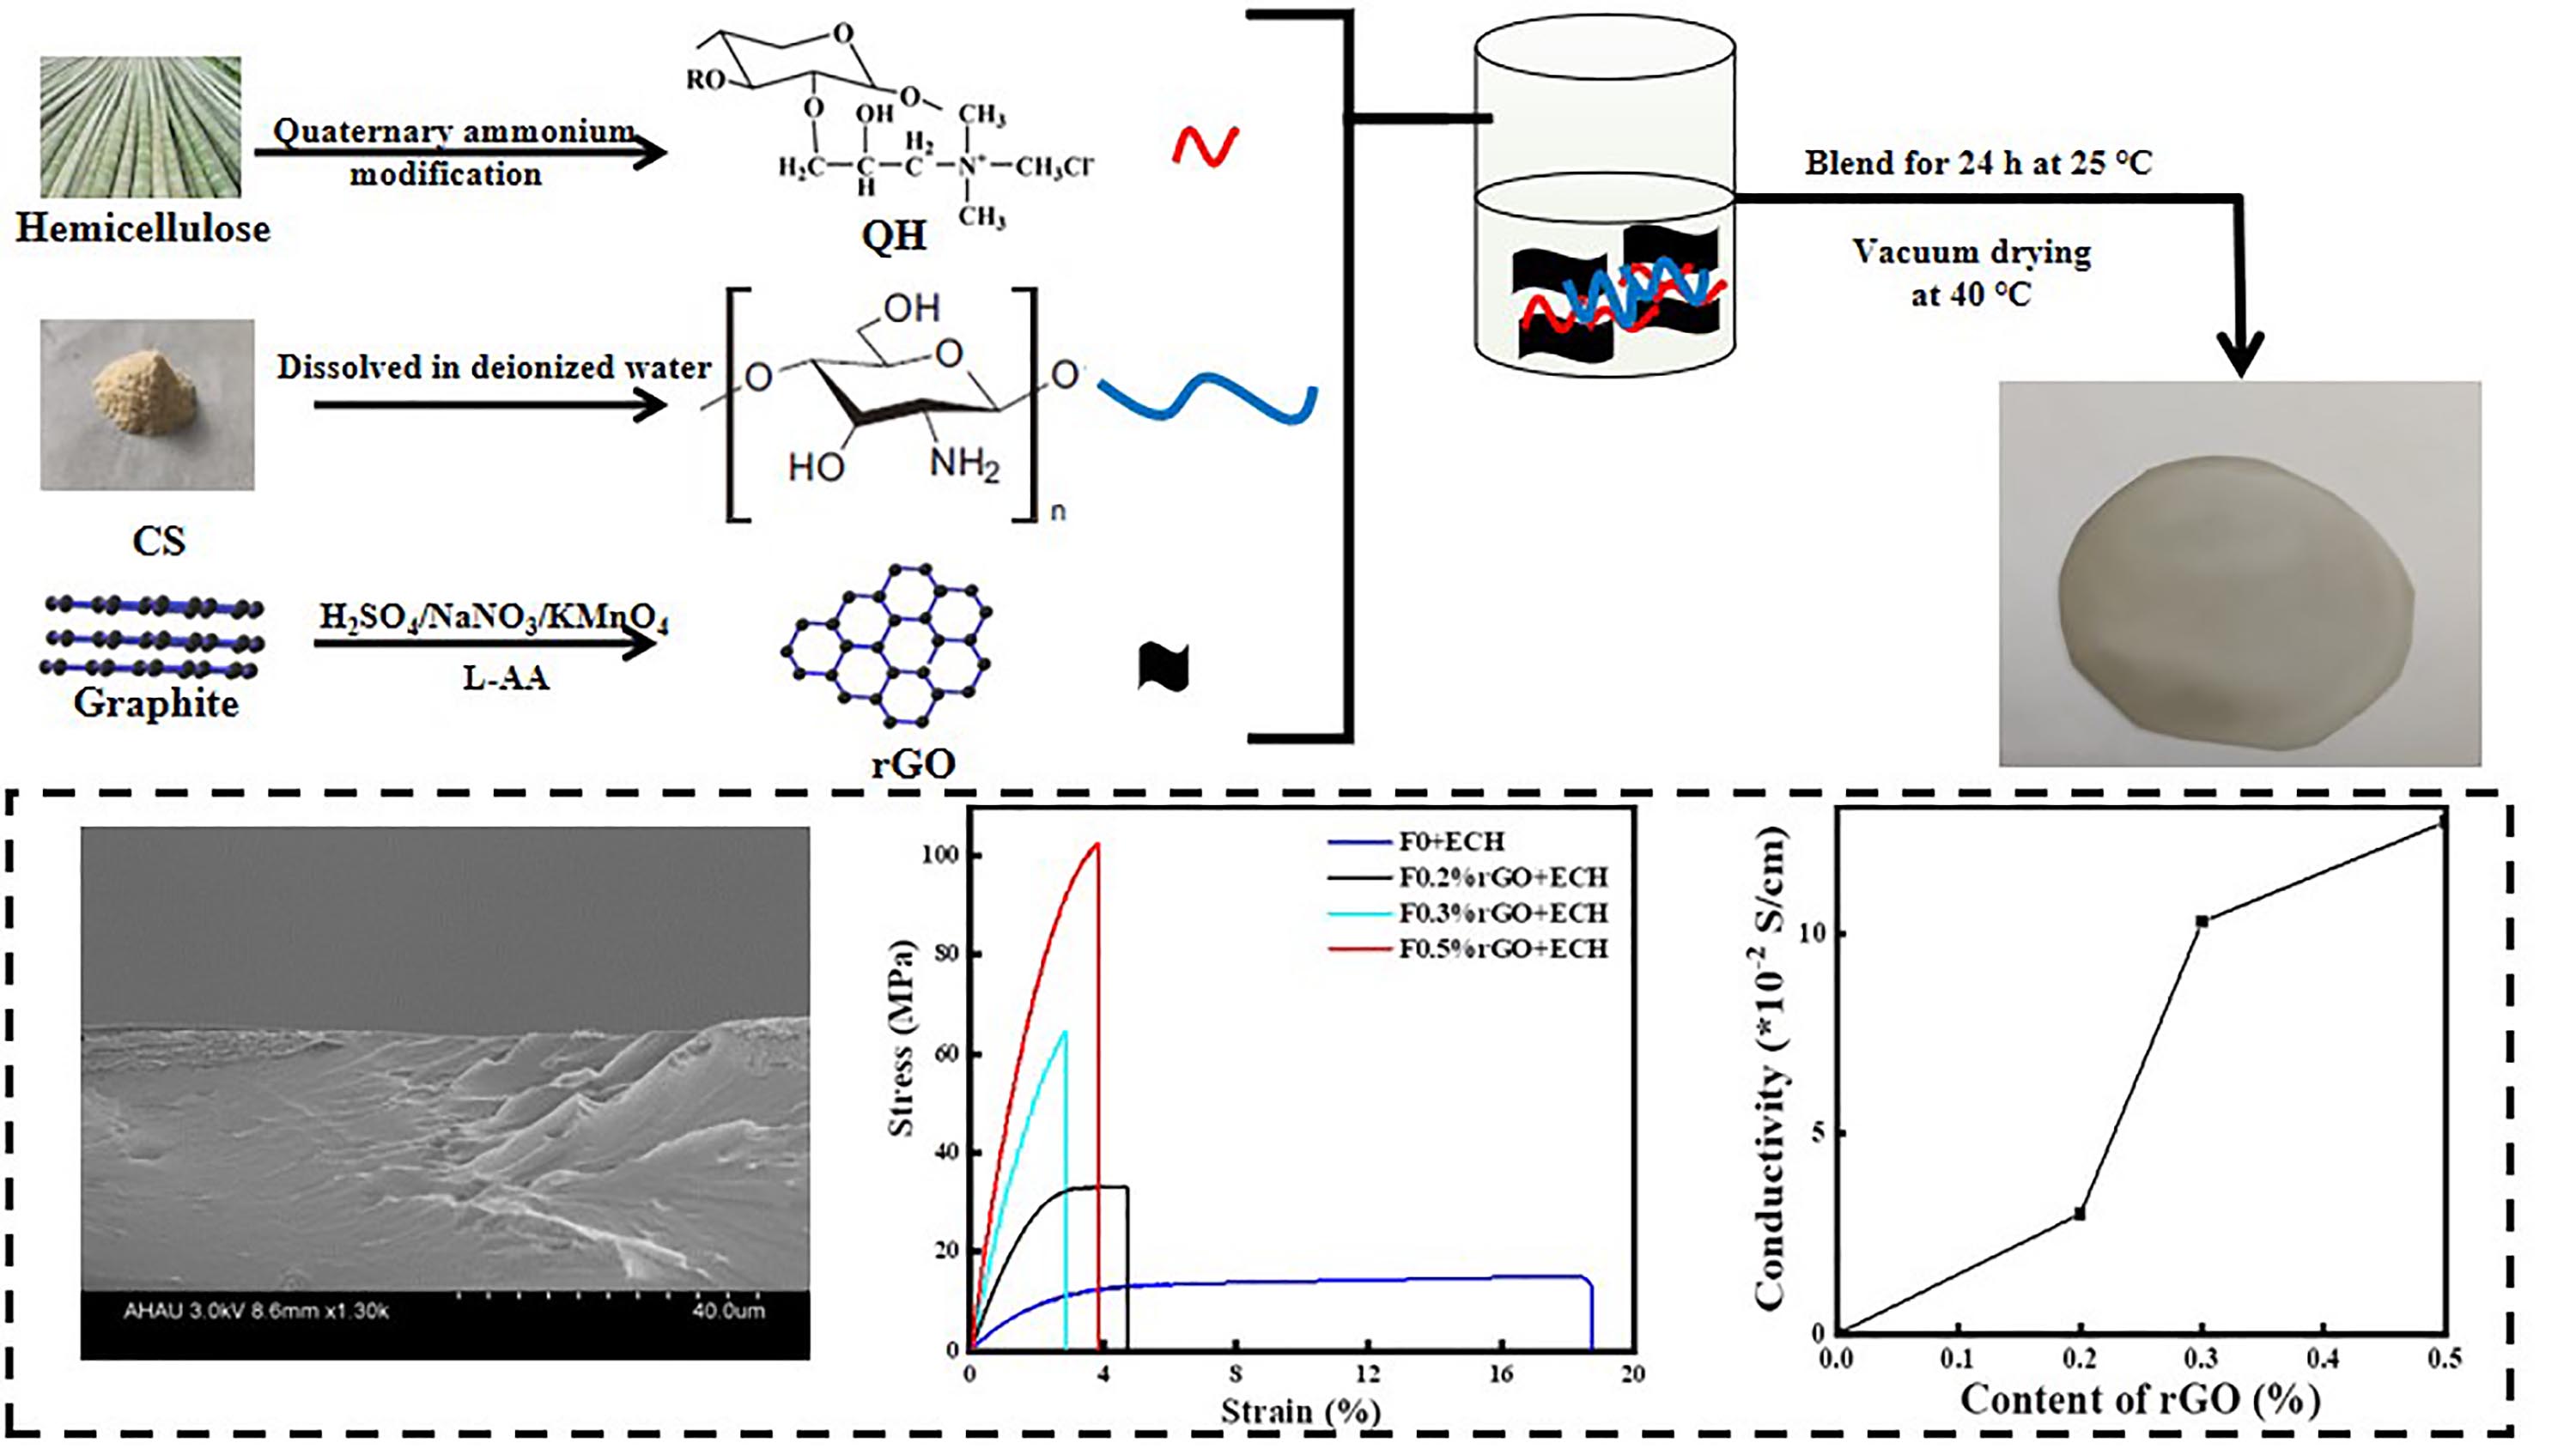
The microscopic morphological changes of the composite film materials before and after the addition of reduced graphene oxide were investigated by SEM. The SEM images of the composite films (Film0 + ECH and Film0.3%rGO+ECH) were shown in Fig. 3. From Fig. 3A and C, the surfaces of the two composite films were flat and smooth. The composite films containing rGO had a clear laminar structure as shown in Fig. 3B and D. The image of the composite films without the addition of reduced graphene oxide was shown without a laminar flow structure. However, the Fig. 3B indicated that a more dense structure by cross-linking was obtained by the modified hemicellulose and chitosan. From Fig. 3D, the composite film obtained by mixed the three substances had a more uniform lamellar structure, which was also extremely important for the mechanical properties and thermal stability of the composite film material.
Thermogravimetric analysis of the composite films
The TG and DTG spectra of the raw materials and the composite films were shown in Fig. 4.The rGO powder is thermally stable and starts to lose functional groups between 200 ℃and 400 ℃, and the major loss occurs at 447.7°C, presumably due to the degradation of carbon rings (De Silva et al. 2018). The maximum rates of decomposition and weight loss of the composite films were obtained at temperatures from 200 ℃ to 600 ℃. Further, the characteristic temperature (Tonset is the temperature at theonset of decomposition, T1 is the maximum weight loss temperatures, and T2 is the lower maximum weightloss temperatures) of the samples were shown in Table 2. The T1 values ofFilm0 + ECH, F0.5%rGO+ECH, F0.2%rGO+ECH, and F0.2%rGO+ECH were obtained at 228.1 ℃, 221.1 ℃, 223.1 ℃, and 222.0 ℃, respectively. Furthermore, the T1 of the composite films was decreased markedly relative to QH. This reduction was attributed to the degradation of oxygen-containing groups of the QH and CS in the low-temperature area. The T2 of the composite films was attributed to the degradation of the CS chain. In addition, the residuals of the composite films were increased with the increase of rGO content, following the orderF0.5%rGO+ECH>F0.3%rGO+ECH>F0.2%rGO+ECH>F0+ECH. Consequently, as the content of rGO increased, the thermal stability of the composite film was increased, which was due to that the rGO sheet exhibited good thermal stability in thehigh-temperature area.
Table 2
Characteristic values and residual mass fraction of raw materials and composite films.
| Sample | Tonset(℃) | T1(℃) | T2(℃) | Residuals (%) at 700℃ |
| QH | 244.3 | 273.6 | - | 17.02 |
| CS | 276.5 | 295.4 | - | 34.91 |
| rGO | 447.7 | 566.9 | - | 67.66 |
| F0 + ECH | 219.4 | 228.1 | 275.0 | 30.86 |
| F0.2%rGO+ECH | 214.3 | 221.1 | 268.5 | 34.49 |
| F0.3%rGO+ECH | 217.0 | 223.8 | 270.4 | 36.51 |
| F0.5%rGO+ECH | 214.8 | 222.0 | 268.0 | 37.07 |
Functional properties of the composite films
The UV-vis spectra of the composite films were shown in Fig. 5A and B. As can be seen from Fig. 5A, Film0 + ECH had the highest transmittance of about 92 %. In the visible light region, the optical transparency of the composite films was the F0 + ECH> F0.2%rGO+ECH> F0.3%rGO+ECH>F0.5%rGO+ECH according to the different raw material contents of the composite films. As shown in the Fig. 5B, the transmittance of the composite film was almost 0% in the region of UV-B and UV-C. At 400 nm, the transmittance of the composite film was lower than 20%, and the lowest of F0.5%rGO+ECH was 6.45%. In contrast, QH/CS/rGO films were observed to have highUV blocking due to the conjugation effect of rGO (Xuet al. 2019). In general, the transmittance of the composite films was related to the content and interaction of the materials. The unique optical performance of the composite films beprovided great potential in highly transparent and UV-blocking materials, such as food packages and protecting fabrics.
The tensile stress-strain curves of the composite films were shown in Fig. 5C. The mechanical data such as tensile stress at break, tensile strain at break, and Young's modulus of the composite films were shown in Table 3. It can be seen that the tensile stress at break of the composite films containing rGO was higher than that of the composite film without rGO. The tensile strengths of the composite films with different ratios were in the range of 10–110 MPa. As can be seen from the table, the minimum tensile strength of F0 + ECH was 14.76 MPa, the elongation at break was 18.53 %, and the Young's modulus was 0.08 GPa. When reduced graphene oxide was added to the composite film system, the mechanical strengths of the composite films were substantially increased. The maximum tensile strengths of the F0.2%rGO+ECH, F0.3%rGO+ECH, and F0.5%rGO+ECH were 36.45 MPa, 64.00 MPa, and 102.09 MPa, respectively. Compared with the composite film F0 + ECH, the tensile stresses of F0.2%rGO+ECH, F0.3%rGO+ECH, and F0.5%rGO+ECH were increased by 196.7 %, 345.4 %, and 550.9 %, respectively. Combining of the FT-IR and XRD results, it was clearly that the oxygen-containing groups of reduced graphene oxide were closely linked to the hydroxyl carboxyl groups on quaternary hemicellulose and chitosan mainly through hydrogen bonding (Marcano et al. 2010). These results demonstrated that the addition of reduced graphene oxide was used as a reinforcing agent in the composite system, and the mechanical properties of the composite film materials were greatly improved.
Table 3
Tensile properties of the composite films.
| Sample | Stress strength (MPa) | Strain at break (%) | Young's modulus (GPa) |
| F0 + ECH | 14.76 ± 1.66 | 18.53 ± 0.81 | 0.08 ± 0.04 |
| F0.2%rGO+ECH | 36.45 ± 0.44 | 2.05 ± 0.11 | 1.78 ± 0.40 |
| F0.3%rGO+ECH | 64.00 ± 0.88 | 2.74 ± 1.21 | 2.34 ± 0.07 |
| F0.5%rGO+ECH | 102.09 ± 1.31 | 3.54 ± 0.53 | 2.88 ± 0.25 |
The conductivity of the composite film was tested by the electrochemical method, and the result was shown in Fig. 5D. It can be seen that the conductivity of QH/CS film was0, that was to say the F0 + ECH was non-conductive, and the conductivity of the film decreased by introducing rGO. The conductivities of the composite films were increased with the increase of rGO addition, when the contents of rGO in the composite film system was 0.5%, the conductivity of the composite film was 12.8 × 10− 2 S/cm. Liu et al. (2014) reported the conductivity of the polyaniline containing 30 wt.% reached 1.9 × 10− 2 S/cm, the composite material was composed of a cellulose matrix and a conductive phase. In comparison with cellulose-based conductive films, the conductivity of our prepared composite film(F0.5%rGO+ECH) is approximately one order of magnitude higher. The quaternized hemicellulose and chitosan chains were interspersed between the sheets, which had some influence on its conductivity. This was mainly due to the uniform dispersion of rGO slices in the composite matrix, which promoted the formation of an effective conductive network and thus made the composite films conductive. The results showed promised in the application of paper-based sensors.