Study design
This was a multicentre, parallel, randomised, superiority, simulation study designed in accordance with the Standard Protocol Items: Recommendations for Interventional Trials (SPIRIT) statement38, the detailed protocol of which was previously published39. It was conducted according to the guidelines of the Declaration of Helsinki. Results are reported according to the Consolidated Standards of Reporting Trials (CONSORT) statement (Supplementary Table S1)40.
Ethics declarations
Review and approval were waived by the regional Ethics Committee (CER-Vaud—Commission Cantonale d’Ethique de la Recherche sur l’Être Humain, Lausanne, Switzerland)—REQ-2020-01491—as such studies do not fall under the Swiss Federal Human Research Act. Written informed consent was obtained from all the participants.
Setting
In Switzerland, paramedics follow a 3-year training curriculum and are trained to treat most prehospital emergencies autonomously. They can administer several Advanced Life-Support (ALS) treatments according to emergency care protocols validated by prehospital medical directors. Emergency Medical Technicians (EMTs) graduate after a 1-year curriculum and are trained to assist paramedics. The ALS teams can either be composed of two paramedics or of a paramedic teaming with an EMT. Even though these aspects are standardized, the Swiss federal system generates considerable inter-cantonal heterogeneity between Emergency Medical Services (EMS). In some regions, EMS operating in the same areas have different treatment protocols as each service has its own medical director who can almost singlehandedly decide upon the extent of delegations. This study was performed in four different EMS where paramedics applied the standard 30:2 approach and did not routinely use the i-gel® in case of OHCA.
Participants and recruitment
All registered paramedics and EMTs actively working in either of these EMS were eligible for inclusion. Study team members and participants who did not attend the training path were excluded. Participants were told that the study was about OHCA management, but were not informed of its specific objectives.
Study sequence
The study sequence is summarized in Figure 1.
Randomization
Randomization was two-tiered. First, to ensure that there would be at least one paramedic per team, an online balanced team generator was used41. Intra-cluster randomization with a 1:1 ratio was then performed using an online randomizer, with each trial center representing a cluster42.
Standardized workshop
The use of the i-gel® device was taught to each team separately by one of the investigators (LSt) in accordance with Peyton’s approach43–45, based on a standard operating procedure (Supplementary Files S2, S3). Twenty minutes were dedicated to this workshop. This took into account the time required to gather the participants’ consent and to allow them to complete a short demographic questionnaire.
Training session of experimental approach
Following the workshop, each team was allowed 20 minutes of self-training supported by a custom-made demonstration video (https://cpr2-intro.swiss-cpr-studies.ch/). During this training session, an experimental approach developed by DT and LSt was practiced. This approach consists in the immediate placement of an i-gel® device by one team member immediately after the first rhythm analysis, without prior BVM ventilation. Meanwhile, the second team member provides continuous chest compressions. Ventilations are given asynchronously at a rate of 10 per minute once the SGA device is in place1,2. After two minutes of continuous chest compressions, 30:2 CPR is provided by one rescuer while the other performs ALS actions.
Study scenario
Another custom-made video, which presented the manikin’s and defibrillator’s characteristics, was displayed to the participants upon entering the study room (https://cpr2-briefing.swiss-cpr-studies.ch/). The scenario was then presented in exactly the same way to all participants regardless of the study site: « This is Michael, a 50-year-old man who suddenly collapsed 10 minutes ago. He is now unconscious, pale, and does not seem to be breathing. Medical reinforcement is already underway and will arrive in about ten minutes. No first responder has been dispatched by the emergency medical call center, and there is no bystander nearby ». Only then could the leader open the opaque, sealed envelope containing the specific airway management strategy the team has to apply. There was no further interaction between participants and the study team until the scenario was stopped. The simulated patient was apneic and in refractory ventricular fibrillation (regardless of the number of defibrillation attempts). The scenario was stopped at T0 (first compression) + 10 minutes.
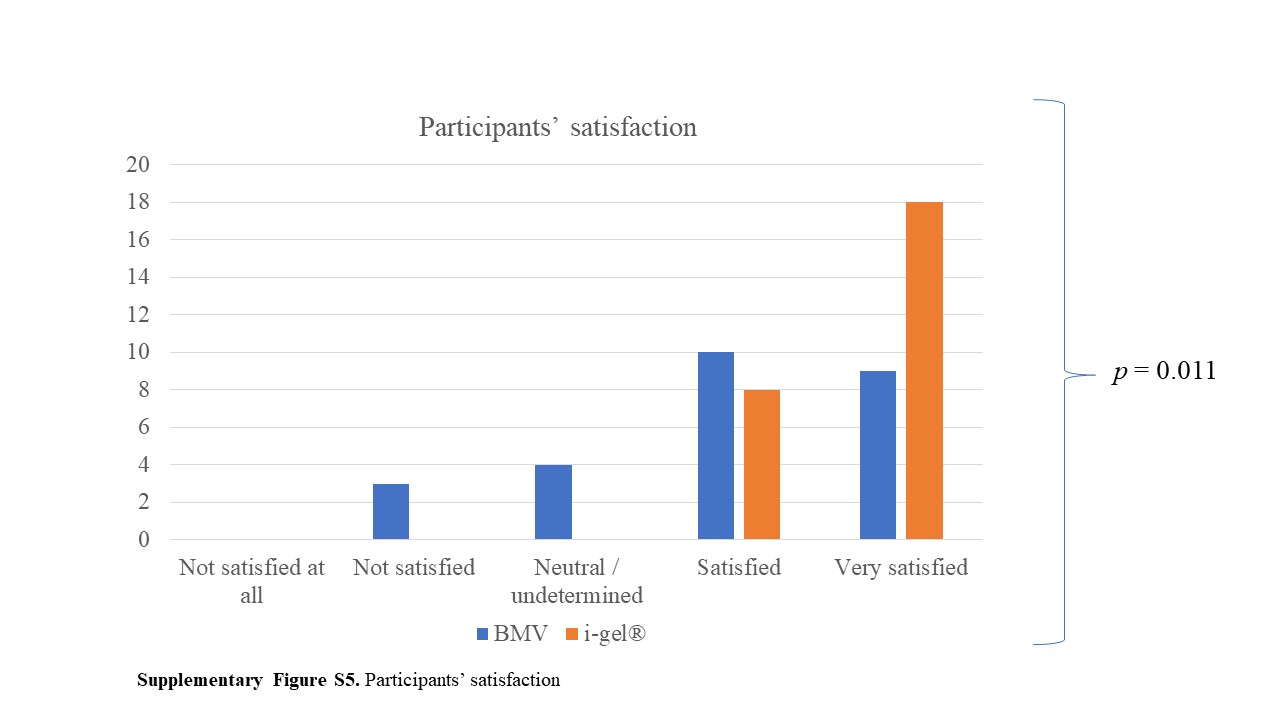
At the end of the scenario, participants were asked to fill a last questionnaire designed to assess their satisfaction regarding the approach they had applied and the cognitive load they had perceived during the study scenario39. Participants were asked to withhold information regarding the aim and course of the study until data collection had been completed in all four EMS.
Equipment
Apart from the multiparametric monitor/defibrillator which was provided with the simulation manikin (Laerdal SimMan 3G, Laerdal Medical, Stavanger, Norway), all teams had access to their usual resuscitation equipment. A size 4 i-gel® device (Intersurgical Ltd., Wokingham, UK) and a lubricant recommended by the manikin’s manufacturer were added to this equipment.
Study outcomes
Primary outcome
The primary outcome was the CCF achieved during the first two minutes of CPR (starting from first compression).
Secondary outcomes
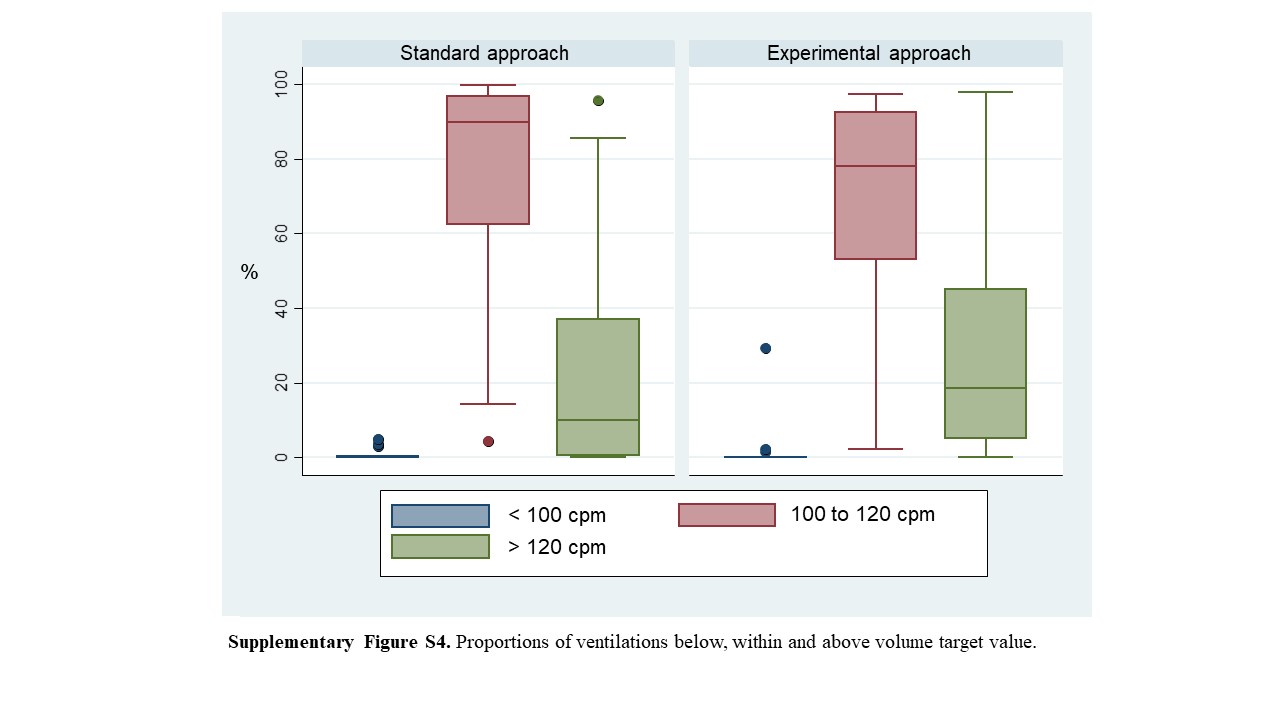
Secondary outcomes were: overall (entire 10-minutes scenario) and per-cycle CCF (at 2-4, 4-6, 6-8 and 8-10 minutes); depth of compressions; proportion of compressions within (5 to 6 cm), below (<5 cm) and above (>6 cm) target value; compressions rate; proportion of compressions within (100-120 compressions per minute - cpm), below (<100 cpm) and above target values (>120 cpm); proportion of compressions with complete chest recoil (<5 mm deviation from the reference value); time to first shock; time to first effective ventilation (defined as > 300 ml)46–50; proportions of ventilations within, (300-700 ml), below (< 300 ml) and above (>700 ml) target values; number of ventilations delivered; provider satisfaction; and self-assessed cognitive load.
Data collection, extraction and curation
Most data were automatically collected through the manikin’s sensors and extracted to a comma-separated values (CSV) file, thereby preventing assessment bias. Variables of interest were automatically generated using a custom-coded PHP script51. Data gathered on paper questionnaires were entered in duplicate using EpiData52 and any discrepancy was listed and resolved to minimize copying and typing errors. Missing data were treated as such. No imputation technique was used. All data that could have allowed the data analyst (DT) to identify group allocation were removed (e.g., number of insertion attempts). The groups were renamed “Teysachaux” and “Moléson” and the curated databases were sent in Stata DTA file format for blinded statistical analysis. All investigators were able to access the curated and coded data sets53.
Sample size calculation
Few data were available to help with sample size calculation. We estimated that the mean time needed to deliver two ventilations would amount to approximately 4 seconds, thereby adding up to 20 seconds per cycle. We also estimated that the initial rhythm analysis should take about 8 seconds, thus increasing the no-compression time to around 28 seconds out of the first 120 seconds cycle (23% of no-flow, worth 77% of CCF in the control group). In the experimental group, we estimated that the no-flow should be lower as ventilations were to be provided without interrupting compressions (8 seconds only for rhythm analysis: 7% of no-flow, worth 93% of CCF). Based on observational data from pilot tests and case reviews, data variability was estimated with a standard deviation of 12. Twenty-six teams were therefore required to have a 90% chance of detecting, at the 5% significance level, a difference in CCF from 77% in the control group to 93% in the experimental group. In the original study protocol39, the sample size calculation resulted in 24 teams because it was calculated with an online calculator54, rather than with Stata.
Statistical analysis
Variables were described using either mean (SD or 95%CI) or median [Q1; Q3] according to normality. Student’s t-test or the Mann-Whitney U test were used accordingly. Proportions were reported with their 95% CI. Cognitive load was treated as a continuous variable. User satisfaction was assessed graphically, then tested using Fisher’s exact test. There was a minor protocol deviation as we had initially planned to dichotomize this variable. To avoid losing valuable information, it was however decided not to proceed with dichotomization. This decision was taken after protocol publication, but before completion of data collection and statistical analysis. A two-sided p-value lower than 0.05 was considered significant. All statistical analyses were performed using Stata V15.1 (StataCorp. 2017. Stata Statistical Software: Release 15. College Station, TX: StataCorp LLC).