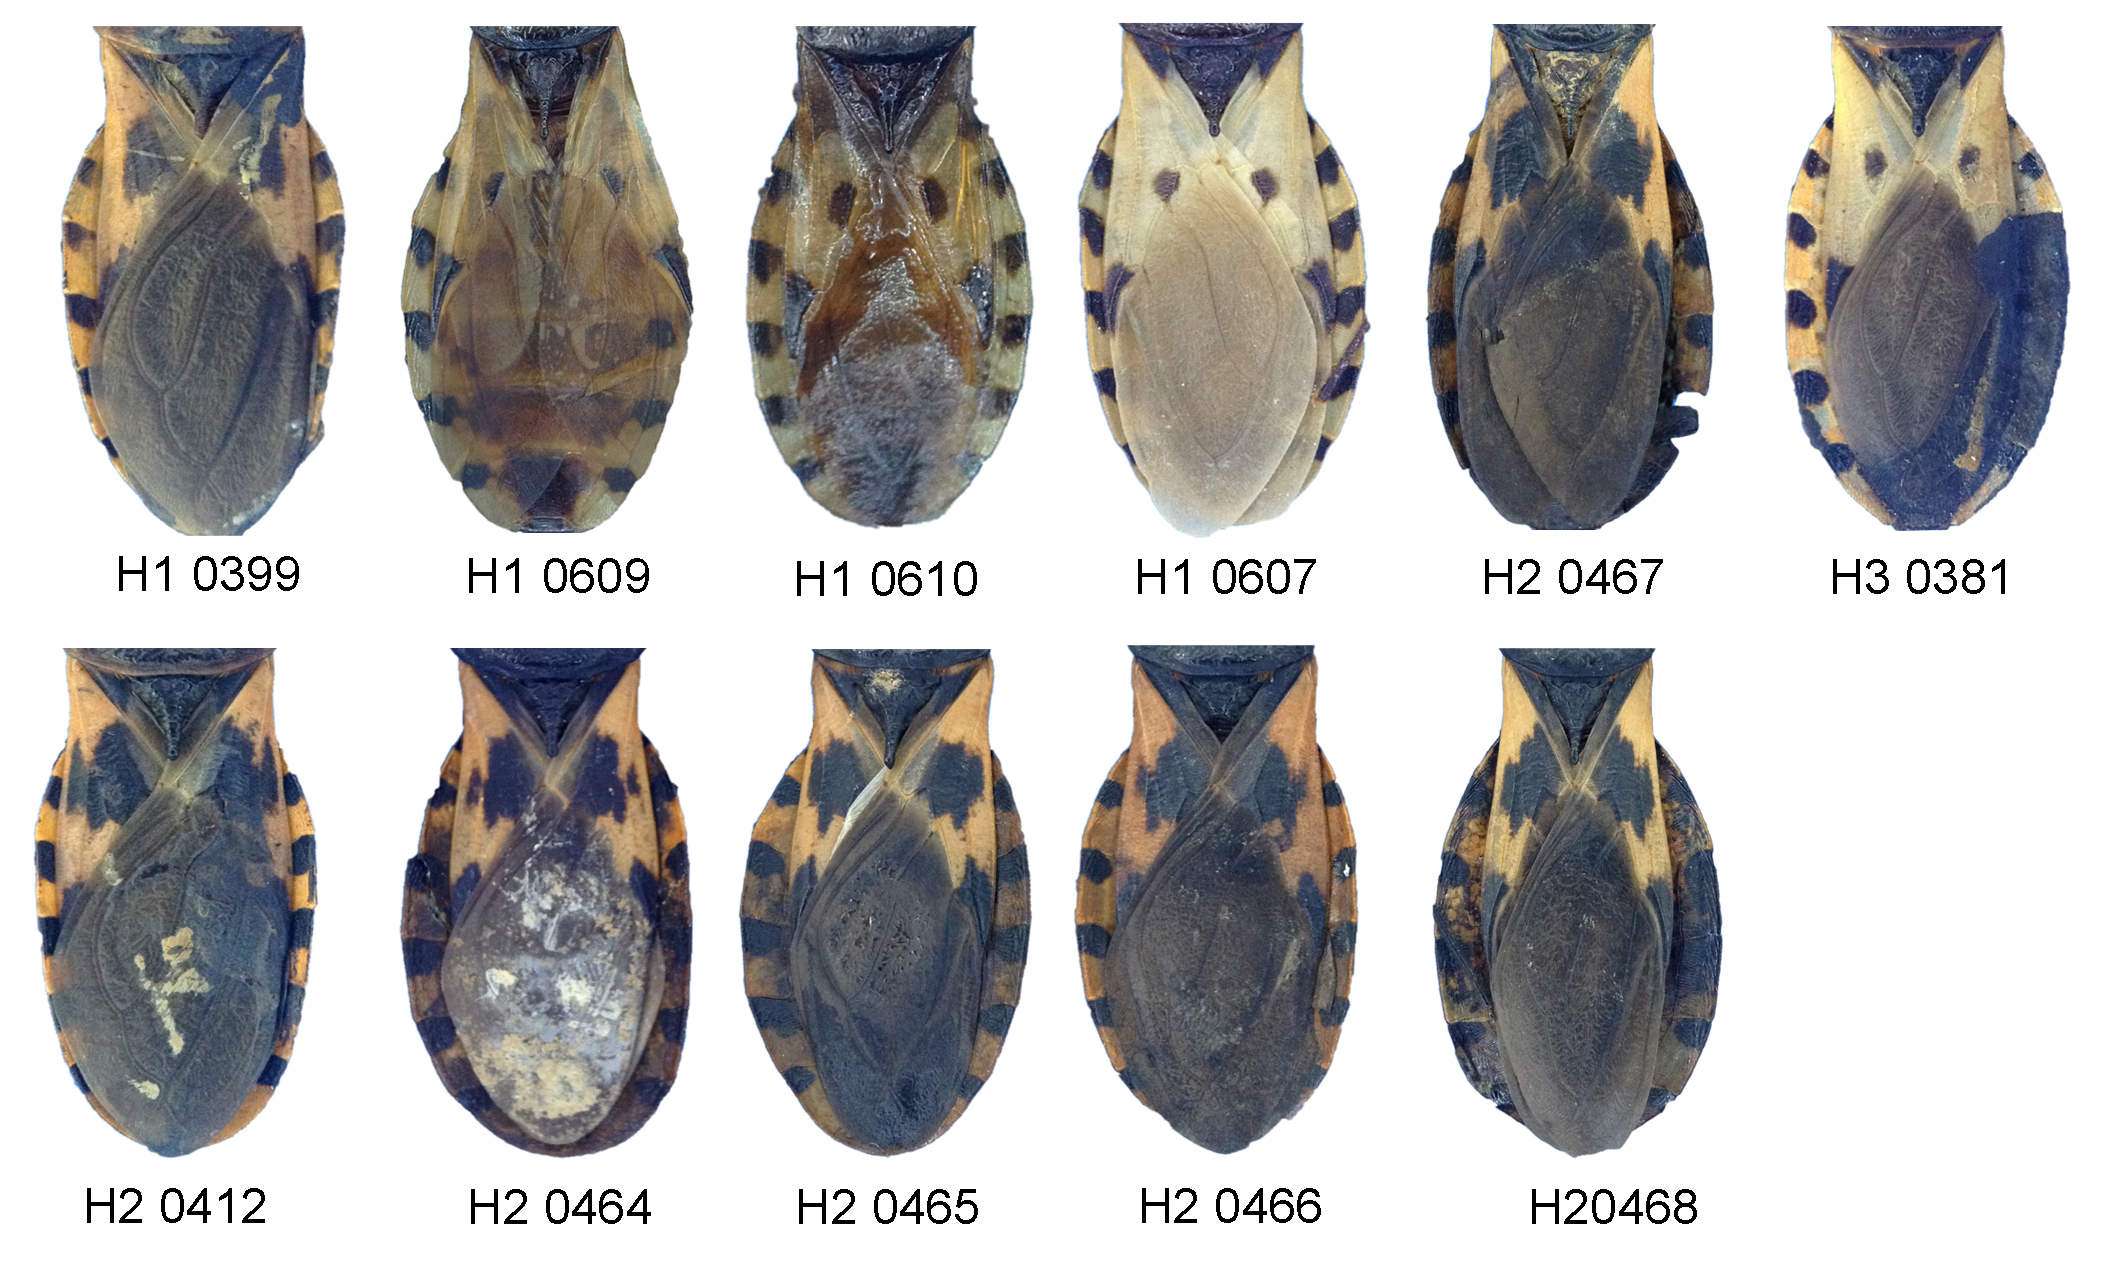
The cryptic dimidiata species complex has been largely supported using molecular tools, which has led to the identification of three phylogenetically well-differentiated haplogroups in Mexico and part of Central America [9, 11, 12], and two taxa have been formally described as new species [37, 38]. For the first time, we used the spot pattern presented by this complex to discriminate among haplogroups (possible cryptic species) by extracting and analyzing quantifiable variables from digital images.
Our results demonstrate the ability to use these measures to correctly recognize the haplogroups analyzed. Of the variables used for discrimination, only one (mean relative area of the lateral spots) did not differ significantly among haplogroups, indicating that overall, pattern variables were useful for delimitation. This was verified both by the discriminant analysis ordination plot and the results obtained by the most efficient neural network.
The study of coloration in triatomines and its application in taxonomy has mainly been used in traditional qualitative approaches [32]. This has led to the assumption of a lack of clear morphological diagnostic characters to facilitate recognition and formal descriptions at the species level [15]. However, using heat maps, three well-differentiated spot patterns were evident, corresponding with the three haplogroups. This, once again, highlights the importance of using quantitative tools to study complex patterns such as coloration, where subtle aspects such as the orientation of groups of spots or other patterns may not be apparent or easily distinguishable to a human observer.
The variation found among the haplogroups in spot pattern may respond to different processes. In other groups of insects such as butterflies, coloration patterns have been shown to vary depending on environmental conditions such as temperature [39, 40], associated with processes of genetic assimilation of phenotypic changes [41]. Although there are populations where the three T. dimidiata haplogroups analyzed in this study are found sympatrically [see 11], their distributions are mostly allopatric, therefore the pattern of variation among these haplogroups may reflect adaptation to environments with different characteristics in response to environmental stress. Recently, genetic assimilation in the evolution of phenotypic plasticity has been demonstrated not only for butterflies but also for various groups of organisms [42, 43, 44, 45]. However, corroborating this phenomenon in T. dimidiata will require specifically designed studies.
Another important aspect that this research demonstrates is the value of the combination of digital image analysis and machine learning for taxonomy [46]. The potential of this combination of approaches in species delimitation has been broadly demonstrated [47]. However, even though its utility is clear and, in many cases, superior to the traditional taxonomy, it is still relatively rarely used.
Classical taxonomy is a science that is practically in danger of extinction, especially due to the lack of expert taxonomists and specialists in species identification, which require many years of training and experience [48]. In the era of big data, image pattern recognition is a new technology that provides many potential advantages for taxonomists, including speeding up and automating the classification process, reducing error, and assimilating quantitative information that would be impossible for a human observer [49].
Specifically, with triatomines, there have been recent efforts to employ these methods to establish automated identification systems. These include the studies of Gurgel-Goncalves et al. [20] and Khalighifar et al. [50], who, using geometric morphometry techniques and deep learning algorithms, respectively, have taken the first steps in this regard. In another example, Cruz et al. [26] were able to discriminate T. dimidiata haplogroups with high correct discrimination values by characterizing the entire body contour using Fourier Elliptical Descriptors, and this same method has been successfully used to generate automated identification systems in other groups of insects [51]. The integration of this method with the analysis of the spot pattern is potentially a novel and powerful tool to generate a computer-based approach for species identification in cryptic groups. Although classification processes still need improvement, these novel works bring new challenges and perspectives in the field of epidemiological entomology, and the integration of methods should be a central aspect in the future of automated identification in this group, given its epidemiological importance, as well as in other groups of insects.
Although this research was focused on evaluating the possibility of correctly discriminating three haplogroups of T. dimidiata using the dorsal spot pattern, the value of coloration patterns in species biology cannot be forgotten. Color in insects has important biological functions including mate choice, intra-sexual competition, dominance relationships, and other social interactions [52]. Therefore, its study is relevant in many contexts beyond taxonomy, and research should be increased to explore the role that coloration patterns play in nature. In relation to other groups of insects such as Coleoptera, Lepidoptera and Hymenoptera, in Hemiptera and especially the Triatominae subfamily, there are very few studies associated with the coloring patterns. [52].