Trends in incidence of TB
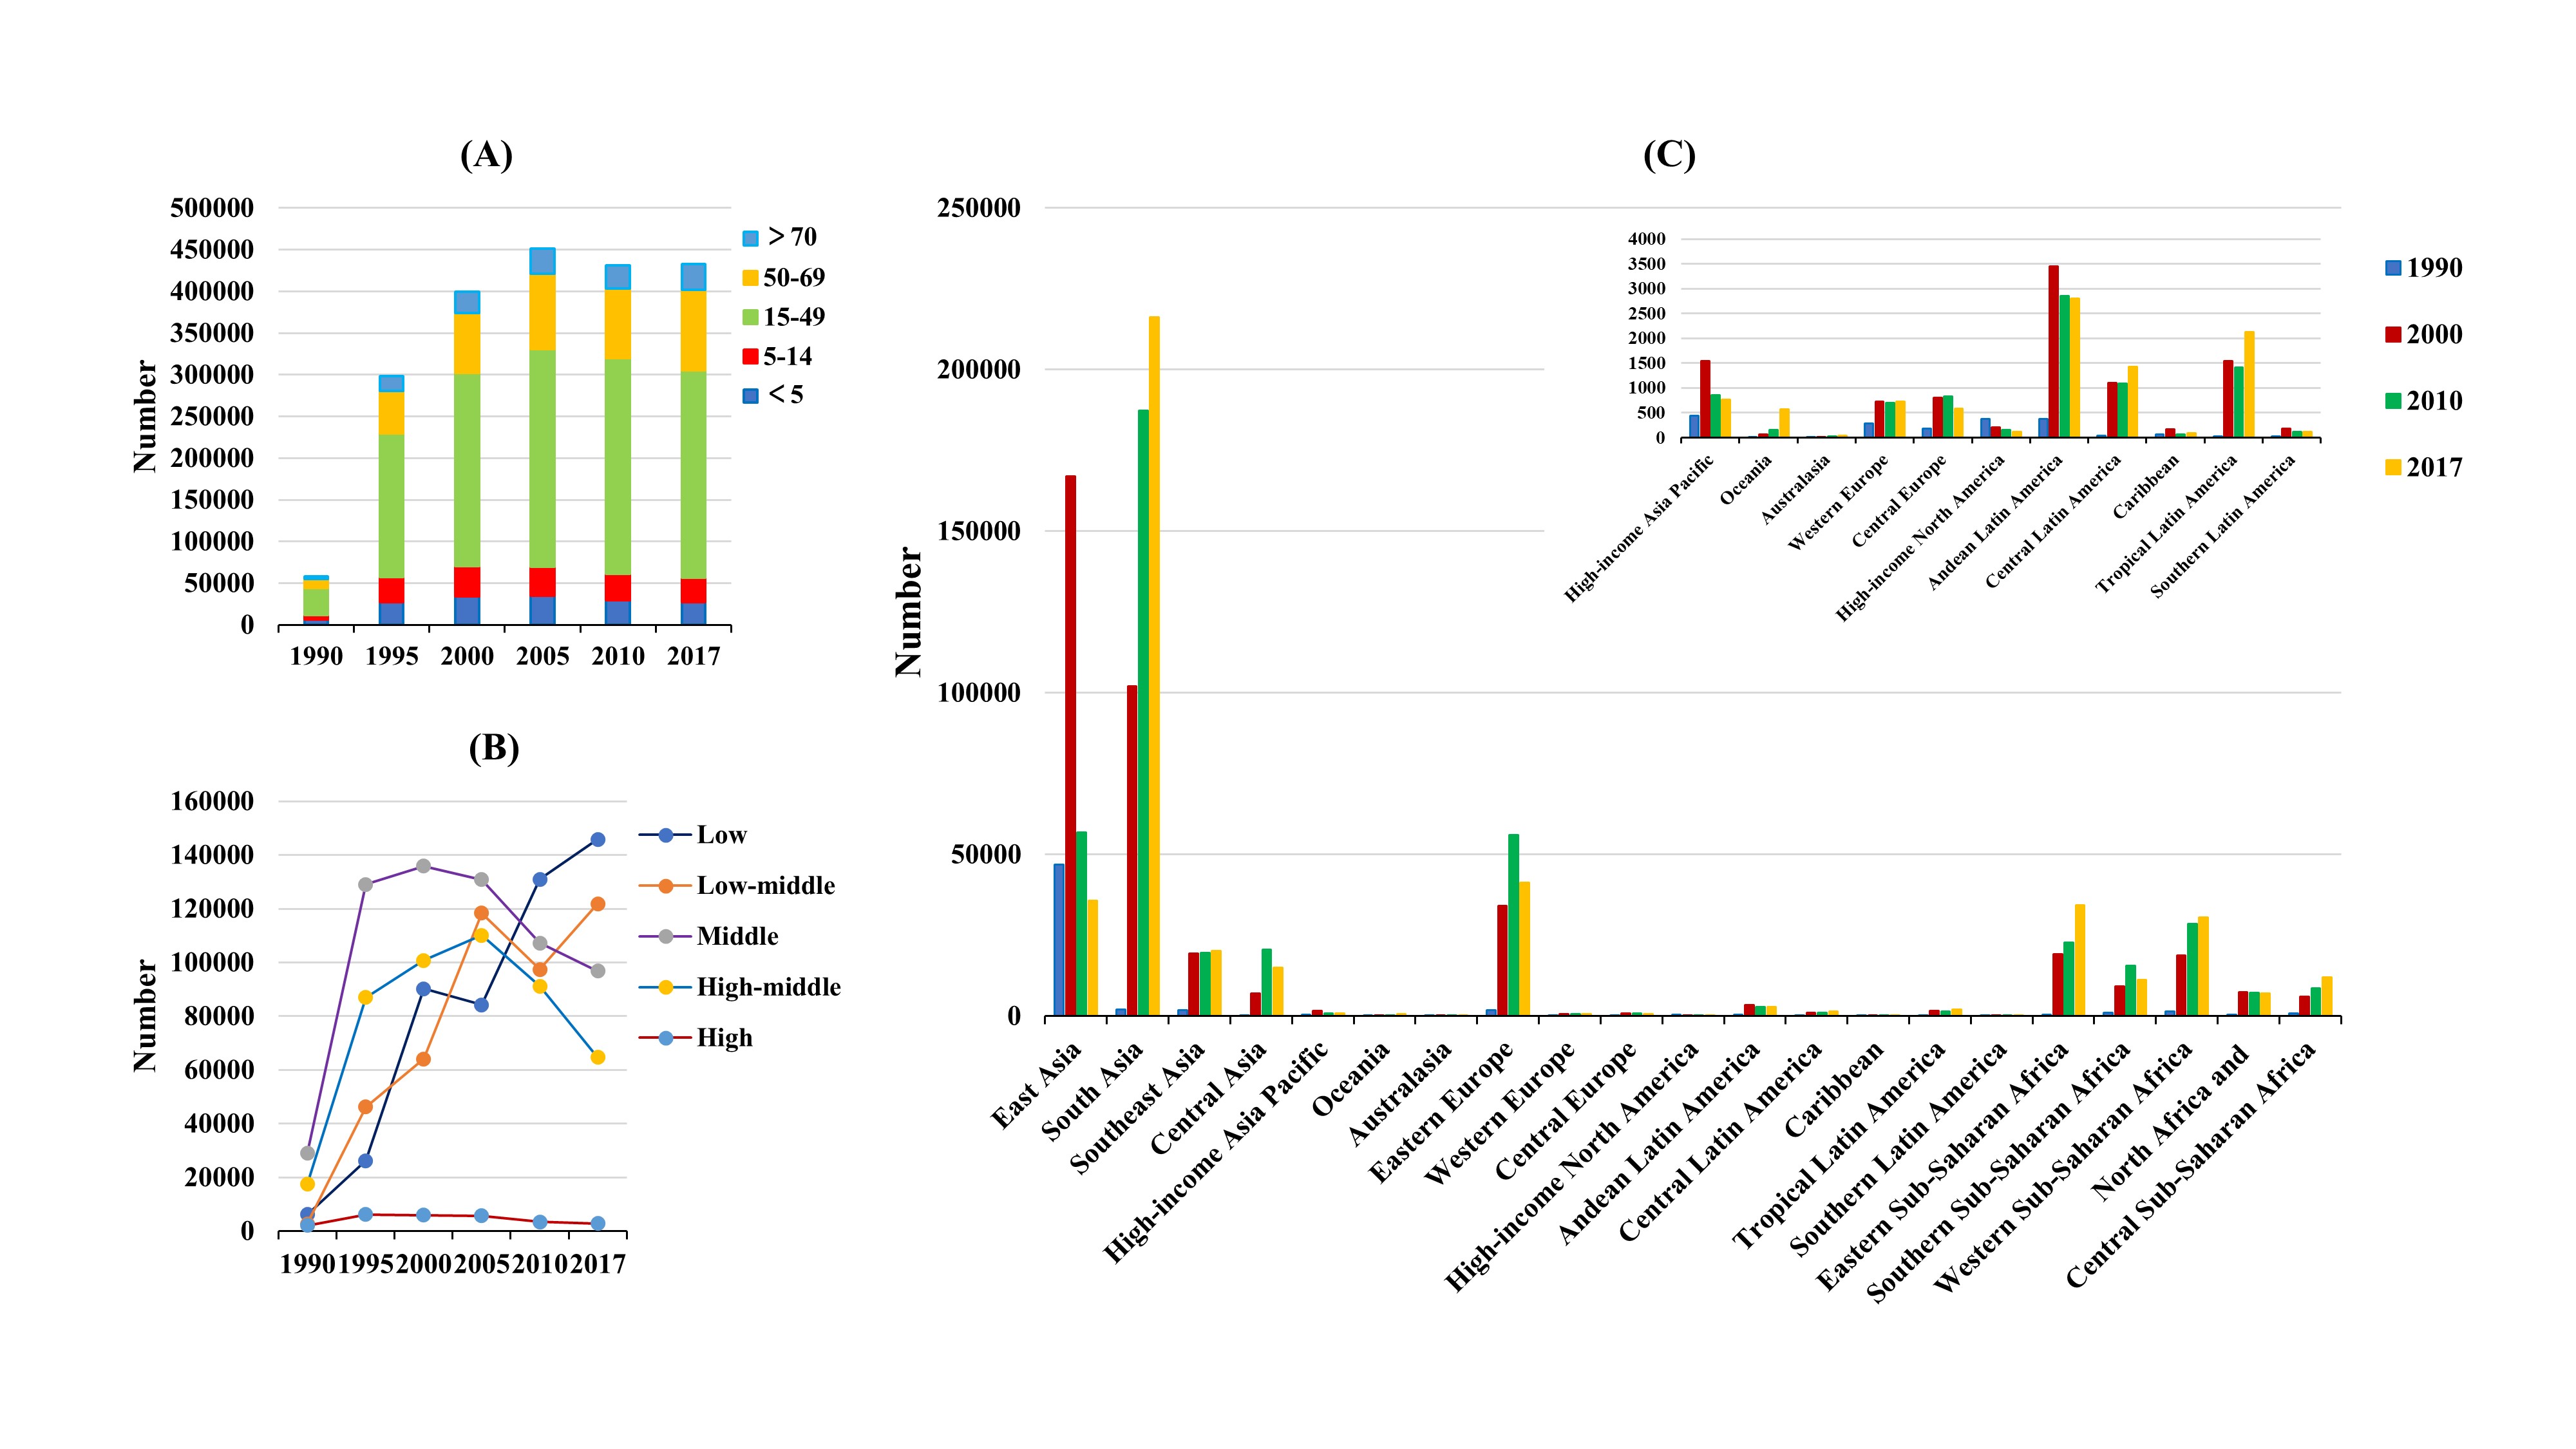
Globally, the incidence of TB was 8965.81 × 103 (95%UI: 8191.85 × 103 to 9820.79 × 103) in 2017, corresponding to an increase of 9.42% from 1990 (Table 1). The overall ASIR decreased by an annual average of 1.19% during 1990–2017 (EAPC = − 1.19, 95%CI: −1.25 to − 1.13). The decreasing trend in ASIR of TB was more obvious in females, with the EAPC of − 1.28 (95%CI: −1.35 to − 1.21). When comparing different age groups, the highest increase in number of TB cases was observed in age groups above 70 years, and a decrease in the number of TB cases occurred in age groups under 14 globally (see web-only Supplementary Table S1). Decreasing trends of TB were observed in most SDI areas and geographic regions. All SDI areas showed a decreasing trend of ASIR, particularly in high-middle SDI areas (EAPC = − 2.83, 95%CI: −3.07 to − 2.59). In terms of geographic regions, the largest increase in incidence was found in Central Sub-Saharan Africa (81.66%), followed by Oceania (64.78%) and Eastern Sub-Saharan Africa (62.39%), while the largest decrease was in East Asia (− 49.05%) (Table 1). The decreasing trends in ASIR of TB occurred in 19 geographic regions, and those with the largest decrease were in East Asia (EAPC = − 4.05, 95%CI: −4.38 to − 3.72), followed by Andean Latin America and high-income North America (Table 1, Figs. 1 and 2). Among the 195 countries/territories, the highest increased change in the incidence of TB cases occurred in the United Arab Emirates (257.45% increase), while the strongest decrease (− 58.62%) was seen in Estonia (see web-only Supplementary Table S2, Fig. 3). The ASIR of TB showed decreasing trends in 168 countries/territories, particularly in Ethiopia and China, in which the EAPCs were − 4.51 (95%CI: −5.00 to − 4.02) and − 4.21 (95%CI: −4.56 to − 3.87), respectively (see web-only Supplementary Table S2, Fig. 3). However, increasing trends occurred in 17 countries/territories, and the largest increase occurred in Kenya (EAPC = 2.10, 95% CI: 1.71 to 2.49), followed by Lesotho and Ukraine (see web-only Supplementary Table S2, Fig. 3). The EAPCs (2000–2017) showed a positive correlation with the ASIR in 1990, and a negative association with the HDI in 2017 at a national level (ρ = 0.23, p = 0.01, Fig. 10A; ρ=−0.26, p < 0.001, Fig. 10B, respectively).
Table 1
The number and age-standardised rate of tuberculosis incidence globally and stratified by sex, SDI areas and geographic regions in 1990 and 2017, and the percentage change in the absolute number of cases and the EAPCs from 1990 to 2017
| |
1990
|
2017
|
1990–2017
|
|
Characteristics
|
Number
No.×103 (95% UI)
|
ASR per 100 k
No. (95% UI)
|
Number
No.×103 (95% UI)
|
ASR per 100 k
No. (95% UI)
|
Percentage change in
absolute number (%)
|
EAPCs
No.(95%CI)
|
|
Overall
|
8194.03
(7476.18–9014.58)
|
156.59
(143.02–171.37)
|
8965.81
(8191.85–9820.79)
|
115.78
(105.79–126.95)
|
9.42
|
−1.19
(− 1.25 to − 1.13)
|
|
Sex
|
|
|
|
|
|
|
|
Male
|
4213.78
(3845.21–4609.42)
|
167.53
(153.86–182.49)
|
4913.77
(4499.26–5375.83)
|
126.57
(116.25–137.97)
|
16.61
|
−1.13
(− 1.20 to − 1.07)
|
|
Female
|
3980.25
(3616.03–4389.58)
|
148.16
(135.07–163.1)
|
4052.04
(3689.23–4447.33)
|
106.17
(96.62–116.67)
|
1.80
|
−1.28
(− 1.35 to − 1.21)
|
|
SDI
|
|
|
|
|
|
|
|
Low
|
2147.49
(1964.12–2354.29)
|
377.33
(346.05–410.62)
|
3081.85
(2809.34–3392.95)
|
277.77
(255.4–302.38)
|
43.51
|
−1.18
(− 1.25 to − 1.12)
|
|
Low-middle
|
2403.69
(2198.44–2639.18)
|
268.08
(247.07–290.59)
|
2940.34
(2684.15–3229.73)
|
185.65
(170.59–201.77)
|
22.33
|
−1.38
(− 1.45 to − 1.31)
|
|
Middle
|
2431.81
(2205.75–2688.37)
|
169.49(
154.83–185.08)
|
2123.69
(1941.70–2325.71)
|
98.20
(89.85–107.32)
|
−12.67
|
−2.02
(− 2.06 to − 1.99)
|
|
High-middle
|
963.52
(873.52–1065.25)
|
86.77
(79.00–95.58)
|
666.03
(608.42–729.37)
|
43.78
(39.97–47.72)
|
−30.88
|
−2.83
(− 3.07 to − 2.59)
|
|
High
|
214.91
(191.96–241.01)
|
20.64
(18.42–23.3)
|
135.65
(125.09–146.93)
|
9.98
(9.13–10.90)
|
−36.88
|
−2.71
(− 2.82 to − 2.60)
|
|
Regions
|
|
|
|
|
|
|
|
East Asia
|
1770.77
(1610.58–1954.82)
|
144.88
(132.56–158.41)
|
902.29
(823.24–987.73)
|
55.94
(51.06–61.02)
|
−49.05
|
−4.05
(− 4.38 to − 3.72)
|
|
South Asia
|
2734.76
(2493.13–3018.24)
|
294.27
(269.81–320.92)
|
3432.76
(3132.77–3765.86)
|
205.34
(188.55–224.02)
|
25.52
|
−1.29
(− 1.35 to − 1.23)
|
|
Southeast Asia
|
1023.97
(929.33–1138.69)
|
251.89
(230.31–275.82)
|
964.54
(878.85–1056.06)
|
149.42
(136.93–162.47)
|
−5.80
|
−1.90
(− 2.07 to − 1.74)
|
|
Central Asia
|
63.38
(56.91–70.58)
|
94.63
(85.28–104.85)
|
73.65
(67.25–80.66)
|
79.05
(72.39–85.96)
|
16.20
|
−0.86
(− 1.32 to − 0.40)
|
|
High-income
Asia Pacific
|
91.05
(80.64–102.64)
|
47.90
(42.49–54.13)
|
56.77
(52.33–61.3)
|
20.91
(19.21–22.73)
|
−37.65
|
−2.73
(− 3.06 to − 2.40)
|
|
Oceania
|
9.88
(8.96–10.97)
|
176.37
(161.53–192.86)
|
16.28
(14.69–18.16)
|
138.76
(126.33–152.26)
|
64.78
|
−1.10
(− 1.29 to − 0.91)
|
|
Australasia
|
1.57
(1.38–1.79)
|
7.55
(6.64–8.6)
|
1.65
(1.50–1.79)
|
5.68
(5.15–6.22)
|
5.10
|
−0.81
(− 1.05 to − 0.56)
|
|
Eastern Europe
|
144.22
(128.78–161.67)
|
61.11
(54.60–68.50)
|
141.27
(126.67–157.05)
|
60.32
(54.23–66.78)
|
−2.05
|
0.21
(− 0.32–0.75)
|
|
Western Europe
|
51.51
(45.21–59.13)
|
13.17
(11.52–15.21)
|
31.81
(28.91–34.97)
|
7.89
(7.06–8.79)
|
−38.25
|
−1.66
(− 1.78 to − 1.54)
|
|
Central Europe
|
39.77
(35.64–43.91)
|
30.27
(27.18–33.54)
|
26.62
(24.63–28.67)
|
19.94
(18.38–21.51)
|
−33.07
|
−2.03
(− 2.34 to − 1.72)
|
|
High-income North America
|
15.65
(13.84–17.64)
|
5.18
(4.59–5.87)
|
9.69
(8.73–10.84)
|
2.51
(2.25–2.81)
|
−38.08
|
−3.11
(− 3.4 to − 2.82)
|
|
Andean Latin America
|
54.17
(49.36–59.64)
|
158.70
(146.05–172.85)
|
40.43
(36.97–44.36)
|
66.55
(61.03–72.81)
|
−25.36
|
−3.69
(− 4.01 to − 3.38)
|
|
Central Latin America
|
37.17
(33.69–41.14)
|
29.06
(26.62–31.77)
|
47.37
(43.28–52.2)
|
18.65
(17.09–20.49)
|
27.44
|
−2.13
(− 2.34 to − 1.93)
|
|
Caribbean
|
15.93
(14.58–17.5)
|
45.75
(41.97–50.06)
|
15.71
(14.31–17.28)
|
33.41
(30.34–36.68)
|
−1.38
|
−1.23
(− 1.42 to − 1.05)
|
|
Tropical Latin America
|
58.35
(51.97–65.98)
|
42.48
(38.07–47.71)
|
70.87
(63.5–79.84)
|
30.03
(26.89–33.7)
|
21.46
|
−1.65
(− 1.79 to − 1.50)
|
|
Southern Latin America
|
10.64
(9.59–11.88)
|
21.72
(19.62–24.21)
|
8.48
(7.85–9.15)
|
12.53
(11.57–13.54)
|
−20.30
|
−2.31
(− 2.54 to − 2.08)
|
|
Eastern Sub − Saharan Africa
|
691.34
(631.29–757.06)
|
442.10
(404.97–483.88)
|
1122.69
(1021.94–1238.74)
|
315.86
(289.27–346.1)
|
62.39
|
−1.34
(− 1.55 to − 1.13)
|
|
Southern Sub-Saharan Africa
|
272.85
(246.01–301.34)
|
528.83
(480.24–580.35)
|
345.38
(308.85–386.87)
|
430.09
(388.77–477.49)
|
26.58
|
0.52
(0.09–0.95)
|
|
Western Sub-Saharan Africa
|
615.49
(565.31–671.29)
|
393.42
(362.79–426.17)
|
912.74
(836.25–999.91)
|
258.94
(238.85–282.09)
|
48.29
|
−1.70
(− 1.79 to − 1.62)
|
|
North Africa and
Middle East
|
221.10
(200.94–243.18)
|
71.41
(65.35–78.11)
|
253.52
(228.39–281.59)
|
43.44
(39.48–47.93)
|
14.66
|
−1.99
(− 2.05 to − 1.93)
|
|
Central Sub-Saharan
Africa
|
270.45
(245.85–296.71)
|
615.27
(562.23–672.39)
|
491.30
(443.99–544.68)
|
504.77
(459.88–551)
|
81.66
|
−0.73
(− 0.82 to − 0.65)
|
| EAPC: estimated annual percentage change; ASR, age-standardised rate; CI, confidence interval; UI: uncertainty interval; SDI: socio-demographic index. Percentage change in absolute number was calculated based on the crude data. |
Trends in incidence of MDR-TB
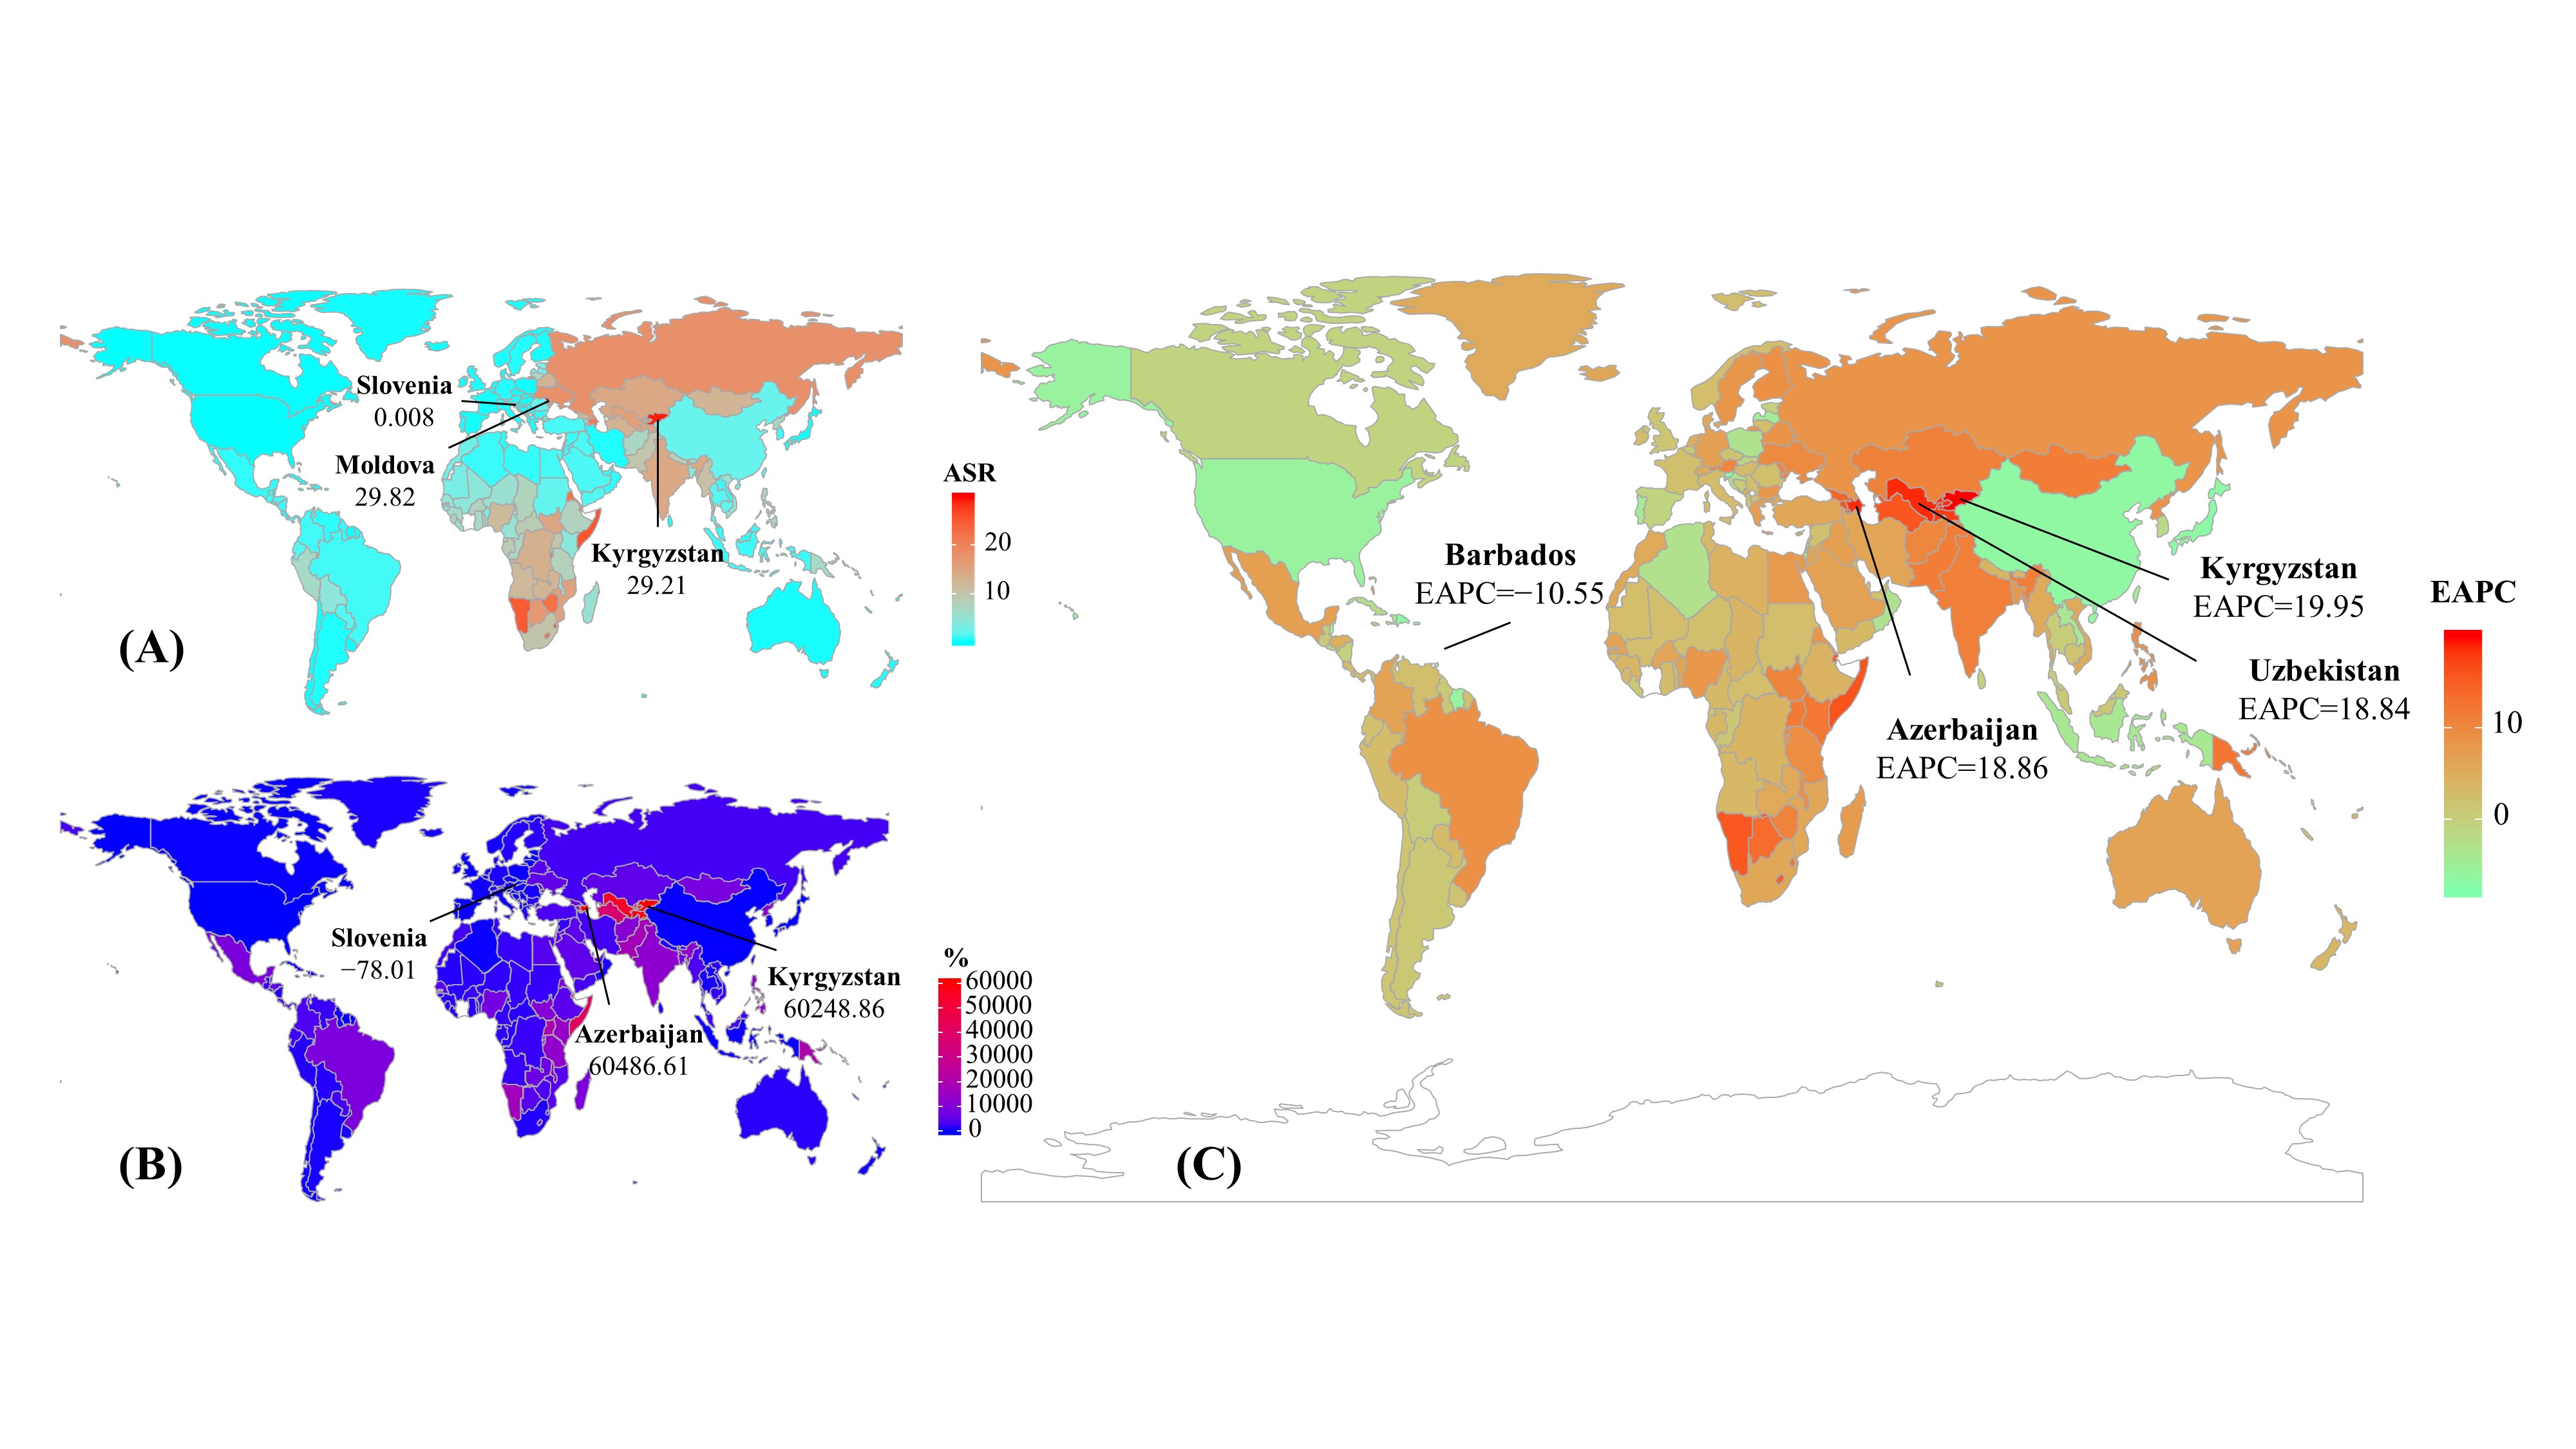
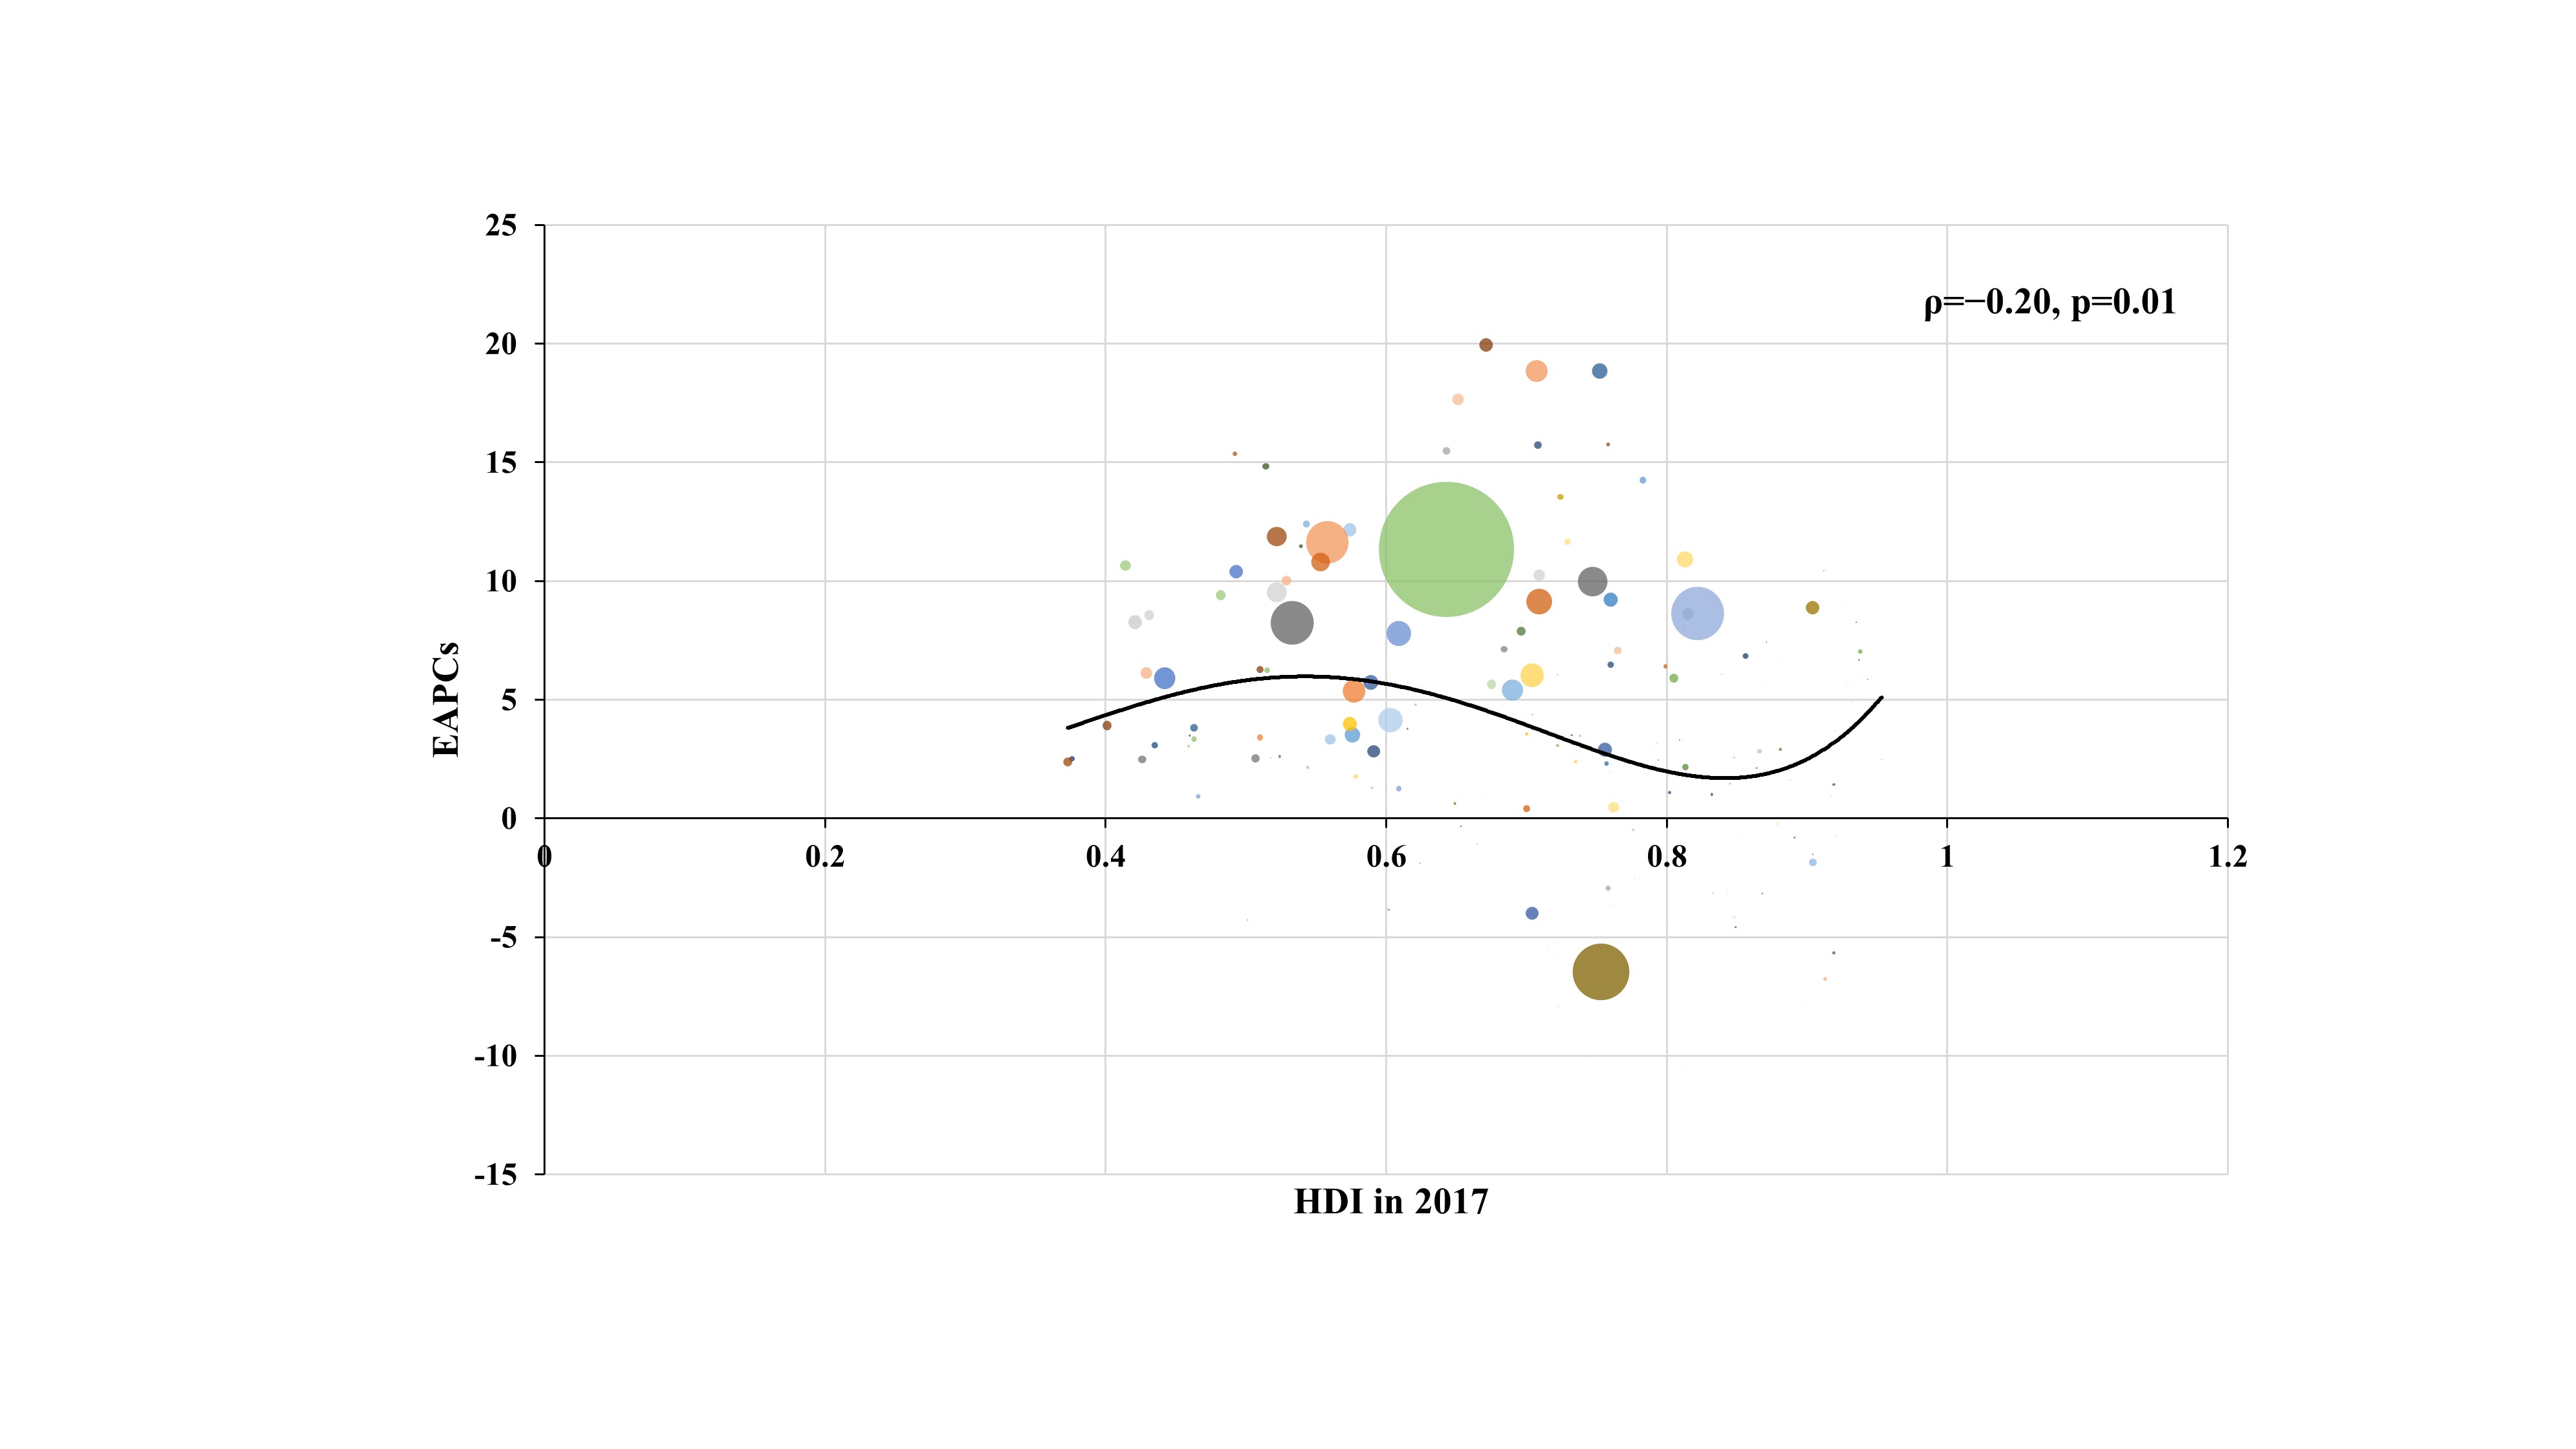
Globally, the number of incident MRD-TB cases increased 642.57% from 1990 to 2017, and was 432.77 × 10³ (95% UI: 254.61 × 10³–726.95 × 10³) in 2017 (see web-only Supplementary Table S3, Fig. 1). The trend in ASIR of MDR-TB showed an increasing trend globally from 1990 to 2017, with an EAPC of 2.59 (95% CI: 1.01 to 4.20) (see web-only Supplementary Table S3). The largest increase in the number of incident cases of MDR-TB occurred in low SDI areas (4447.76%) (see web-only Supplementary Table S3, see web-only Supplementary Figure S1). The ASIR of MDR-TB showed increasing trends in low-middle SDI areas, and particularly in low SDI areas (EAPC = 7.97, 95% CI: 5.52 to 10.46). For 21 geographic regions, the number of incident cases of MDR-TB decreased in East Asia and high-income North America, and conversely, increased in other regions, particularly in Central Asia (16566.67%) (see web-only Supplementary Table S3 and Supplementary Figure S1). The increasing trends in ASIR were found in 10 geographic regions, especially in Central Asia (EAPC = 14.19, 95%CI: 10.2 to 18.33), followed by Oceania and South Asia. Among the 195 countries/territories, the highest increase in the number of incident cases was observed in Azerbaijan (60486.61%), whereas the highest decrease was observed in Slovenia (− 78.01%) (see web-only Supplementary Table S6, Supplementary Figure S5). The ASIR for MDR-TB showed rising trends in 133 countries/territories, particularly Kyrgyzstan, Azerbaijan, and Uzbekistan, in which the EAPCs were 19.95 (95%CI: 15.54 to 24.52), 18.86 (95%CI: 14.5 to 23.39), and 18.84 (95%CI: 14.31 to 23.56), respectively. However, trends in the ASIR for MDR-TB decreased in 33 countries/territories, and the most pronounced decreases occurred in Slovenia and Japan, in which the EAPCs were − 7.81 (95%CI: −9.77 to − 5.79) and − 6.77 (95%CI: −8.51 to − 4.99), respectively (see web-only Supplementary Table S5 and Supplementary Figure S3). The EAPCs had a positive association with the HDI in 2017 at the national level (ρ=−0.20, p = 0.01, see web-only Supplementary Figure S5), but not with the ASIR in 1990.
Incidence trends of XDR-TB
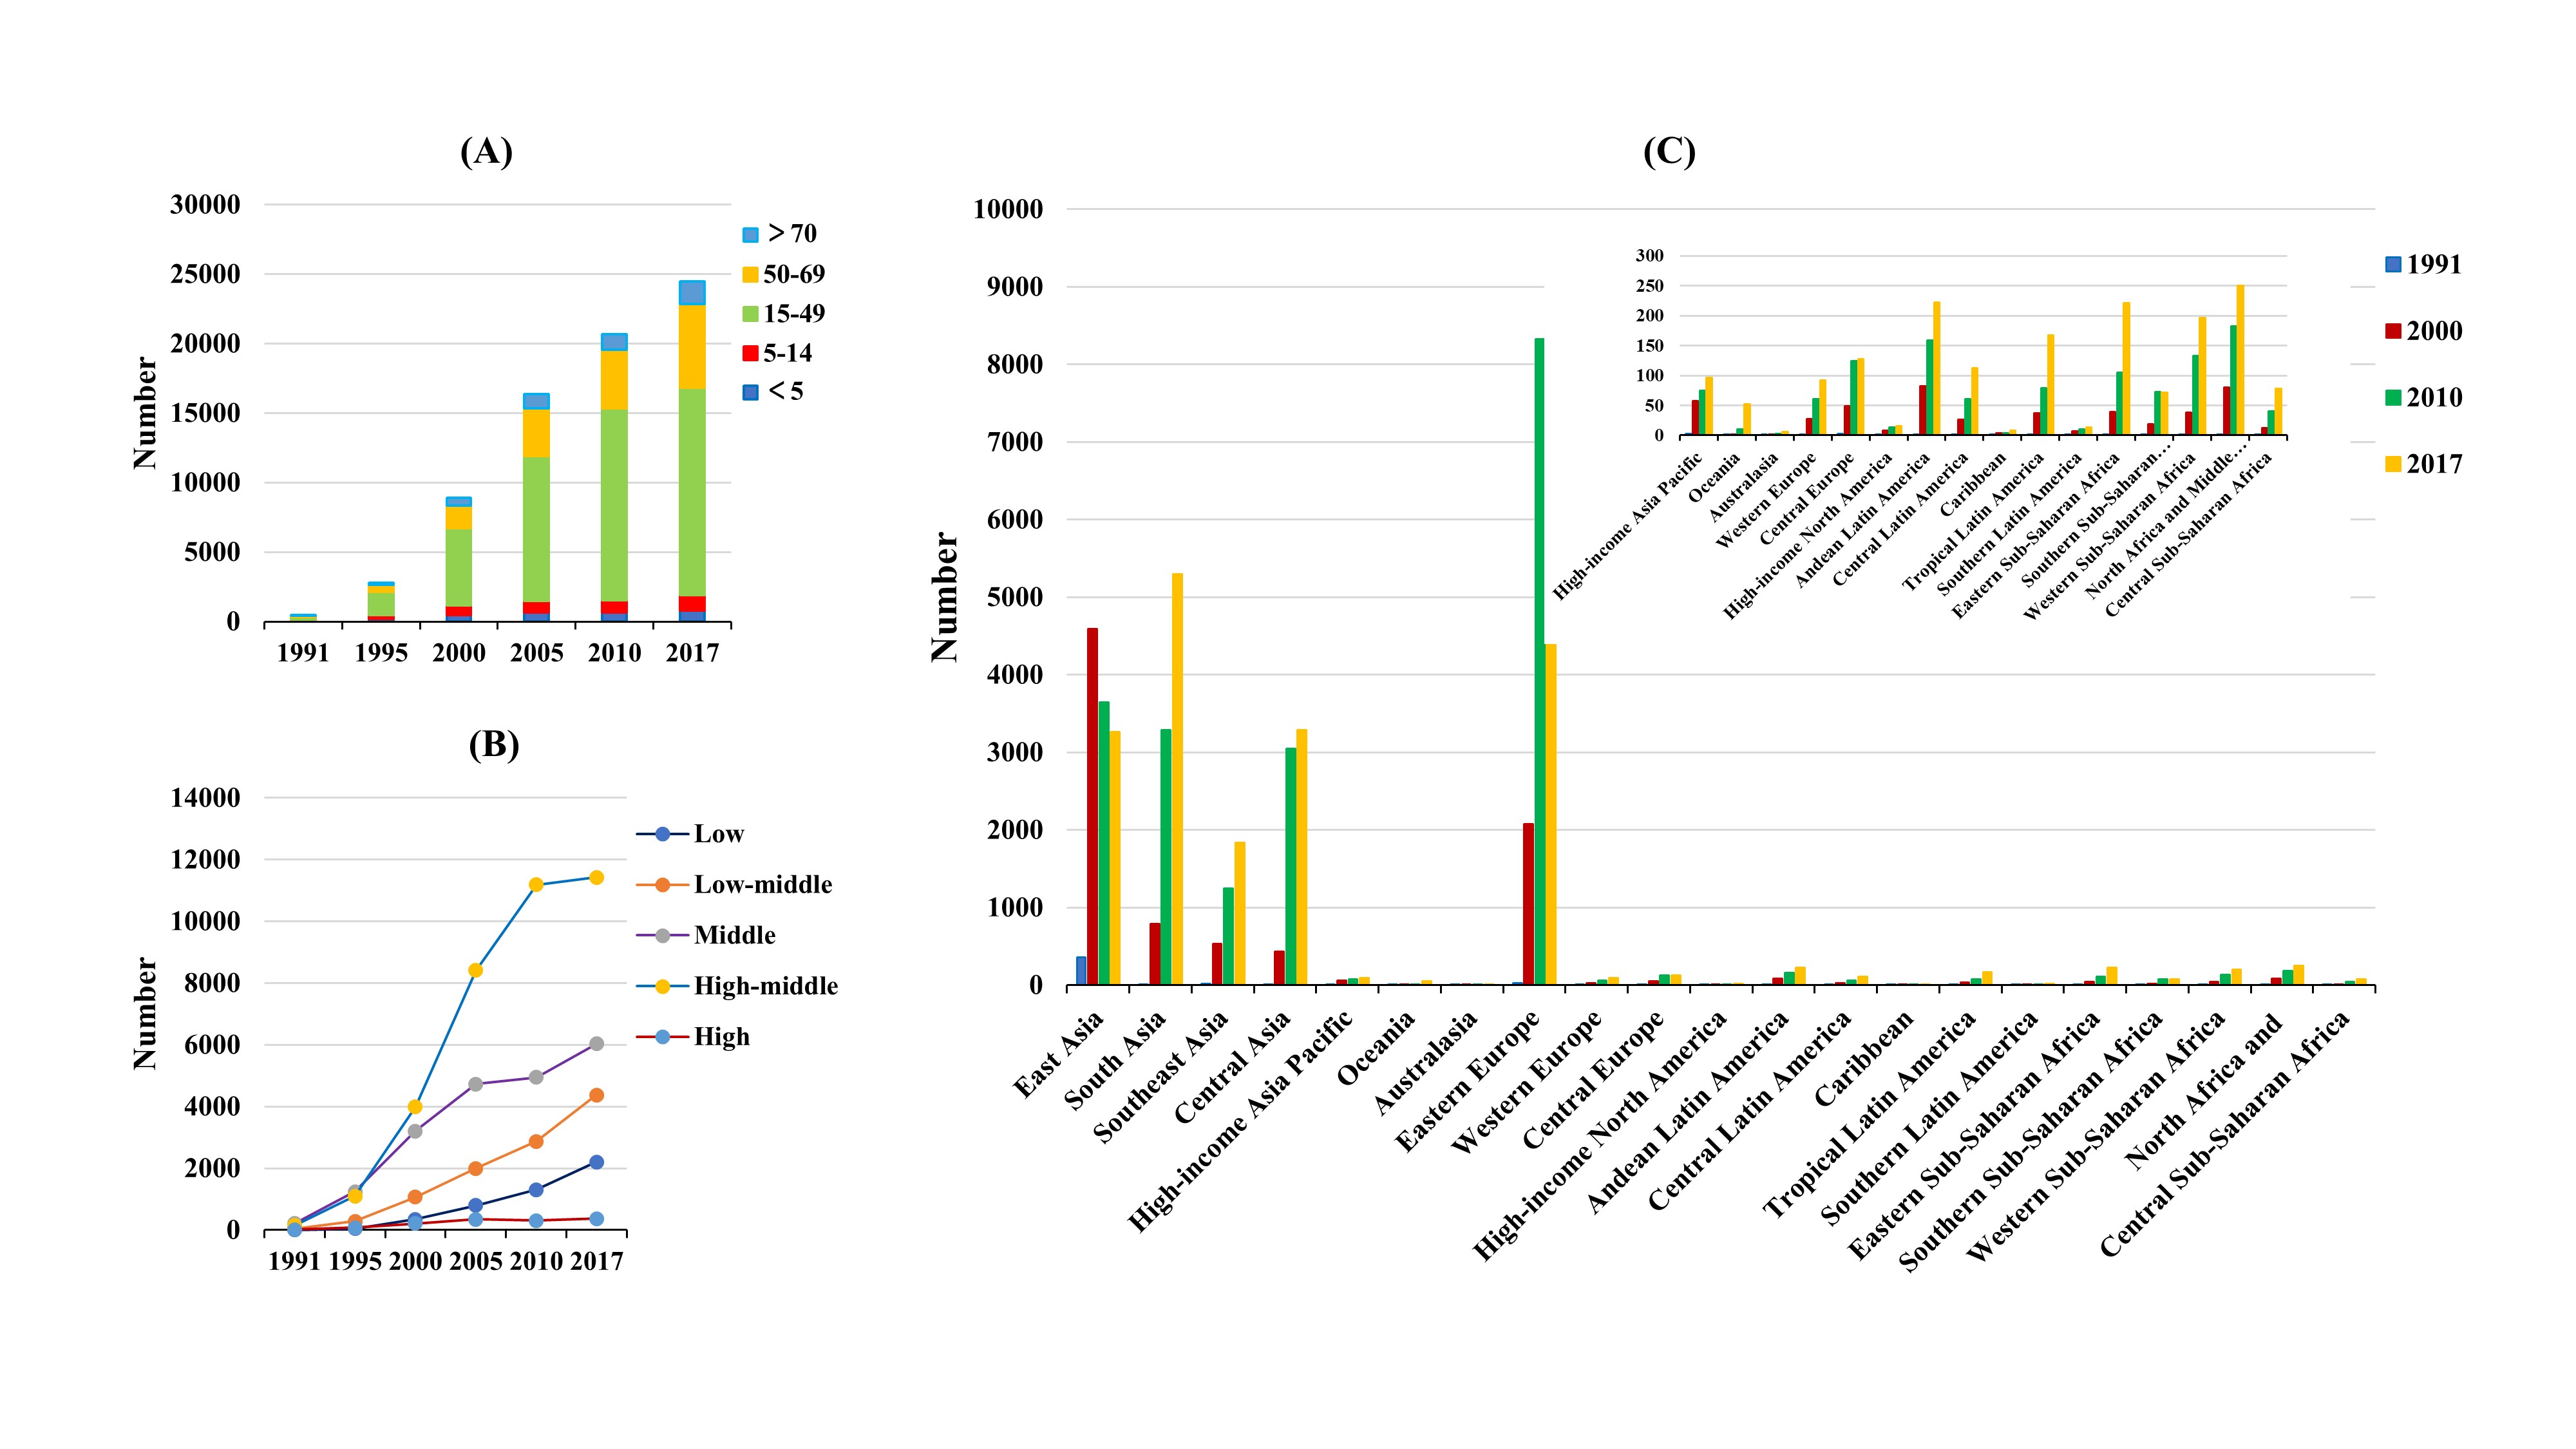
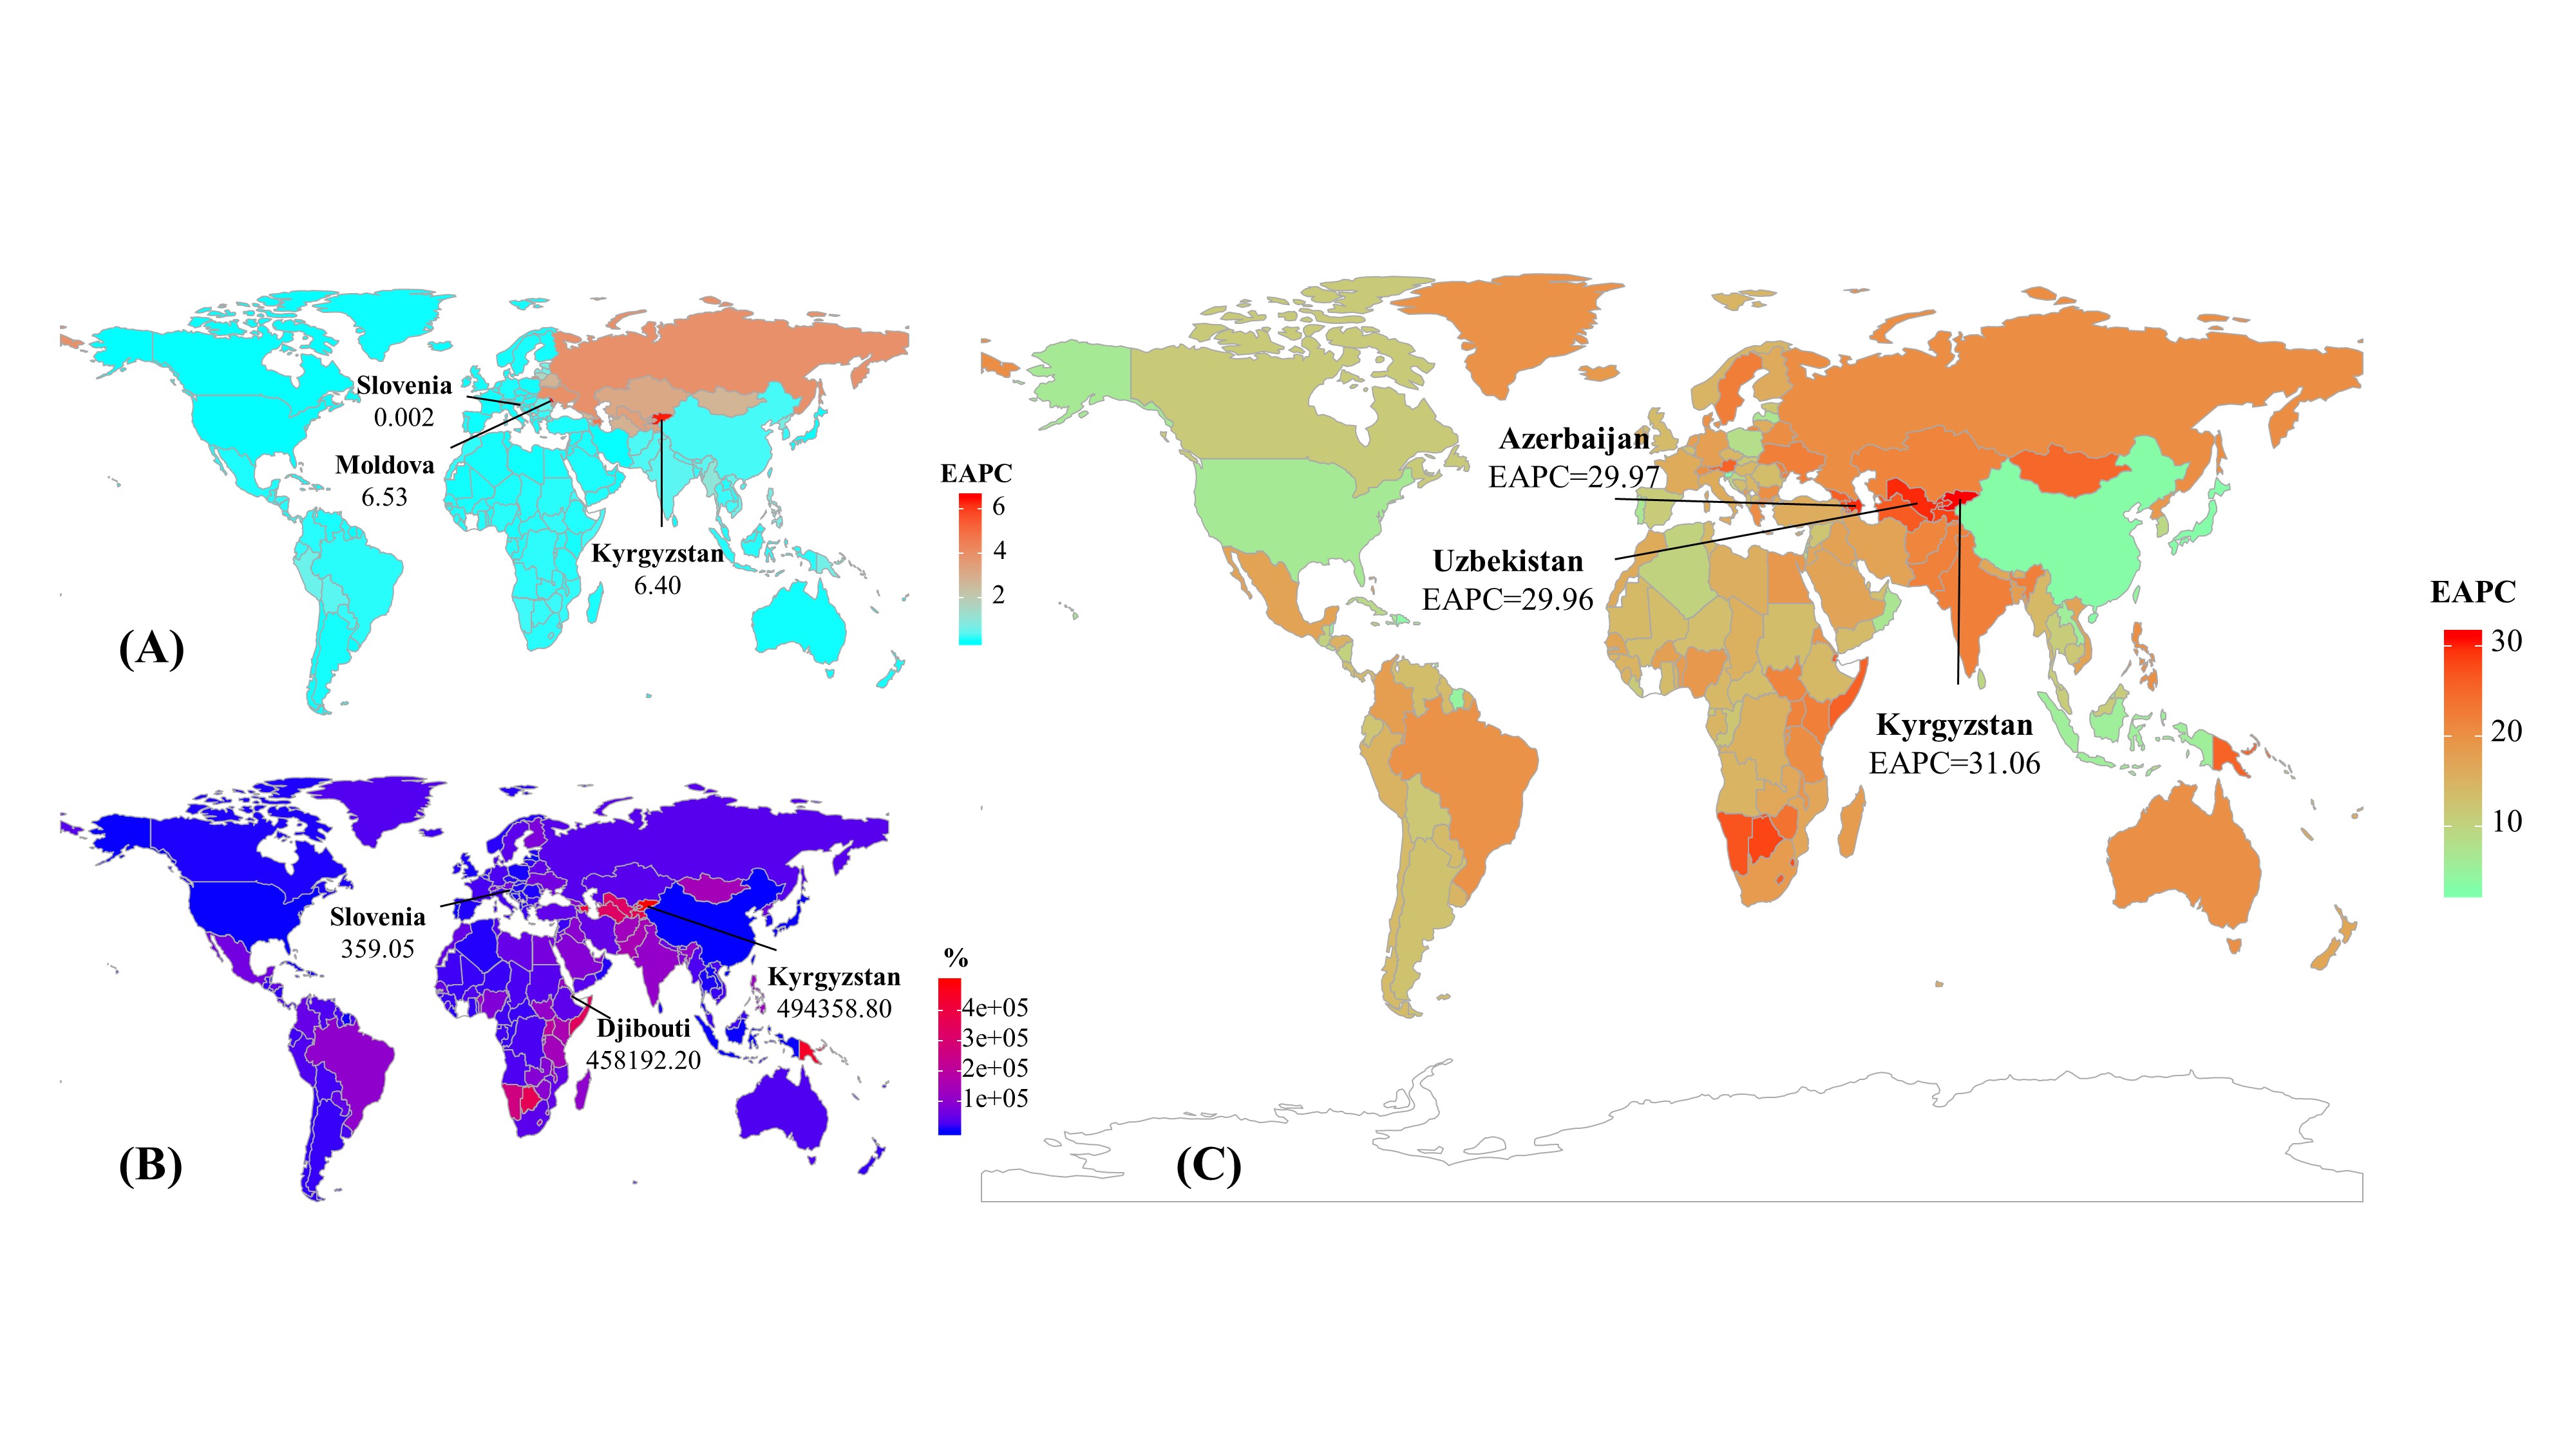
Globally, the incident cases of XDR-TB increased 5726.19% from 1991, and was 24.47 × 10³ (95% UI: 17.68–35 × 103) in 2017 (see web-only Supplementary Table S4). The ASIR of XDR-TB showed an increasing trend (EAPC = 11.74, 95% CI: 9.05 to 14.50) (see web-only Supplementary Table S4, Fig. 1). Increasing changes in the number of incident cases of XDR-TB were found across all age groups globally, especially in individuals aged between 50 and 69 years (Table S1, see web-only Supplementary Figure S2). Increasing trends in the ASIR for XDR-TB were observed stratifying cases by sex, SDI area, and geographic region from 1991 to 2017, and were particularly evident for the low and low-middle SDI areas, in which EAPCs were 20.30 (95%CI: 16.08 to 24.67) and 13.85 (95%CI: 11.12 to 16.65), respectively (see web-only Supplementary Table S4 and Supplementary Figure S2). Central Asia and Oceania had the most pronounced increasing trends, with the EAPCs of 25.46 (95%CI: 20.16 to 30.99) and 24.75 (95%CI: 21.57 to 28.02), respectively. Furthermore, the pronounced increasing trends in ASIR of XDR-TB were observed in 192 countries/territories, particularly Kyrgyzstan, Azerbaijan, and Uzbekistan, in which the EAPCs were 31.06 (95%CI: 25.44 to 36.93), 29.97 (95%CI: 24.53 to 35.66), and 29.96 (95%CI: 24.15 to 36.06), respectively (see web-only Supplementary Tables S4 and S5, and Supplementary Figure S4). No association was found between EAPCs and the ASIR in 1990, and the HDI in 2017 at a national level.
