3.1. Characteristics of testing sludges
The characteristics of testing sludges were given in Table 2. The moisture content was quite low as 45.5% as they were settled for some time at the dumping site. Initially, its moisture content could be up to 98% when they were dredged and pumped from the sewers into the trucks. The dredged sludge from sewers had neutral pH condition as the sewers received mostly domestic wastewater, rainwater and maybe some treated industrial wastewater. Besides, due to the urban combined drainage system receives lots of runoff water from the road surface, the sand accounted for majority in the composition (corresponding with highest SiO2 percentage ~ 72.8%) in the dredged sludge from sewers, while SiO2 concentration was less than 10% in sewage sludge in WWTP (Palermo and Hays 2013). With high inorganic composition, it is more logical to reuse the dredged sludges for the production of construction materials than for composting purpose.
Table 2
Characteristic of testing sludges
|
No
|
Parameters
|
Unit
|
Dredged sludge from sewers (DSS)
|
QCVN 43:2017/ BTNMT
|
|
1
|
Moisture content
|
%
|
45.5
|
-
|
|
2
|
pH
|
-
|
7.26
|
-
|
|
3
|
Compositions
|
|
|
-
|
|
4
|
- Sand
|
%
|
70.4
|
-
|
| |
- Limon
|
%
|
21.9
|
-
|
| |
- Clay
|
%
|
7.7
|
-
|
| |
Al2O3
|
%
|
7.97
|
-
|
|
5
|
Fe2O3
|
%
|
5.64
|
-
|
|
6
|
SiO2
|
%
|
72.86
|
-
|
|
7
|
CaO
|
%
|
6.86
|
-
|
|
8
|
MgO
|
%
|
2.65
|
-
|
|
9
|
Cl−
|
%
|
0.27
|
-
|
|
10
|
SO42−
|
%
|
1.07
|
-
|
|
11
|
Cu
|
mg/kg
|
72.86
|
197
|
|
12
|
As
|
mg/kg
|
50.8
|
17
|
|
13
|
Zn
|
mg/kg
|
1640.8
|
315
|
|
14
|
Cr
|
mg/kg
|
160.5
|
90
|
|
15
|
Cd
|
mg/kg
|
< 2
|
3.5
|
|
16
|
Pb
|
mg/kg
|
108.5
|
91.3
|
|
17
|
Total organic matters
|
%
|
12.3
|
-
|
|
18
|
Heat value
|
kCal/kg
|
1250
|
-
|
QCVN 43:2017/ BTNMT: National technical regulation on sediment quality
Furthermore, the dredged sludge from sewers was contaminated with heavy metals such as Zn, Cr, As and Pb. This could be due to the discharge of improperly-treated industrial wastewater into the urban combined drainage system. In terms of organic matters, the dredged sludge from sewers had shown a low concentration of 12.3%. This proved clearly the contrary characteristics of dredged sludge from sewers versus sewage sludge from WWTP. The one from WWTP normally contained higher organic matters (i.e., 20–60%) (Bozym and Siemiątkowski 2018; Ruimin et al. 2021) while the inorganic matters were limited.
3.2. Effect of additive blending on dewaterability
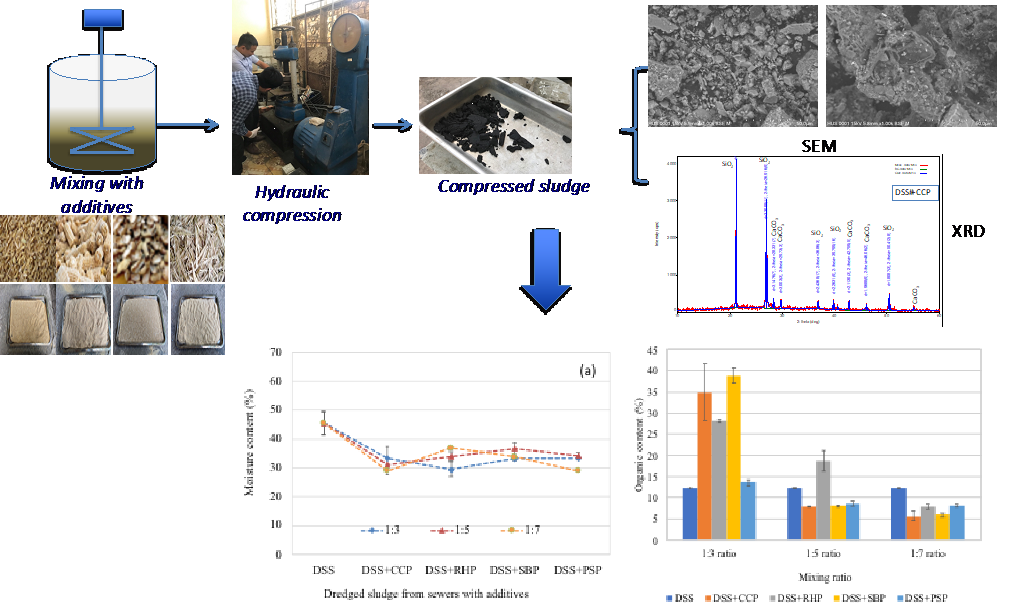
Fig 3 presents the effect of additive types and additive-sludge mixing ratio on the reduction of moisture contents of the testing sludges.
It is clearly seen from Fig. 3 that the blending with additives had substantial impacts on dewatering of dredged sludge from sewers. The moisture contents reduced up to 17% and mostly noticeable with corn core powders, followed by rice husk powder (Fig. 3a). This result was similar to the findings of previous studies (Liu et al. 2019; Guo et al. 2019; Wojcik 2019) even though they used sewage sludges from wastewater treatment plants. Their previous studies also observed a decrease of about 10%-15% in moisture content when mixing with these kinds of agro-wastes. The explanation was partly due to particle charge attraction. Normally, sludge particles were negatively charged, which exhibited mutual repulsion, resulted in a negatively charged stable colloid dispersion. After mixing with NaOH-modified additives, which were positively charged, the additives could play a role of electric neutralization and release of bound water from the dispersion (Guo et al. 2019). Moreover, during the reaction process between sludge particles and modified corn core powder, more bound water turned into free water phase, thus enhancing sludge dewatering.
When discussing about the impacts of these additives to sludge dewatering, some research mentioned about their skeleton building ability. Wallnut shell, as an example, was revealed to be a skeleton builder that formed the rigid skeleton and further increased the deep dewatering of the sludge (Liang et al. 2018). As explained previously, the selected additives had all rich in hemicelluloses, cellulose and lignin. For instance, rice husk contained 40% cellulose, 30% lignin, and 20% silica (Chindaprasirt and Cao 2015), peanut shell had 35.7% cellulose, 30.2% lignin, 18.7% hemicelluloses, and 5.9% ash content (Punnadiyil et al. 2016), while the main components of sugarcane bagasse were cellulose (46.0%), hemicellulose (24.5%), lignin (20.0%) (Hoang et al. 2021), and there were 26.5% cellulose, 13.6% lignin and other compounds in corn core (Xiaofen et al. 2018). Upon NaOH pretreatment, lignin and hemicelluloses were partly removed, the cellulose content and sample porosity, which were increased, were instrumental for the hydrolysis of the additives (Han et al., 2012). Thus, when mixing with the sludges, the additives can absorb water molecules from the dredged sludges more easily.
Due to dredged sludge with high silicate and low organic matters component, it was revealed that only minimal changes of moisture content were observed (Fig. 3b) after compression. In general, sludges with high organic matters tended to hold higher water content and will be more impacted with compression (Yang et al. 2021). With the purpose of reducing moisture as much as possible to meet the requirement for reuse as construction bricks, it can be initially concluded that the rice husk with mixing ratio of 1:5 was the best additive for dredge sludge from sewers, i.e., moisture content decreasing from 45.5±4.1% to 33.9±1.5% after blending and to 22.7±0.6% after compression.
Regarding to the influence of mixing ratio, there was no obvious impact of the additives on moisture content, except for rice husk powder (Fig. 3b). After compression, the additive blending showed even less influence. While the rice husk powder mixture obtained the best dewatering efficiency at 1:5 (equal to 200 mg/g dosage of rice husk led reduction of moisture contents from 45.75±4.12% to 22.69±0.12%), the remaining (corn core, sugarcane bagasse and peanut shell) mixtures showed the best dewatering performance with mixing ratio of 1:7. The results in this study achieved the better dewatering performance in comparison with previous study with sewage sludge mixing with rice husk additive revealed that increasing dosages of rice husk from 50, 100, 200, and 300 mg/g led to the reduction of moisture content from 72.9–63.4% (Liu et al. 2019). Therefore, the agro-waste additives helped enhance the dewatering performance of dredged sludge from sewers to certain extent, however, the enhancement efficiency was not necessarily proportional to the added quantity.
3.3. Effect of additive blending on organic matters
Organic matters were considered in this study as it relates to the potential application for calcined bricks, the sequential target of this research. Should the dredged sludges be reused for materials for calcined bricks, the organic matters as well as the thermal energy/heating values must be put in consideration. It was claimed that the high content of organic matter in raw sludge caused a decrease in mechanical strength and delay in hydration process (Chang et al. 2020). However, sludge with high content of organic matters can be considered potential fuel with its high calorific value (Zabaniotou and Theofilou 2008), which would be valued during the incineration for producing calcined bricks.
The testing sludges were dredged sludges from the urban combined drainage system, thus, they had some organic matters but at low level (about 12%). The additives employed to enhance the sludge dewatering in this study (corn core, rice husk, sugarcane bagasse and peanut shell) were agro-wastes that were rich in organic matters. As a result, possibly higher organic matters would be expected for the samples (Guo et al. 2019). Nevertheless, it was shown in Fig. 4 that the high mixing ratio of 1:3 for additive and sludge produced significant change in organic content (from 12±0.2% to 39±1.8% after mixing with sugarcane bagasse powder or to 35±6% after mixing with corn core powder). Lower mixing ratio of 1:5 or 1:7 did not increase the organic content in most cases. A trend of decrease in the organic content was observed when reducing the mixing ratio from 1:3, 1:5 and 1:7. In particular for the case of rice husk additive, the organic matters were about 10%, 20% and 30% for the mixing ratio with additives of 1:7; 1:5 and 1:3, respectively. Liang et al. (2018) indicated that the addition of walnut shell biomass significantly promoted the mixed fuel combustion characteristics. Although the presence of organic matters enhanced the combustion capability, they may lead to more µm-scale pores and large macro defects on the surface of brick. Despite these defects, the properties of all brick samples such as compressive strength, water absorption and freeze-thawing resistance still met the standard requirement of brick products (Zhang et al. 2016). Somehow, the porous and lighter bricks are indeed the development trend of construction bricks nowadays, to impose less impact on the building foundation.
3.4. Effect of additive blending on other physical and chemical characteristics
Selected redged sludge from sewers samples (good performance in moisture content reduction) were sent for physical and chemical examination. This was to evaluate the impact of additives on the sludge characteristics as materials for brick production.
Table 3
Physical and chemical characteristics of samples
|
No
|
Index
|
Unit
|
M1
|
M2
|
M3
|
M4
|
M5
|
M6
|
Standard
|
|
1
|
Al2O3
|
%
|
7.97
|
4.58
|
4.25
|
4.2
|
4.18
|
4.17
|
-
|
|
2
|
CaO
|
%
|
6.86
|
7.23
|
6.78
|
6.58
|
6.47
|
6.66
|
-
|
|
3
|
Fe2O3
|
%
|
5.64
|
2.74
|
2.97
|
2.89
|
2.84
|
2.9
|
-
|
|
4
|
K2O
|
%
|
1.95
|
3.33
|
2.91
|
1.92
|
1.88
|
2.72
|
-
|
|
5
|
MgO
|
%
|
2.65
|
1.24
|
1.2
|
1.07
|
1.02
|
1.39
|
-
|
|
6
|
MnO
|
%
|
0.14
|
0.04
|
0.04
|
0.04
|
0.04
|
0.04
|
-
|
|
7
|
P2O5
|
%
|
1.25
|
0.87
|
0.82
|
0.8
|
0.93
|
0.95
|
-
|
|
8
|
TiO2
|
%
|
0.68
|
0.38
|
0.35
|
0.2
|
0.29
|
0.42
|
-
|
|
9
|
SiO2
|
%
|
72.86
|
79.59
|
80.68
|
82.3
|
82.35
|
80.75
|
-
|
|
10
|
Ag
|
mg/Kg
|
< 2
|
< 2
|
< 2
|
< 2
|
< 2
|
< 2
|
-
|
|
11
|
As
|
mg/Kg
|
50.8
|
31.2
|
34
|
33.5
|
32.8
|
35.1
|
17
|
|
12
|
B
|
mg/Kg
|
62.4
|
25.2
|
30
|
31.1
|
30.3
|
40.8
|
-
|
|
13
|
Ba
|
mg/Kg
|
650.5
|
328
|
370.5
|
374.2
|
369.7
|
430.9
|
-
|
|
14
|
Be
|
mg/Kg
|
< 5
|
< 5
|
< 5
|
< 5
|
< 5
|
< 5
|
-
|
|
15
|
Bi
|
mg/Kg
|
< 10
|
< 10
|
< 10
|
< 10
|
< 10
|
< 10
|
-
|
|
16
|
Cd
|
mg/Kg
|
< 2
|
< 2
|
< 2
|
< 2
|
< 2
|
< 2
|
3.5
|
|
17
|
Ce
|
mg/Kg
|
65.7
|
35.7
|
44.4
|
45.8
|
44.7
|
48.2
|
-
|
|
18
|
Co
|
mg/Kg
|
120.8
|
18.5
|
22.1
|
23.2
|
22.9
|
32.5
|
-
|
|
19
|
Cr
|
mg/Kg
|
160.5
|
140.8
|
171.1
|
175.2
|
171.6
|
180.1
|
90
|
|
20
|
Cu
|
mg/Kg
|
168.2
|
70.6
|
83.7
|
85.7
|
84.3
|
90.8
|
197
|
|
21
|
Ga
|
mg/Kg
|
< 10
|
< 10
|
< 10
|
< 10
|
< 10
|
< 10
|
-
|
|
22
|
Ge
|
mg/Kg
|
< 20
|
< 20
|
< 20
|
< 20
|
< 20
|
< 20
|
-
|
|
23
|
La
|
mg/Kg
|
40.4
|
17.2
|
23.2
|
24.3
|
22.8
|
27.4
|
-
|
|
24
|
Li
|
mg/Kg
|
52.1
|
23.4
|
29
|
29.8
|
28
|
32.7
|
-
|
|
25
|
Mo
|
mg/Kg
|
< 5
|
< 5
|
< 5
|
< 5
|
< 5
|
< 5
|
-
|
|
26
|
Nb
|
mg/Kg
|
13.5
|
5.5
|
6.2
|
6.4
|
6.1
|
6.5
|
-
|
|
27
|
Ni
|
mg/Kg
|
78.2
|
60.1
|
73.4
|
75
|
72.7
|
75.1
|
-
|
|
28
|
Pb
|
mg/Kg
|
108.5
|
62.4
|
80.1
|
82.4
|
80.6
|
83.8
|
91.3
|
|
29
|
Sb
|
mg/Kg
|
23.1
|
14.5
|
18.1
|
19.2
|
18.8
|
19.2
|
-
|
|
30
|
Sc
|
mg/Kg
|
8.5
|
6.2
|
6.9
|
7.1
|
6.8
|
7.2
|
-
|
|
31
|
Sn
|
mg/Kg
|
< 10
|
< 10
|
< 10
|
< 10
|
< 10
|
< 10
|
-
|
|
32
|
Sr
|
mg/Kg
|
165.2
|
155.8
|
210
|
214.2
|
210.5
|
215.2
|
-
|
|
33
|
Ta
|
mg/Kg
|
< 10
|
< 10
|
< 10
|
< 10
|
< 10
|
< 10
|
-
|
|
34
|
V
|
mg/Kg
|
88.8
|
48.9
|
61.8
|
62.8
|
60.6
|
63.6
|
-
|
|
35
|
W
|
mg/Kg
|
50.3
|
30.7
|
39.2
|
41
|
40.3
|
40.8
|
-
|
|
36
|
Y
|
mg/Kg
|
25.7
|
9.4
|
12.5
|
13.2
|
12.7
|
13.4
|
-
|
|
37
|
Zn
|
mg/Kg
|
1640.8
|
485.6
|
630.6
|
635.7
|
630
|
650.1
|
315
|
| Note: M1: raw DSS; M2: DSS + RHP (1:5); M3: DSS + RHP (1:7); M4: DSS + CCP (1:7); M5: DSS + PSP (1:7); M6: DSS + SBP (1:7). (DSS: Dredged sludge from sewers; CCP: corn core powder, RHP: rice husk powder, SBP: sugarcane bagasse powder, and PSP: peanut shell powders) |
| Standard: QCVN 43:2017/ BTNMT – National technical regulation in sediment quality. “-“: Not applicable. |
The changes in physical and chemical characteristics can be seen clearly in Table 3. In terms of oxide components, most of them decreased in concentration (%), except for SiO2. The same trend was observed for the case of heave metals, except for Sr and Cr. Certainly, the decrease varied with different additives. Because the additives are mostly organic matters, the inorganic concentrations were reduced within the same volume of samples. Moreover, the additives also reduced heavy metal concentrations in dredged sludge from sewers up to 70%, 58% and 42% for the cases of Zn, Pb and Cu, respectively due to their heavy metal adsorption abilities (Nguyen et.al. 2019; Hoang et.al. 2019 ). The sludge samples blended with rice husk powder (ratio of 1:5) showed consistently the lowest concentration of heavy metals compared with the remaining additives. With the same blending ratio of 1:7, the rice husk and peanut shell powders proved to be more impact than the baggage and corn core powders in term of heavy metals reduction. Besides, the sludge samples blended with rice husk powder (ratio of 1:5) also had the highest moisture reduction (17%) when comparing the moisture content of raw sludge and mixed sludge after compression. Furthermore, the composition of rice husk mixed sample had the highest content of Al2O3 and CaO, which had high potential of water absorption.
In comparison with the Vietnamese national standard for sediment quality, the presence of heavy metals was still higher than the accepted values mostly. Nevertheless, if the modified dredged sludge from sewers was reused for making calcined brick, it would be recommended to mix maximum 30% by weight of dredged sludge from sewers with clay (Hoang and Nguyen 2017). Thus, the heavy metals would be three times less in concentration in the final brick products, which means their presence in the bricks would be in acceptable range and cause no harm to the environment and human being.
3.5. SEM and XRD results of blended sludges
As mentioned above, selected sludge samples (good performance in moisture reduction) were sent for SEM and XRD examination to see the impact of additives on dewatering.
It can be seen from Fig. 5 that with the same magnification of 1000 times, the surface morphology of sludges before and after treatment was completely different. The additives seemed to bind the sludge and make many big aggregates, leaving more pores on the surface. The pores showed clearest for the case of sludge blended with sugarcane bagasse powder, followed by the ones blended with peanut shell powder and corn core powder. The surface of raw sludge was smoother with tiny particles. It was similar to the findings of Guo et al. (2019); Xiong et al. (2017). They observed small particles in the raw sludge and those tiny sludge particles became large flocs through re-agglomerate, leaving porous and rough surface with macro pores and voids in the treated sludge. The tiny particles were probably inorganic debris (Guo et al. 2018) while the big agglomerates were mostly due to organic agro-waste additives. Even though these agro-wastes were claimed to be skeleton builders and made the sludge more porous after mixing, only in this study, they can be seen clearly different performances under the same condition. While they explained the porous surface formed channels for the outflow of the bound water from sludge, another possible mechanism was suggested, i.e. water absorption ability. Apparently that the additives have absorbed water which made the sludge drier. Bound water from the sludge solids was broken and absorbed by the additives, then released faster after compression. The mechanism can be illustrated in Fig. 6.
In consideration of XRD images, which was used to identify the mineralogical compounds and crystalline phase present in the samples, Fig. 7 rendered different peaks showing the alternation of sludge particle’s surface when mixing with the additives. The major peaks obtained were identified as quartz (SiO2) and they were shown in all samples. It was consistent with the results on main component of sludges (Table 2). For the sludge without additive (DSS), the major peaks were quartz and iron phosphate. This makes sense as Fe2O3, Al2O3 and CaO were dominant oxides besides quartz in DSS’s characteristics (as seen Table 2). For the sample added with rice husk powder, there was occurrence of Li, Mn, Fe besides quartz. The major peaks, identified in sample with peanut shell powder, were the complex of NH4+, Si and F. For the case of sugarcane bagasse-DSS sample, CaO and K2O were found. It seemed that some elements of additives, indicated in studies of Viruthagiri et al. (2011); Hoang et al. (2020); Ma et al. (2016); Punnadiyil et al. (2016), had deposited on the sludge surface via examination with XRD.
3.6. Statistical analysis
This section will analyze the impact of both types of additives (corn core, rice husk, peanut shell and sugarcane bagasse) and mixing ratio of sludge and additives (1:3, 1:5 and 1:7) in the reduction of moisture contents (MC) after mixing and after compression. The two-way ANOVA from software StatPlus:mac LE v7.3.31 (AnalystSoft Inc., USA) was employed for this purpose. Table 5 presents the analytical results of two-way ANOVA.
Table 5
Two-way ANOVA results (p value, n = 26) showing the impact on MC by different additives and mixing ratio.
| |
|
After mixing
|
After compression
|
|
General interaction
|
| |
Type of additives (A)
|
0.00003
|
0.00853
|
| |
Mixing ratio (B)
|
0.26849
|
0.04167
|
| |
A x B
|
0.0044
|
0.01323
|
|
Detailed interaction according to Tukey-Kramer method
|
|
Type of additives (A)
|
Mixing ratio (B)
|
|
|
|
Sugarcane bagasse
|
(1) vs (2)
|
0.14379
|
0.07988
|
| |
(1) vs (3)
|
0.95277
|
0.73252
|
| |
(2) vs (3)
|
0.22817
|
0.02087
|
|
Peanut shell
|
(1) vs (2)
|
0.82725
|
0.99931
|
| |
(1) vs (3)
|
0.06475
|
0.57401
|
| |
(2) vs (3)
|
0.02277
|
0.59637
|
|
Corn core
|
(1) vs (2)
|
0.45141
|
0.69127
|
| |
(1) vs (3)
|
0.06844
|
0.00669
|
| |
(2) vs (3)
|
0.45141
|
0.02952
|
|
Rice husk
|
(1) vs (2)
|
0.04961
|
0.01427
|
| |
(1) vs (3)
|
0.00255
|
0.92317
|
| |
(2) vs (3)
|
0.25190
|
0.02827
|
Note: Mixing ratio 1:3 (1); 1:5 (2) and 1:7 (3), p < 0.05: significant impact
It was clearly shown in the Table 5 that each factor had significant impact on the MC either after mixing or after compression. For each individual additive, the impact was shown the most with rice husk powder (p < 0.05). Specifically, different mixing ratios of rice husk with dredged sludge from sewers would lead to substantial reduction on moisture content, which confirms in the Fig. 3a above.