Growth performance
The initial body weight (5.47 ± 0.17 kg) of two groups’ pigs was comparable at the beginning of this study. After 7 days lincomycin exposure, the body weight was approximately 5.42% or 9.23% lower than the Con group pigs on day 14 (p = 0.0450) or day 28 (p = 0.0362) (Fig. 1C). Besides, lincomycin exposure attenuated the average daily feed intake (Fig. 1B).
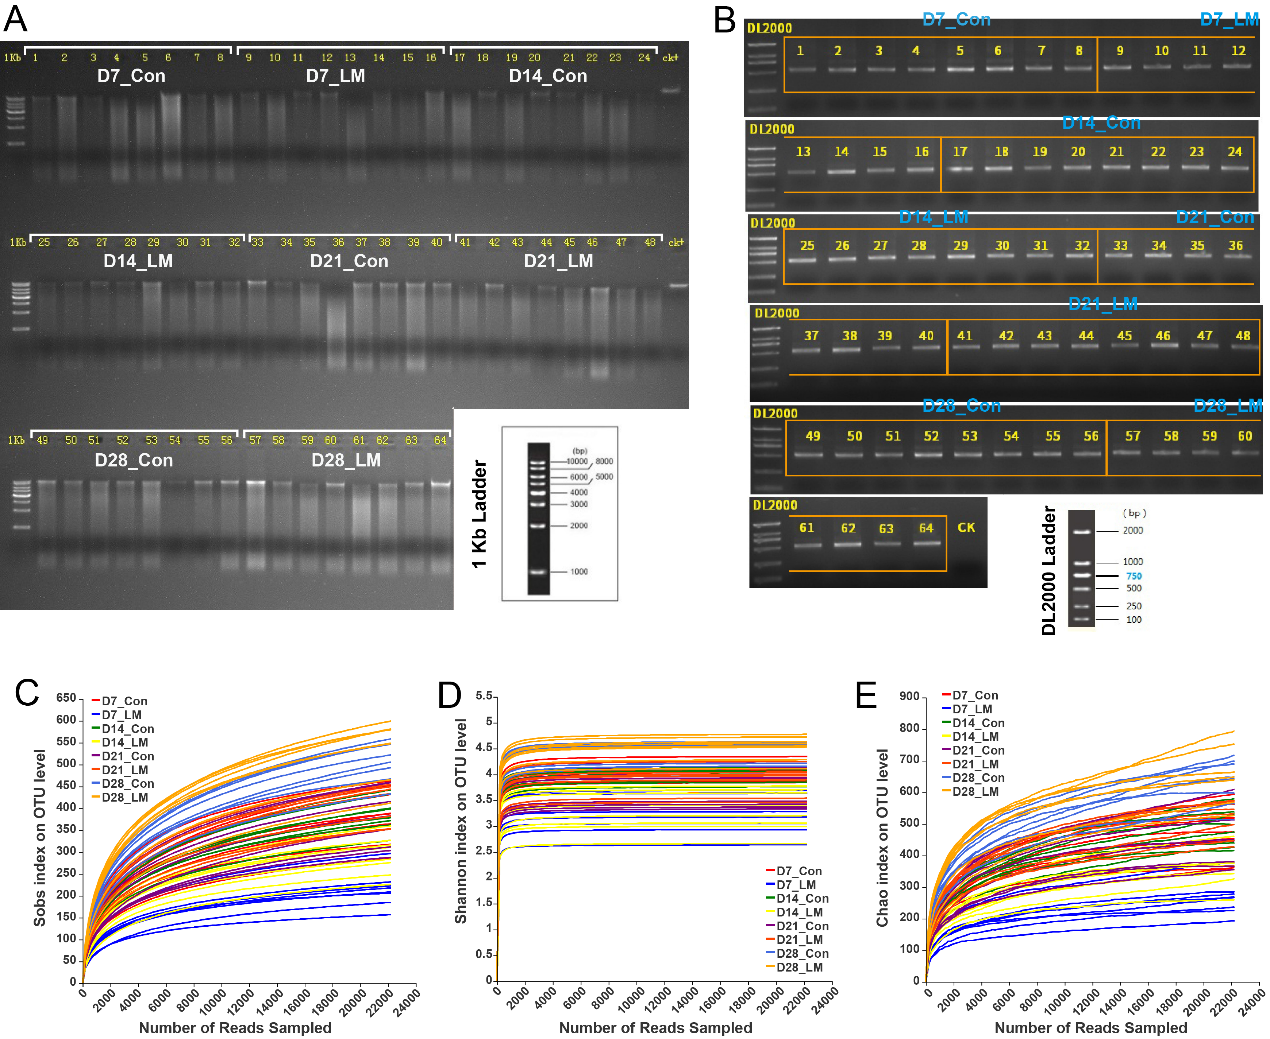
Evaluation of sequencing data
A total of 2355031 valid sequences from 64 feces samples were obtained with sequences ranging from 22225 to 53516 per sample after assembling and quality filtering. The normalized depth of 22225 reads based on the minimum number of sample sequences was clustered into 1109 OTUs for all samples at a 97% sequence similarity value, further clustered into 239 genera, 96 families, 55 orders, 23 classes and 15 phyla. The excellent coverage (> 0.999) and rarefaction curves (Fig. S1C-E) indicated that most of the microbial diversity and bacterial communities in feces samples had been sufficiently captured.
Variation in alpha-diversity
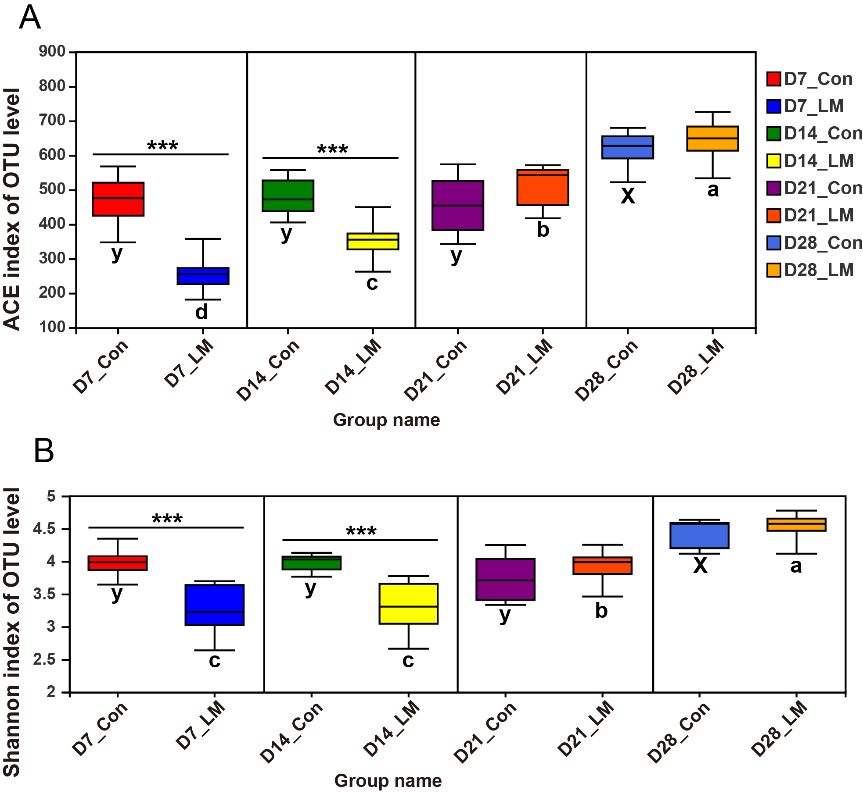
Alpha-diversity is presented in Fig. 2 and Fig. S2. The results showed that the microbial alpha-diversity (including Sobs, Chao, ACE and Shannon indexes) in piglet feces did not change on the first three weeks of nursery period (p > 0.05), whereas the alpha-diversity (Sobs, p < 0.0001; Chao, p = 0.0002; ACE, p = 0.0003; Shannon, p < 0.0001) notably rose on the fourth week of nursery period (Fig. 2A-B and Fig. S2A-B). One-week lincomycin exposure enormously decreased the microbial alpha-diversity (including Sobs, Chao, ACE and Shannon indexes) in piglet feces (p < 0.0001), and the lower Sobs, Chao, ACE and Shannon indexes were still observed after one week on cessation of lincomycin exposure (p < 0.0001) (Fig. 2A-B and Fig. S2A-B). Yet no alterations of microbial alpha-diversity (including Sobs, Chao, ACE and Shannon indexes) in feces between LM group pigs and Con group pigs were found after two weeks or three weeks on cessation of lincomycin exposure (p > 0.05, Fig. 2A-B and Fig. S2A-B). After termination of lincomycin exposure, the Sobs, Chao, ACE and Shannon indexes of fecal microbiota in LM group pigs gradually ascended with the time passing and reached a significant level (p < 0.05, Fig. 2A-B and Fig. S2A-B).
Variation in beta-diversity
The PCoA results based on the Bray-Curtis distance and ANOSIM test at OTU level revealed that community structure of fecal microbiota was no clear difference on the first three weeks of pig nursery period, but distinct microbial community on the fourth week of nursery period was formed (R = 0.4385, p < 0.0010, Fig. 3B and A). Compared with Con group pigs, one-week lincomycin-exposed pigs exhibited a distinct cluster in feces microbiota (R = 0.5123, p < 0.0010, Fig. 3D and A). Even on the first (R = 0.6295, p < 0.0010, Fig. 3E and A), second (R = 0.5020, p < 0.0010, Fig. 3F and A) and third weeks (R = 0.6052, p < 0.0010, Fig. 3G and A) of cessation of lincomycin exposure, the fecal microbiota of the two groups still demonstrated two notably distinct cluster. After termination of lincomycin exposure, the community structure of fecal microbiota in LM group pigs gradually shifted with the time passing and reached a significant level (R = 0.6779, p < 0.0010, Fig. 3C and A).
Comparison of microbial composition at phylum and genus levels
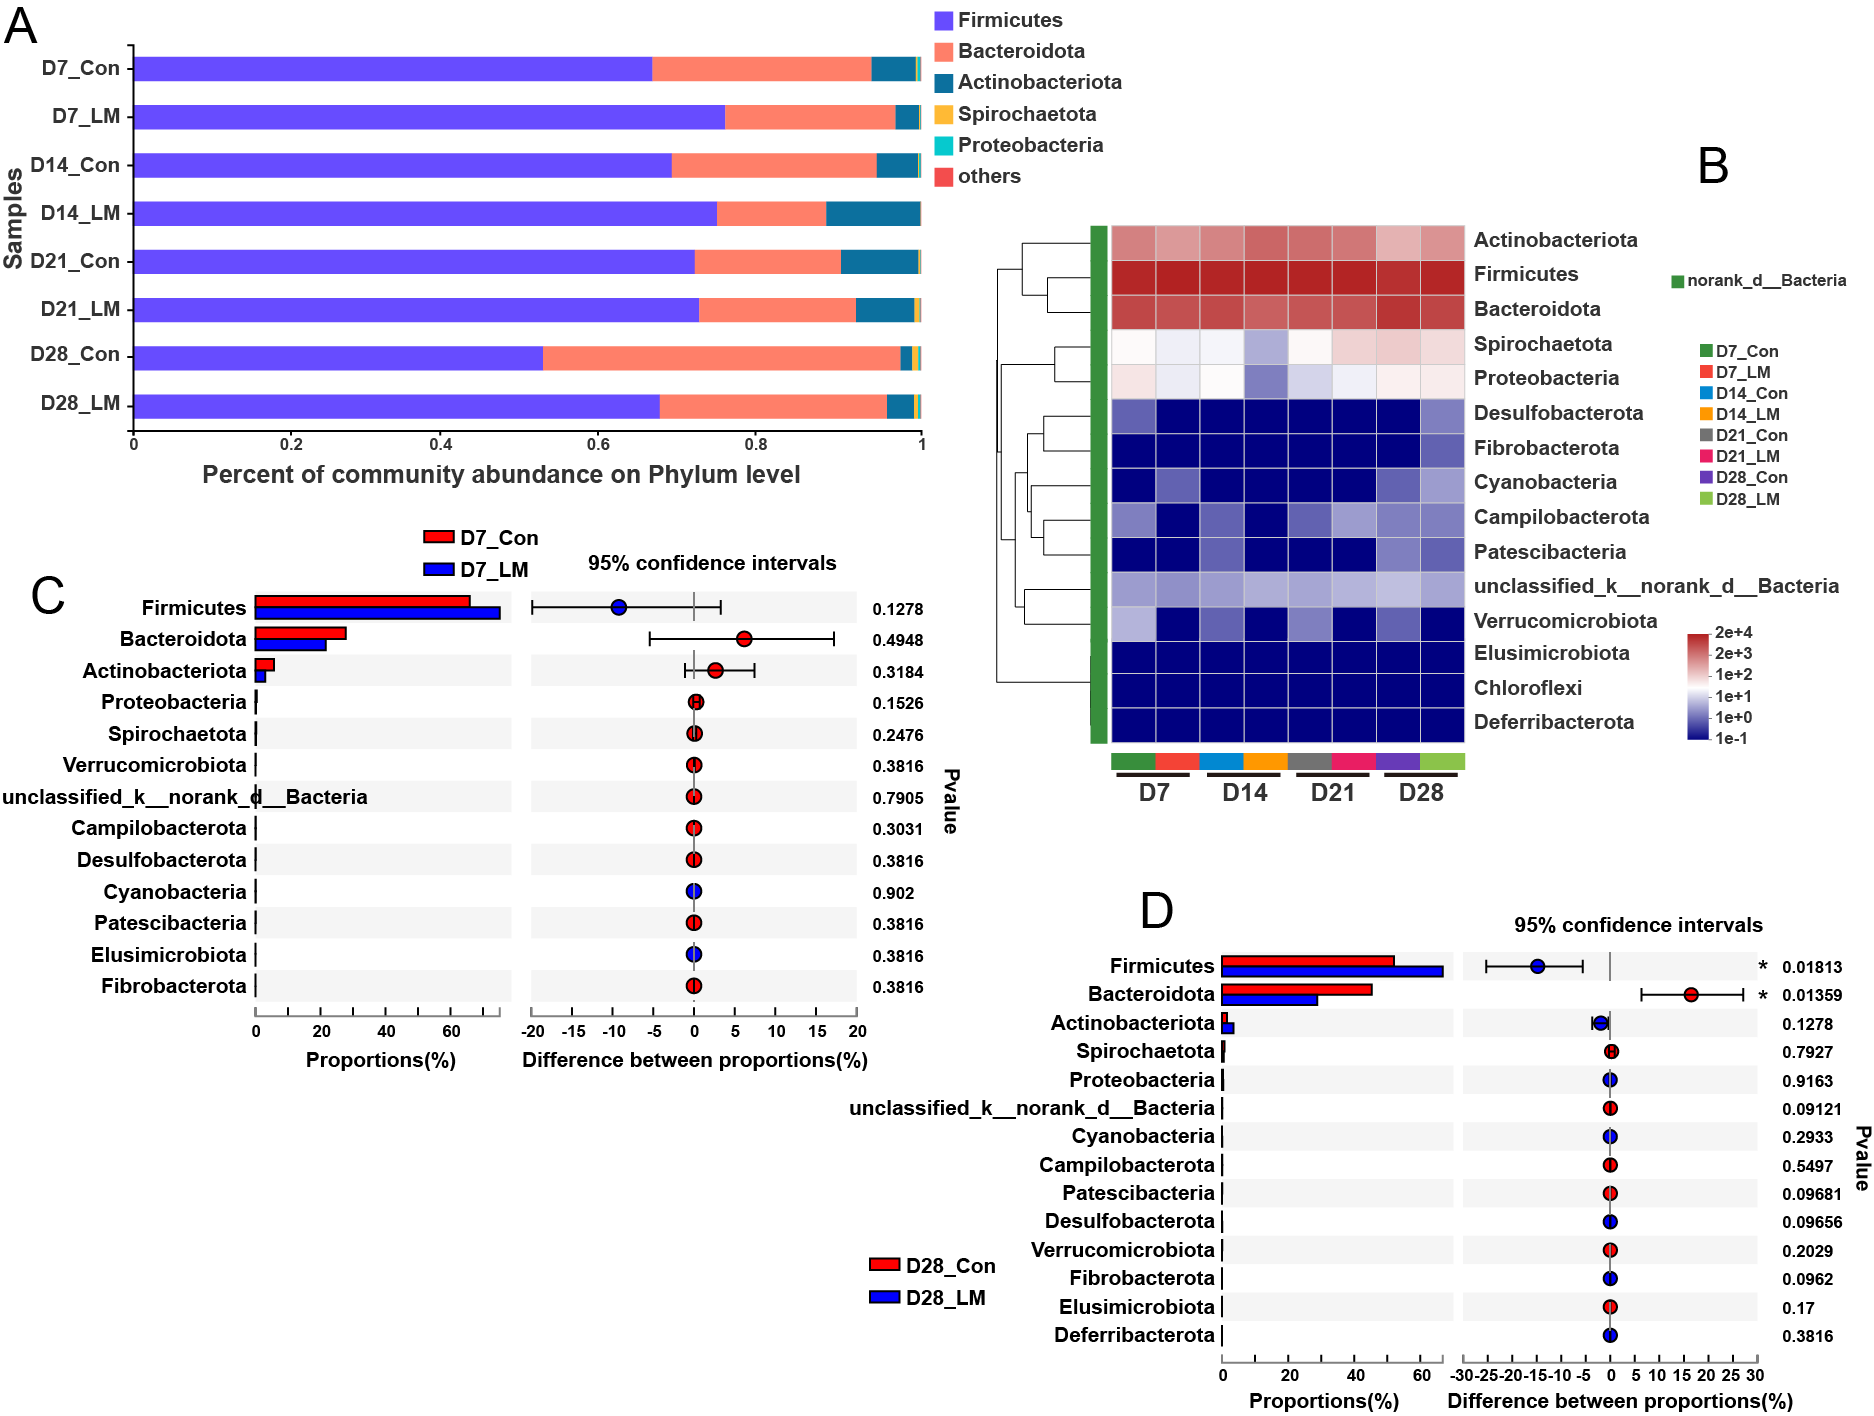
At phylum level, most abundant phyla were Firmicutes and Bacteroidota, which consists of more than 90% of total phyla with Actinobacteriota in fecal microbiota (Fig. S3A). One-week lincomycin exposure increased the relative abundance of Firmicutes and decreased Bacteroidota in fecal microbiota, but none of them reached a significant level (p > 0.05, Fig. S3A-C). The increment of Firmicutes ((p = 0.0181) and decrement of Bacteroidota ((p > 0.0136) were still observed on the third week after the termination of lincomycin exposure, which reached a significant level (Fig. S3A-B and D).
At genus level, the top ten abundance genera in pig feces were Prevotella, Clostridium_sensu_stricto_1, Subdoligranulum, Blautia, Ruminococcus_torques_group, Prevotellaceae_NK3B31_group, norank_f_muribaculaceae, norank_f_norank_o_Clostridia_UCG-014, Olsenella and Terrisporobacter, which consists of ~50% of total genera (Fig. 4A). The alterations of top 50 genera in relative abundance attracted more attention. Some relative abundance of genera notably modified after one-week lincomycin exposure, but those genera restored normal mass after three weeks on cessation of lincomycin exposure (e.g., norank_f_Butyricicoccaceae, norank_f_Ruminococcaceae, Catenibacterium, Catenisphaera, Etc.; Fig. 4A-B). Although another part of genera did not alter after lincomycin exposure, the relative abundance of those genera was varied remarkably after three weeks on the termination of lincomycin exposure (e.g., Ruminococcus_torques_group, norank_f_Muribaculaceae, Olsenella, Prevotella, Lachnospiraceae_NK4A136_group; Fig. 4A-B). The relative abundance of most genera obviously diminished due to the lincomycin exposure, among which most of those genera achieved augment level (e.g., Clostridium_sensu_stricto_1, Terrisporobacter, Collinsella, UCG-0058, etc.; Fig.4 A-C) and others still did not return to normal abundance (e.g., norank_f_norank_o_Clostridia_UCG-014, Lactobacillus, Faecalibacterium, unclassified_f_Prevotellaceae, Etc.; Fig. 4A-C) after three weeks on cessation of lincomycin exposure. Besides, some bacterial genera always remained high relative abundance after lincomycin exposure and three weeks on end of lincomycin exposure (e.g., Blautia, norank_f_Eubacterium_coprostanoligenes_group, UCG-002, Ruminococcus, etc.; Fig. 4A-B).
Alteration of specific microbiota
LEfSe was employed to identify the specific taxa at genus level in the fecal microbiome that was notably associated with lincomycin exposure and the threshold of LDA score was 3.0. A total of 26, 43, 28 or 31 microbiotas were identified in feces of pigs exposed to lincomycin on day 7, 14, 21 or 28, respectively (genus level, LDA score > 3, Supplementary file 1, Fig. 5A and 6A). The top five abundant microbiotas of identifies taxa in feces on day 7 were Blautia (6.3%), Prevotellaceae_NK3B31_group (4.43%), Lactobacillus (4.30%), Clostridium_sensu_stricto_1 (4.09%) and Coprococcus (2.51%) (Fig. 5C). As shown in Fig. 5A-B, most abundant microbiotas of identified taxa at genus level remarkably declined after one-week lincomycin exposure, among which ten microbiotas (Agathobacter, Megasphaera, Phascolarctobacterium, Succinivibrio, Mitsuokella, Enorma, Terrisporobacter, Clostridium_sensu_stricto_1, Clostridium_sensu_stricto_6 and norank_f_Oscillospiraceae) with a 10-fold decrement were observed. In contrast, a small number of bacteria with a significant increase in relative abundance varied from 3.4 to 8.4-fold, whereas the augmented level of Enterococcus was more than 40 times. More than 80% of altered microbiotas in feces on day 7 were derived from Firmicutes phylum, and most of them were from Clostridia class (Fig. 5B).
The most abundant microbiota of identified taxa were Prevotella (28.72%), Clostridium_sensu_stricto_1 (5.29%) and Lactobacillus (4.93%), which consists of ~50% of total microbiotas at genus level with Agathobacter (3.62%), unclassified_f_Prevotellaceae (2.02%), norank_f_Muribaculaceae (1.56%), Terrisporobacter (1.42%), unclassified_f_Lachnospiraceae (1.32%) and Alloprevotella (0.91%) on day 28 of whole trial (Fig. 6C). After three weeks on cessation of lincomycin exposure (day 28), only the relative abundance of two microbiotas (Eubacterium and Christensenellaceae_R-7_group) ascended by more than 10-fold, and other identified bacteria varied from 1.2-fold to 7.12-fold (Fig. 6A-B). After filtering out the bacteria with an abundance of less than 0.1% among the identified differential bacteria, we observed that 10 bacteria in the feces of lincomycin-exposed pigs were potentially beneficial bacteria (most of them were SCFA producers), included 5 down-regulated genera (Agathobacter, Prevotella, Mitsuokella, Prevotellaceae_UCG-001 and Lactobacillus) and 5 up-regulated genera (Eubacterium, norank_f_Muribaculaceae, Romboutsia, unclassified_f_Lachnospiraceae and Christensenellaceae_R-7_group) (Fig. 6B). Besides, 6 pathogenic microbiotas (Oscillospira, Terrisporobacter, Negativibacillus, Clostridium_sensu_stricto_1, Alistipes and Alloprevotella) were remarkably altered at genus level in the feces after three weeks on cessation of lincomycin exposure (day 28, Fig. 6B). Approximate 90% of altered microbiotas in feces on day 28 were derived from Firmicutes (71%) and Bacteroidota (19%) phylum, and most of them were from Clostridia (58%) and Bacteroidia (19%) class (Fig. 6B).
The nonparametric test was utilized to further analyze the alterations of the well-recognized and relatively high abundant bacteria at each time point. One-week lincomycin exposure noticeably reduced the relative abundance of Terrisporobacter and Clostridium_sensu_stricto_1 (p < 0.001), whereas the relative abundance remarkably ascended on day 14, 21 and 28 with lincomycin exposure ceased (p < 0.05) (Fig. 6D). Besides, one-week lincomycin exposure augmented the relative abundance of Escherichia-Shigella (p = 0.0339) and Negativibacillus (not reach statistical significance level), and the upward trend of these two bacteria had decreased in the first week after the termination of lincomycin exposure; the relative abundance of Escherichia-Shigella and Negativibacillus descended in the second week after stopping lincomycin exposure, but the decline of those two bacteria notably reversed in the third week with lincomycin exposure ceased (p < 0.01) (Fig. 6D). The diminished Lactobacillus and Agathobacter were obviously observed after one-week lincomycin exposure (p < 0.05), and the attenuated abundance of these two bacteria continued until the third week on cessation of lincomycin exposure (Fig. 6D).
Predicted function of microbiota analysis
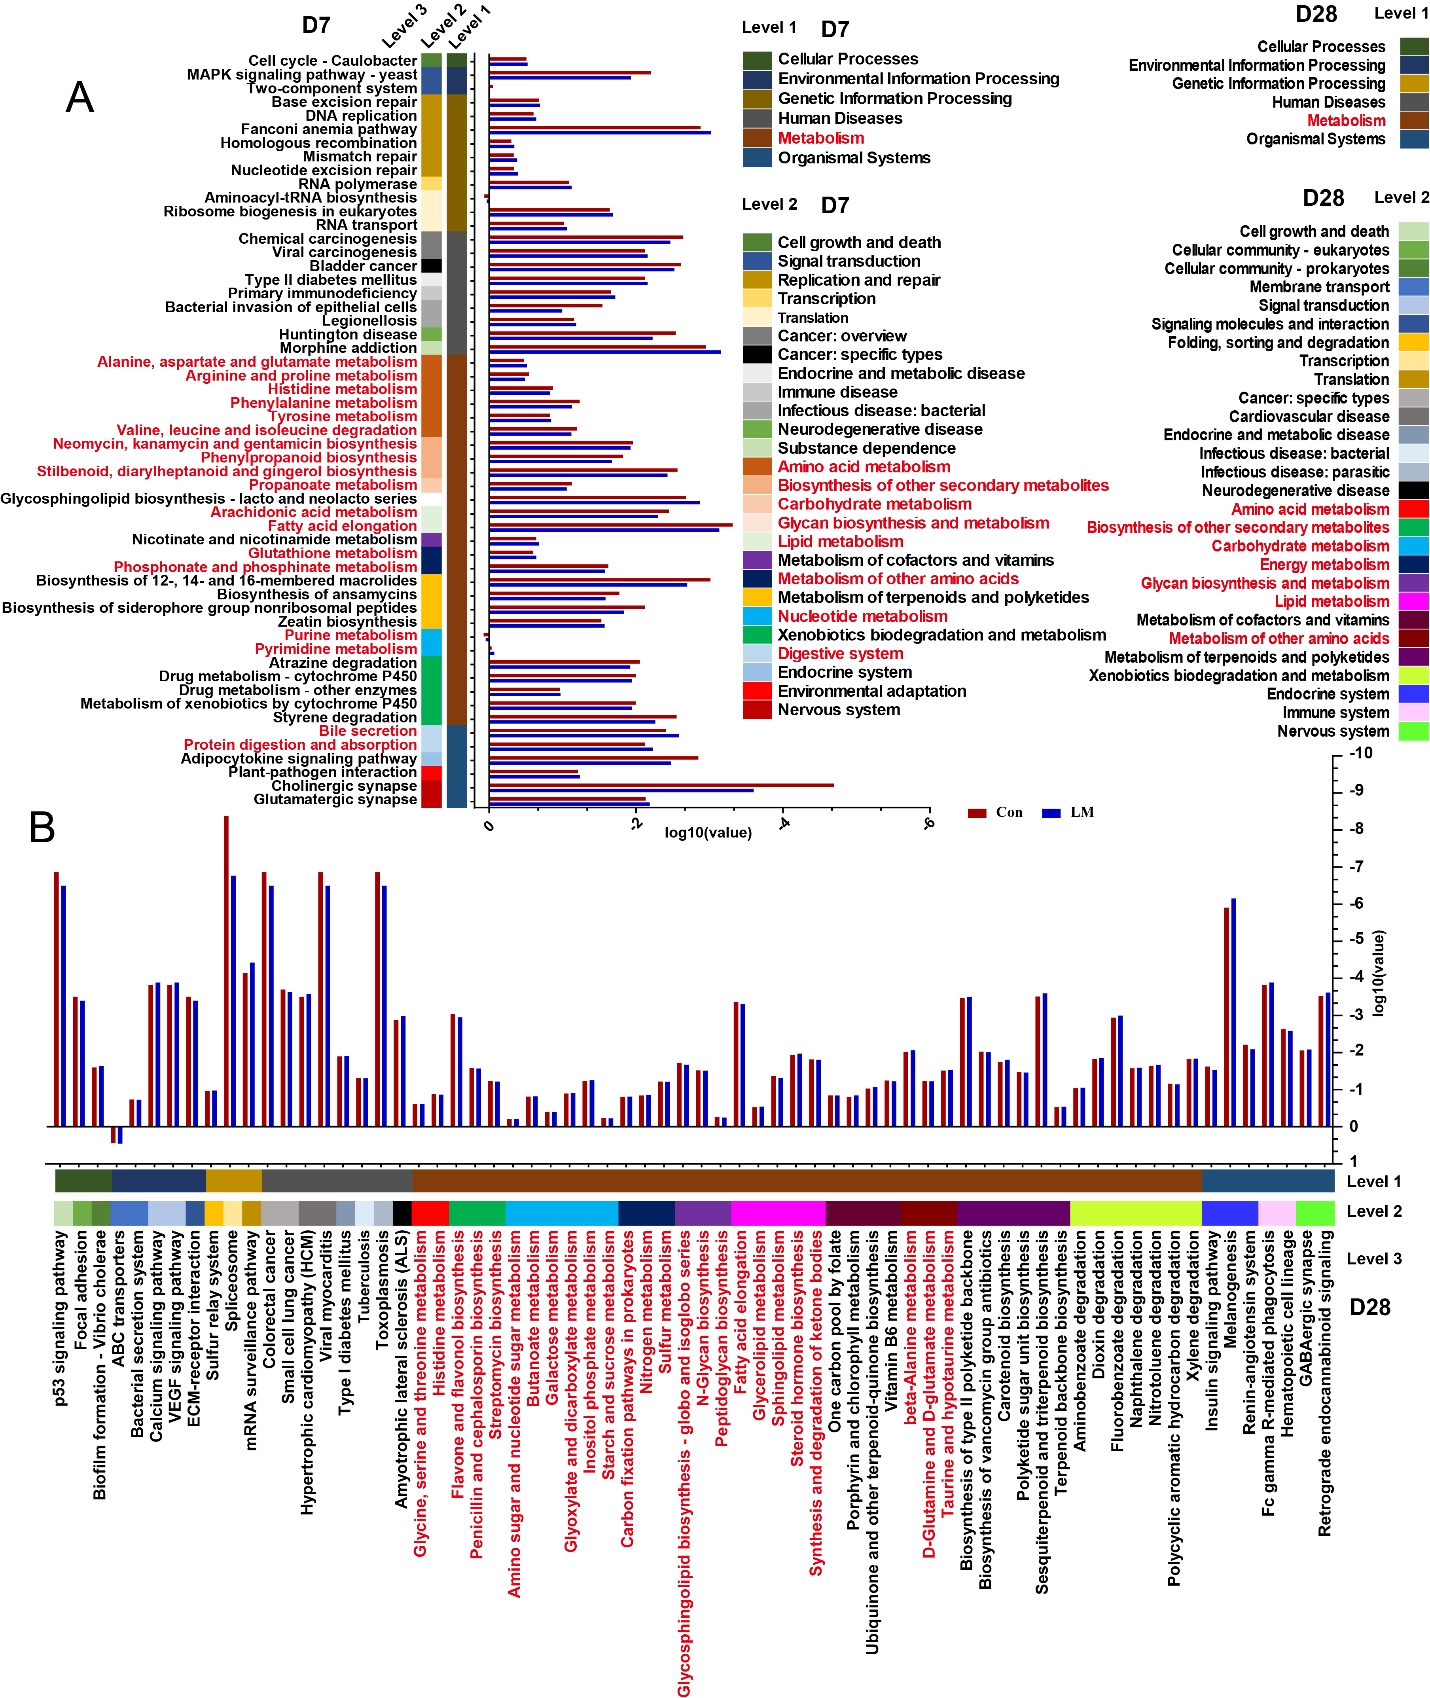
To better comprehend the effect of lincomycin exposure on fecal microbiota in pigs, Tax4Fun analysis was used to predict the functional role of altered microbiota in feces. The results of predicted function demonstrated that 55, 4, 5 or 68 functional pathways at level 3 were obviously altered between LM and Con group pigs on day 7, 14, 21 or 28, respectively (p < 0.05, Supplementary file 2). The relative abundances of genes involved in metabolism-related pathways were noticeably altered after one-week lincomycin exposure (day 7), such as amino acid metabolism (e.g., alanine, arginine, histidine, valine, glutathione, etc.), carbohydrate metabolism, lipid metabolism, nucleotide metabolism (e.g., purine and pyrimidine), protein digestion and absorption (Fig. S4A, Supplementary file 2). Carbohydrate metabolism-related pathways or lipid metabolism-related pathways were regulated in the first or second week on cessation of lincomycin exposure (Supplementary file 2). In contrast, we observed that metabolism-related pathways, such as amino acid metabolism, carbohydrate metabolism, energy metabolism, and lipid metabolism, were remarkably regulated in third week with lincomycin exposure ceased (Fig. S4B, Supplementary file 2).
Short-fatty acid production
Based on the changes of fecal microbiota, further investigation of SCFA quantification on different time points after one-week lincomycin exposure was completed and depicted in Fig. 7. One-week lincomycin exposure did diminish the concentration of acetate (p = 0.0391), valerate (p < 0.0001), isovalerate (p = 0.0079), isobutyrate (p = 0.0060), total SCFA (p = 0.0162) and decreased trend in butyrate level (p = 0.0639) was obviously found in the lincomycin exposed pigs. Despite the lower level of propionate from the trend point of view in lincomycin exposed pigs on day 7, no significant difference was found (p = 0.2162). The concentration of isovalerate and isobutyrate restored normal level on cessation of lincomycin exposure, so no alteration was detected among the two groups on day 14, 21 or 28 (p > 0.05). In contrast, the lower concentration of acetate (D14, p = 0.0238; D21, p = 0.0644), propionate (D14, p = 0.0431; D21, p = 0.0186) or total SCFA (D14, p = 0.0273; D21, p = 0.0866) from feces of lincomycin exposed pigs was still maintained in the first or second week after the end of lincomycin exposure, but the downward trend of these SCFAs disappeared in the third week with lincomycin exposure ceased (D28, p > 0.05). The concentration of butyrate (p = 0.0893) and valerate (p = 0.0793) had a declined trend in the first week with lincomycin exposed ceased, and the decrement was abolished in the next two weeks (p > 0.05).