Cell culture and treatment
Two strains of BC cells (T24 and UM-UC-3) were obtained from American Type Culture Collection (Manassas, VA). Normal treated groups were grown in complete medium supplemented with 10% fetal bovine serum (Gibco, Thermo Fisher Scientific, MA). Starvation incubated groups were treated by Hank’s balanced salt solution (HBSS; Boster Biotechnology, Wuhan, China) for six hours and then recovered in complete medium for further experiments. Chloroquine (CQ, 20 mM; Sigma-aldrich, USA), 3‐methyladenine (3-MA, 5 mM; Selleck Chemicals, Houston, TX), 2-Deoxy-D-glucose (2-DG, 5 mM; Selleck Chemicals), MG132 (50 mM; Selleck Chemicals) and PNU-74654 (50 mM; Selleck Chemicals) were used to treat cell lines for different inhibitions.
Small interfering RNA interference assay
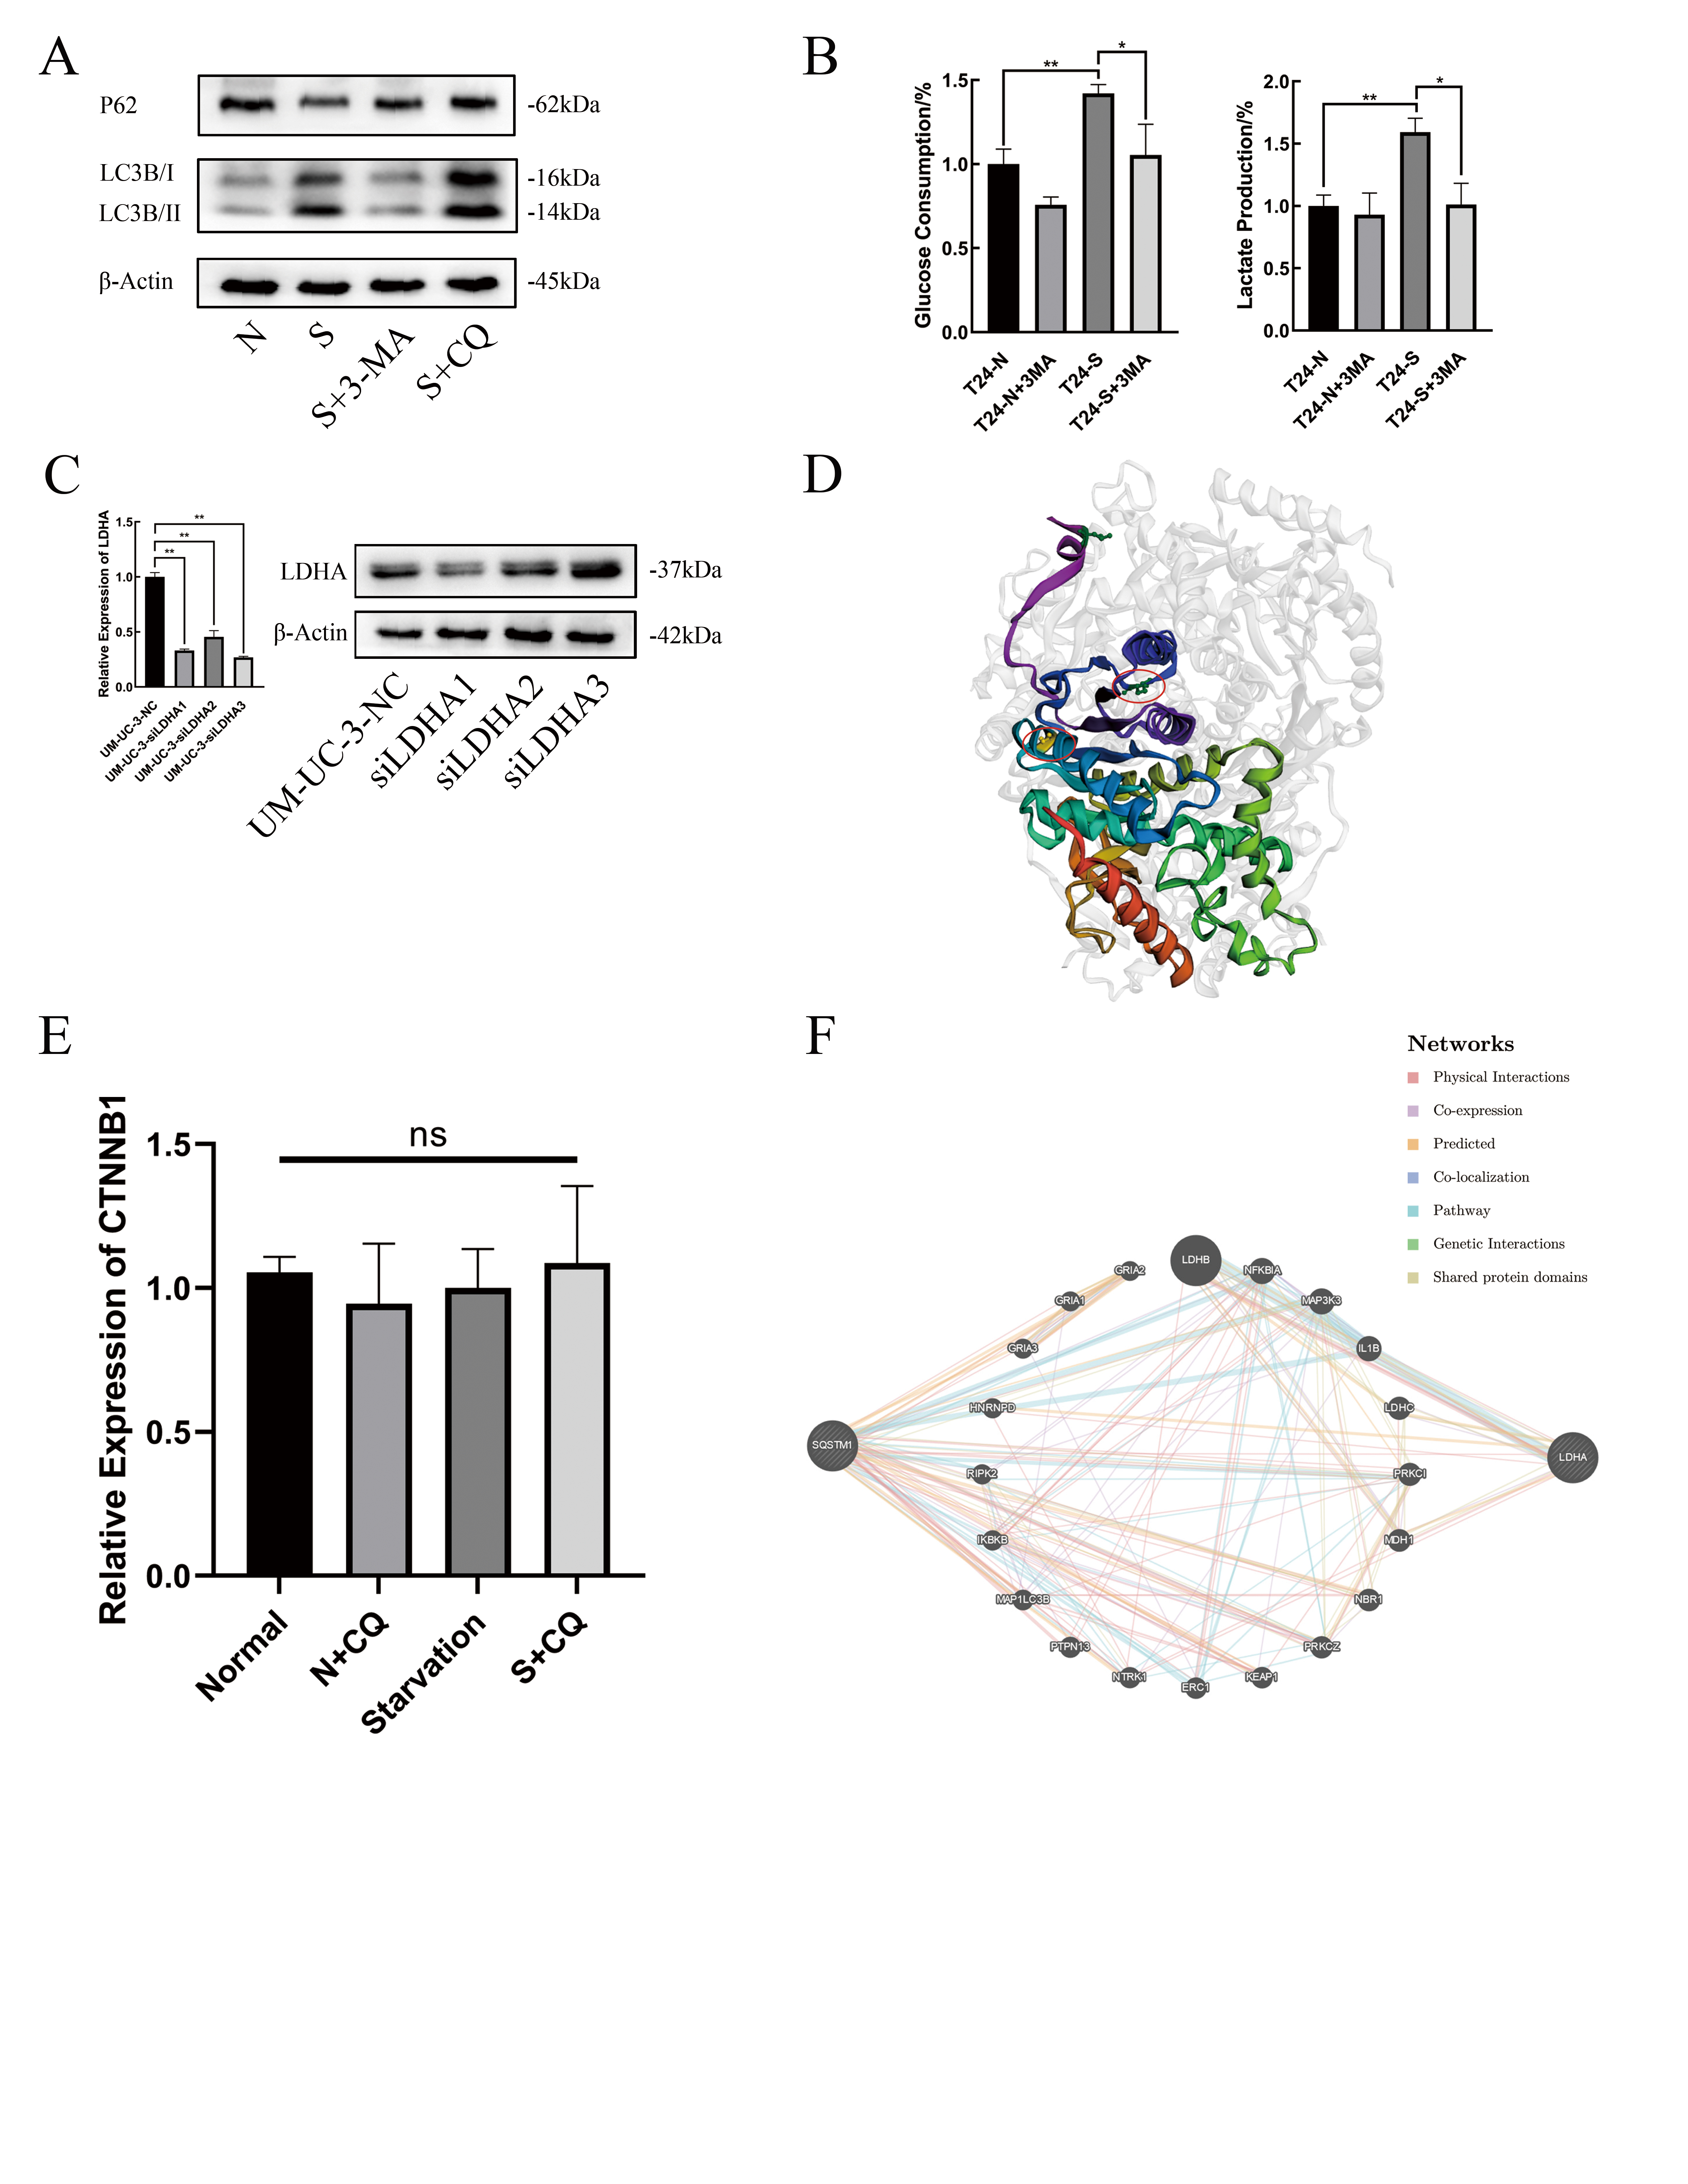
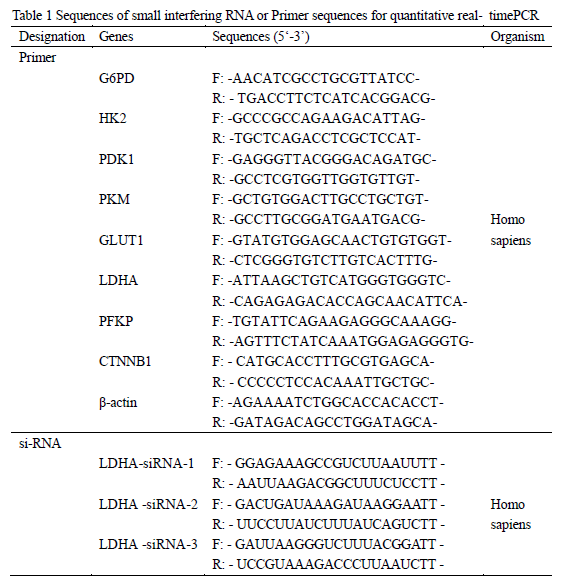
All small interfering RNAs (siRNAs) targeting human LDHA or negative control were designed and synthetized by GenePharma (Shanghai, China), transfected into the cell lines with Lipofectamine 2000 (Invitrogen, Carlsbad, CA), according to the manufacturer’s instructions. Sequences were demonstrated in Table1.
Quantitative real‐time polymerase chain reaction
Total RNA was drawn out from T24 or UM-UC-3 cells processed by different experimental conditions. PrimeScript RT reagent kit (TaKaRa, Osaka, Japan) were used to reverse‐transcribe RNA (1 mg) to cDNA. Real-time qPCR was performed with SYBR Green (TaKaRa) on an ABI 7500 Real‐Time PCR System (Applied Biosystems), the entire process followed the manufacturer’s instructions. Data were standardized to β‐actin using the 2−ΔΔCt method. The primer sequences were demonstrated in Table 1.
Immunoblots
Total protein was drawn out using radioimmunoprecipitation assay lysis buffer (Beyotime, China). NE-PERTM Nuclear Cytoplasmic Extraction Reagent kit (Thermo Fisher Scientific, MA) were used according to the manufacturer’s instruction for extracting protein of nuclear and cytoplasmic from different groups.
12% sodium dodecyl sulfate‐polyacrylamide gel was chosen for total protein separation and transferred to nitrocellulose membranes (Millipore, USA). Membranes were incubated with primary antibodies including: anti-LC3B (Abcam Cat# ab192890, RRID:AB_2827794), anti-P62/SQSTM1 (Abcam Cat# ab207305, RRID:AB_2885112), anti-β-actin (Proteintech# 20536-1-AP), anti-LDHA (Cell Signaling Technology Cat# 3582,RRID:AB_2066887), anti-β-catenin (Cell Signaling Technology Cat# 8480), anti-p-β-catenin (Cell Signaling Technology Cat# 4176), anti-c-Myc (Covance Cat# MMS-150P-1000,RRID:AB_291322), anti-GSK3-β (Cell Signaling Technology Cat# 121456), anti-Axin1 (Cell Signaling Technology Cat# 2087,RRID:AB_2274550) and anti-Histone H3 (Cell Signaling Technology Cat# 4499,RRID:AB_10544537). Enhanced chemiluminescence reagents (Millipore, USA) were used to assess protein expression.
Cell proliferation and viability
Cell proliferation was demonstrated by Cell Counting Kit-8 (CCK8, Boster Biotechnology) and colony formation assay. For CCK8 assay, cells were inoculated onto 96-well plates. CCK8 reagent was added 10 ml to each well at different timings. For colony formation assay, cells were inoculated onto 6- and 24-well plates with complete medium for 10 days, at a density of 500 cells per well when inoculating to 6-well plate, and 100 cells per well for 24-well plate. Colonies were fixed with 4% paraformaldehyde fix solution (P0099, Beyotime, China) and stained by 0.1% crystal violet staining solution (C0121, Beyotime).
Cell activity, used to reflect the sensitivity of cells to chemotherapy, was also presented by CCK8 assay. In accordance with the methods and procedures mentioned above, different groups were inoculated onto 96-well plates and treated with cisplatin at the indicated concentrations (0, 0.2, 0.5, 1, 2, 5, 10 and 20 µM) for further 48h incubation.
Transwell migration and invasion assays
The migration and invasion assay were performed using a 24-well Transwell chamber. For the migration assay cells were inoculated in the upper chamber. Migrated cells that attached to the substratum of the membrane were observed and photographed after fixation and staining. To evaluate the migration abilities of different groups, migrated cells on each chamber were counted 5 isolated fields under a 200-fold microscope. For the invasion assay, 50 ml matrigel mixture was added to the upper chamber in advance. The rest procedures and methods are the same as above.
Lactate production and glucose consumption measurement
Lactate and glucose concentrations in the culture supernatants were detected using Lactate Assay kit (Solarbio, Beijing, China) and Glucose Assay kit (Solarbio) respectively, according to the manufacturer’s instructions and absorbance values were measured at the corresponding absorbance. The results were normalized by the number of cells in each sample in the culture plates, lactate production and glucose consumption were calculated by comparison with normal medium.
Transmission electron microscopy
Cells were fixed in 3% glutaraldehyde electron microscope fixation solution, after gradually dehydrated by 50-100% ethanol gradient and embedded by araldite. Samples were chopped into ultrathin sections and stained with uranyl acetate and lead citrate. Images were obtained by transmission electron microscope.
Immunofluorescence
Cells were fixed for 30 mins. After permeabilized with 1% Triton X-100, primary including anti-LC3B (Abcam Cat# ab192890, RRID: AB_2827794) or anti-β-catenin (Cell Signaling Technology Cat# 8480) was added. Secondary antibody Alexa 488-conjugated goat anti-rabbit IgG (Beyotime Cat# A0423, RRID: AB_2891323) was added. After counterstained with DAPI (Beyotime Cat# C1002), cells were observed under a confocal microscope.
Immunoprecipitation (IP) and ubiquitination assay
Cells were harvested and lysed by IP lysis buffer (Beyotime Cat# P0013). Samples were centrifuged, supernatants were collected and 2.5mg of anti-Axin1 (Cell Signaling Technology Cat# 2087, RRID: AB_2274550), anti-p62 (Abcam Cat# ab207305, RRID: AB_2885112) or anti-IgG (Cell Signaling Technology Cat# 3900S) antibodies were added. Protein A/G immunoprecipitation beads were added to the suspension. Beads binding proteins were isolated by magnetic grate. IgG was used as negative control. For detecting and inhibiting ubiquitin protein, anti-Ubiquitin (Cell Signaling Technology Cat# 3933, RRID: AB_2180538) and MG132 (Selleck Chemicals Cat# S2619) 20mM dissolved with DMSO were also selected and applied.
Animal experiments
BALB/c nude mice (HFKBIO, Beijing, China) were fed under standard conditions. 5×10^6 cells with normal or starvation treatment were subcutaneously inoculated. Measurements were taken every 3 days on the tumor volume which was calculated as: tumor volume (mm3) =0.5×longest diameter× shortest diameter2. Till the average tumor volume reached 30mm3, equal amount of CQ (50mg/ml dissolved in 0.9% saline, Sigma-aldrich) or 0.9% saline was then administered intraperitoneally every 3 days. Two weeks later, the mice were suffocated to euthanasia by high concentration of carbon dioxide after 3% pentobarbital sodium deep anesthesia, the size of the tumors were recorded for further analysis.
Clinical data for human tissue specimens and bioinformatic analysis
Fifteen pairs cancer tissues and adjacent tissues of patients who underwent radical cystectomy for BC were collected in The First Affiliated Hospital of Chongqing Medical University. For bioinformatic analysis, immunohistochemical (IHC) images about the expression of LDHA in normal urothelial and urothelial cancer cells were downloaded from Human Protein Atlas database.
Statistical analysis
Experiments were independently repeated and representative images are performed in figures. Results of analyses are performed as the mean ± standard deviation. Unpaired students t tests were performed to compare the differences between two groups. Data of multiple groups results were analysed by Mann-Whitney test. P value<0.05 was considered statistically significant and significance levels were set to p*<0.05, p**<0.01, p***<0.001 or nonsignificant (ns).