Increased TE expression is positively correlated with both the activation of cellular TE inhibitors and the innate immune response and negatively correlated with autophagy in IPF
To determine the expression of TEs changes in IPF, we quantified the TE expression from previously published reports of the bulk RNA sequencing of 14 donor lung biopsies and compared it to explants from eight transplant recipients [18] (Supplemental Table 1). We first compared the gene expression and expression of the TE families between IPF patients and donors in flow cytometry-sorted AMs, AT2 cells, and whole lungs (WLs). The TE families are defined as groups of TEs with similar sequences across the genome (subfamilies), and thus, their expression is averaged per the number of such groups.
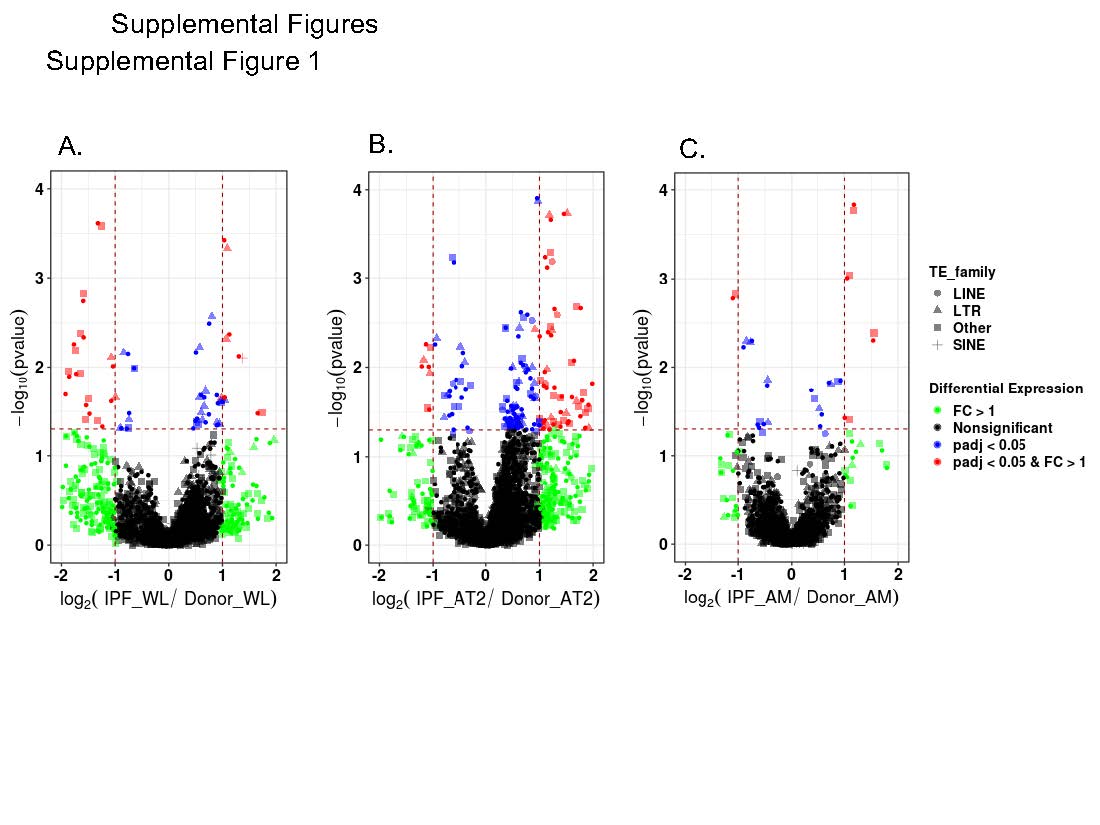
The largest changes in the expression of the TE family were identified in the AT2 cells (72 up, 22 down), with the largest number of changes being present in the LTR-TEs (Figure 1, Table 1A, Supplemental Table 2 A-C). The WL that represents a mixture of different cell types exhibited 18 TE subfamily differences (14 up, 4 down), with the largest number of changes again being present in the LTR-TEs. Finally, the TE activity in the AMs was characterized by 17 TE subfamily differences (11 up, 6 down), again primarily in the LTRs. A few other TE expression changes representing DNA transposons, which are less abundant TE families in humans, were also identified. The changes in the gene expression showed the same trend as the TE changes, and they were also the highest in the AT2 cells (4131), followed by the WL (1170) and AMs (1033) (Table 1A). We performed a Fisher exact test [19] to assess whether differentially expressed subfamilies are enriched in WL, AT2, or AM cells, and we did not find any significant enrichment (Table 1B). Interestingly, the LINE elements, which are responsible for the majority of retrotransposition activity in humans, were only upregulated in the AT2 cells (Figure 1, Table 1A). To confirm our findings, we also analyzed the data using REdiscoverTE [20] and verified the largest number of TE changes in the AT2 cells with similar changes in the individual subfamilies (Supplemental Figure 1, Supplemental Table 2 D-G).
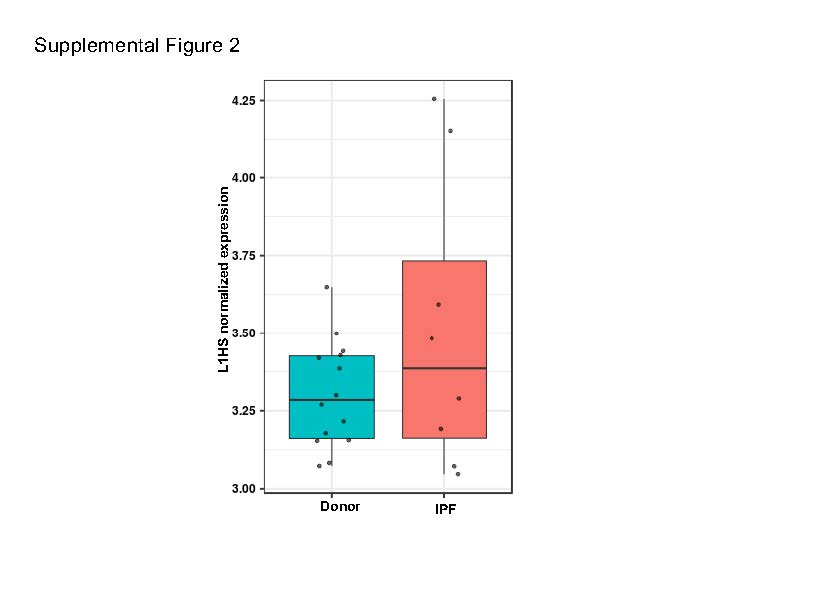
AT2 cells are a primary target of injury in IPF, and the processes involved in AT2 cellular senescence and inflammation are crucial for the development of fibrotic lung disease [21-25]. Moreover, the LINE TE family, particularly the upregulation of the autonomous (expressed from intergenic region, i.e., not from genic region and thus not dependent on gene expression) L1HS subfamily, has a well-established impact on senescence-related inflammation [6, 7]. Thus, we first tested for any evidence of autonomous L1HS subfamily upregulation in the AT2 cells. To differentiate autonomous TE expression from co-expression with host genes or intron retention, we used REdiscoverTE [20]. This computational workflow is designed to separate reads at the family level according to their genomic location (intronic, exonic, and intergenic), and it specifically models autonomous TE expression. We observed the largest number of differentially expressed TE families in the IPF cells in the exonic region (65), followed by those in the intergenic (57) and intronic (32) regions (Supplemental Table 3A-D) if only the SINE, LINE, and LTR families were considered. Differential expression in the intergenic region (autonomous TE expression) is however only relevant change for determining TE impact on cellular processes [20, 26]. We detected overexpression of 16 LINE subfamilies, 38 LTR families, and three SINE families in the intergenic regions of the IPF cells (Supplemental Table 3C). These were all evolutionary old TEs [27]; they were excluded from this particular analysis because their relationship with the inflammation during cellular senescence is functionally not well-established. Importantly, the L1HS family that represents human specific and retrotransposition competent TE element was significantly upregulated only in the intergenic region of the IPF cells (Figure 2A, Supplemental Table 3C) [28]. This suggests autonomous L1HS expression that could be related to the cellular processes involved in IPF. A similar pattern of differential intergenic TE expression in AT2 was observed using the modified SQuIRE quantification method (see Materials and Methods for details) (Supplemental Table 3D and Table 3E). The L1HS expression between groups as quantified by the modified SQuIRE quantification method was significantly different (p=0.037, logFC=1.16) as per DESeq2 analysis prior to multiple test correction (p=0.11). (Supplemental Figure 2). This discrepancy is a result of different mapping and quantification methods used by SQuIRE and REdiscoverTE.
AM and WL cells were also inspected for L1HS intergenic expression, and no differential expression was detected between the IPF and donor cells (data not shown).
TEs are tightly controlled by multiple mechanisms, including TE promoter methylation, and the inhibitory host factors involved in transcriptional and post-transcriptional TE control [29]. Modifications in these control points might activate TEs and cause pathological states that are frequently accompanied by inflammation [6, 11, 20, 30]. However, cellular transformation to a disease state in IPF is also complemented by these processes [21, 22, 31]. Thus, we determined whether there was an association between L1HS upregulation, and the expression of genes with functional relevance to L1HS activity [29, 32]. We tested four gene sets from the published literature: type I interferons (IFN-I, 84 genes), senescence-associated secretory phenotype (SASP) genes (85 genes), L1 transcriptional regulator genes (two genes), and L1 post-transcriptional regulator genes (17 genes) using linear model.
A total of 73 of these genes were differentially expressed between the IPF and donor cells; 63 were upregulated and ten were downregulated out of the 188 genes from our four sets (Supplemental Table 4B-C). Our linear model analysis showed a significant association between L1HS and 60 genes that differed between the IPF and donor cells (Supplemental Table 4C).
Here, we highlighted a correlation between L1HS and a few well known functionally important genes. We observed a positive association between L1HS and the forkhead box A1 (FOXA1) transcription factor (TF), which is crucial for L1HS expression; this finding is further evidence of the active expression of L1HS in the IPF cells (Figure 2C, Supplemental Table 4C) [6]. However, post-transcriptional regulator CALCOCO2 (NDP52), which plays an important role in degrading L1 RNA in the cytoplasm [33], was downregulated in the IPF patients and negatively correlated with the expression of L1HS (Figure 2C, Supplemental Table 4C). This might suggest an uncontrolled accumulation of L1HS in the IPF cells. Genes involved in IFN-I response (e.g., DDX58 (RIG-I), IFI16, STAT1,IRF9, ISG15), which is important for recognition of L1 cytosolic accumulation, and downstream activation of inflammatory processes also showed positive correlations with L1HS [29] (Figure 2C, Supplemental Table 4C). This further suggests that the inflammatory processes in IPF cells are related to increased L1HS expression.
We also tested genes that act as L1HS post-transcriptional regulator genes and found positive correlations for three of them in the IPF cells (Figure 2C [SAMHD1, MOV10, APOBEC3G], Supplemental Table 4-C). [29]. Some of these L1 inhibitors, such as SAMHD1, MOV10, and APOBEC3G, are activated by IFNs [34]. Thus, increased interferon signaling may have activated these L1 inhibitors against the high L1HS expression in the AT2 cells.
Finally, SASP markers (e.g., SERPINE1 and MMP3) were also positively associated with L1HS in the IPF cells [6] (Figure 2C, Supplemental Table 4-C). This is particularly interesting, as previous research showed increased SERPINE1 in IPF AT2 senescent cells [35]. Increased MMP3 expression is also essential for the pathogenesis of IPF, based on findings from IPF patients and animal models [36]. We found extremely low MMP3 expression in the donor cells, whereas the IPF cells expressed high levels of MMP3, which was positively associated with L1HS. This further suggests that senescent cells in IPF patients also exhibit an increase in L1HS activity.
Locus-level TE expression is associated with IPF and is also cell-type specific
The induction of immune response in cellular senescence by means of the accumulation of the intrinsically expressed TEs in the cell is not the only detrimental effect of TEs. Indeed, TEs can provide alternative promoters or polyadenylation signals, as well as alternative splice acceptor and donor sites, which can strongly alter the gene expression patterns of the host. [5, 37]. In addition, a few methods based on the association between TE and –proximal gene expression have been developed as potential tools for detecting candidate genes for diseases [38].
Here, we aim to determine whether locus-specific TE expression near or within the gene can explain the expression differences of that gene, and whether that relationship differs between donor and IPF cells. We quantified the changes in TE expression that occurred at individual genomic locations for all TE families within the three cell types, and associated those differences with adjacent gene expression. We again identified the largest number of changes in the AT2 cells (1489 up, 1149 down), while the WL also featured an abundant number of changes representing 1341 TE loci (588 up, 753 down) (Figure 3, Supplemental Table 5). Finally, the TE activity in the AM was found to be characterized by 359 TE loci (193 up, 166 down). We first intersected the upregulated TE locus changes as well as the gene changes between the IPF patients and the healthy donors in each cell type (Figure 4A). This analysis revealed that most changes were unique and only present in an individual cell type (AT2 = 1426, AM = 180, and WT = 530), although 53 TE changes were shared between the AT2 and WL, four between the WL and AM, and nine between the AM and AT2, while one change was common to all three comparisons. This suggests the potentially strong impact of TE activity specific to the AT2 and AM that might affect the gene expression related to IPF and that is not detected when analyzing the heterogeneous WL cell population. The number of gene expression changes shared among the different cell types also showed a similar trend, with the highest number of expressed genes being observed in the AT2 (3826), followed by the AM (822), and the WT (644).
We next examined the distribution of the TE changes across the genomic regions. To do so, all the differentially expressed TE changes were categorized as belonging to either the 5’UTR, 3’UTR, exon, intron, or intergenic region. These analyses revealed the same pattern of changes as observed in relation to the three comparisons (AT2, AM, and WL, Figure 4B, Supplemental Table 5), with the highest number of TE transcriptional changes being seen in the 3’UTR region, while the smallest number of changes were found in the intron and intergenic regions. The TE changes overlap with the exon as well as the exon-intron, exon-5’UTR, and exon-3’UTR regions were excluded from further analysis because they were most likely related to transcriptional noise.
TE expression is correlated with the gene expression of several IPF candidate genes
To further illustrate the importance of locus-specific TEs, we tested the effects of the intragenic and intergenic upregulated TE (excluding those in the exons) loci on the transcriptional regulation of the genes. As the pairwise comparisons of each gene with each TE locus identified a large number of changes, some of which proved difficult to interpret, we focused on the TEs matched with their adjacent genes (cis interactions) and examined whether TE expression predicts nearby gene expression. There were 1512 pairs (out of 10092988 tests conducted between 3826 genes and 2638 TEs, with 7.80% being significant pairs) in the AT2 cells, 198 pairs in the AM cells (out of 295098 tests conducted between 822 genes and 359 TEs, with 1.4% being significant pairs), and 497 pairs in the WL (out of 863604 tests conducted between 644 genes and 1341 TEs, with 0.04% being significant pairs) that matched the cis criteria (Figure 5). We identified a total of 172, 105, and four significant gene-TE pairs (p < 0.05) from among our cis subsets in the AT2, AM2, and WL, respectively. In some cases, there were more than one TE associated with the expression of the same gene. Thus, we further classified the difference into the number of unique genes whose transcription is significantly related to the TEs. This classification resulted in the identification of a total of 107 genes in the AT2 cells, 63 genes in the AM cells, and three genes in the WL tissue that had a transcriptional pattern correlated with TEs and that differed between the IPF patients and the healthy donor (Figure 5). Interestingly, although a high number of TE-gene pairs were present in the WL comparison, only a very few significant differences were observed, which again suggests that important signatures might be missed in heterogeneous cell populations. Our gene ontology enrichment analysis of the genes found to be correlated with TE expression in the AT2 cells identified cilium movement as well as axoneme and organelle assembly related processes (FDR < 0.005) (Table 2A). This suggests that the activation of TEs can result in the activation of genes that might be involved in cellular identity changes. In the AM cells, the TE-associated gene expression was found to be linked with immune-related cellular process.
Most of the TEs found to be associated with gene regulation in the AT2 cells were identified in the introns (75), followed by the 3’UTR region (82), outside the gene (12), and the 5’UTR region (three) (Supplemental Table 6A, Table 2B). The SINE (Alu) elements were most commonly found to be associated with gene expression in the AT2 cells, and they were mostly embedded within the 3’UTR region of the genes. Several of the genes found to be significantly correlated with TEs represent important IPF candidate genes that have been identified in multiple genome-wide association studies or functional studies related to IPF [39]. For example, we identified a 3.88-fold expression change between the IPF patients and the healthy donors in the TE (chr11|1253519|1253937|MLT1C:ERVL-MaLR:LTR) that is located between exons 33 and 34 and that is significantly correlated with the high expression of the MUC5B gene in IPF (Supplemental Table 6A). Furthermore, the relationship between the gene and the TE expression of IPF group is significantly different than the same relationship in donor group (Figure 6A, p.adjust=0.0284). This suggests the potential role played by TEs in the regulation of this gene, which in turn plays an important role in mucin excretion and significantly contributes to IPF pathogenesis [40, 41]. Notably, we identified the association between one of the three core IPF gene markers, namely the cell adhesion molecule L1-like (CHL1) gene, and the L1PA6 TE (chr3|367661|374053|L1PA6:L1:LINE) (Supplemental Table 6A). However, two other TEs (chr3|391232|391535|AluSz:Alu:SINE, chr3|408347|408547|MIRc:MIR:SINE|342), also showed a significant association with CHL1 expression. To determine which of the TEs made the largest contribution to CHL1 gene expression, we used all three TEs in a linear model and then calculated the relative importance of each of them in terms of influencing CHL1 expression. The proportion of the variance explained by the model containing all three TEs was 86.09%. Further, each TE explained ~20% of the variance, while the group covariate representing the phenotype explained ~25% of the variance, thereby suggesting the similar contributions of all the TEs to the gene expression. Significant difference between the correlation slope in IPF and donor groups was also observed for L1PA6- CHL1 relationship (Figure 6A, p.adjust= 0.0019) and the other two TEs (AluSz, MIRc) associated with CHL1. This further suggests potential regulation of CHL1 by adjacent TEs in IPFs.
The serpin family B member 3 (SERPINB3) is another important IPF candidate gene for which we identified a 4.23-fold change in the gene expression between the IPF patients and the healthy donors, which was correlated with a 4.21-fold change in the LINE TE element (chr18|63651629|63653187|L1MA8:L1:LINE) (Supplemental Table 6A). This element is located ~2 kb downstream of the gene. Glutathione S-transferase alpha 2 (GSTA2) also exhibited upregulation in the IPF patients, and its expression was associated with the LTR5A TE (chr6|52748278|52749305|LTR5A:ERVK:LTR) located 783 bp downstream of that gene (Figure 6A, Supplemental Table 6A). Although TEs significantly predicts the expression of SERPINB3 and GSTA2 genes, that relationship does not significantly differ between IPF and donors as shown by test for correlation slopes (Figure 6A, p.adjust=0.1260, p.adjust=0.9227, respectively). Nevertheless, significant difference of TEs expression results in significant difference in gene expression for these genes in IPF suggesting their role in the disease.
The analysis of the TE loci in the AM cells primarily determined the association between gene expression and the SINE elements (56), followed by the LINE (26), LTR (six), and 17 other elements (e.g., DNA transposons) (Supplemental Table 6B, Table 2B). Most of the elements from all the families were activated within the 3’UTR region, and we did not identify any elements associated with gene expression outside the gene. We found that the expression of the chemokine CCL22 was related to the three SINE elements (chr16|57364478|57364778|AluSq2:Alu:SINE, chr16|57364806|57365101|AluSz:Alu:SINE, chr16|57365617|57365740|AluJo:Alu:SINE) located in the 5‘UTR and 3‘UTR region (Table 4B). This chemokine contributes to activation of alveolar macrophages and subsequently to the lung damage in patients with IPF [42]. The proportion of variance explained by the model predicting the CCL22 expression was 93.71%, with AluSz (3’UTR) explaining ~29% and AluJo (3’UTR) and AluSq2 (5’UTR) explaining ~27% and ~24%, respectively. Correlation slopes for IPF and donors are also significantly different for two of these elements providing additional evidences for strong regulation of CCL2 by TEs activation in IPF patients (Figure 6B, only plot for AluSq2 element is shown, p.adjust= 0.0237). We also found that the upregulated TE expression in the intron (chr14|22843913|22844208|AluSx1:Alu:SINE), and in the 3‘UTR region (chr11|102520549|102520704|L2c:L2:LINE) significantly correlates with two upregulated matrix metalloproteases (MMP14 and MMP7, respectively) in IPF group (Supplemental Table 6B). MMPs are important players in cell migration and tissue repair in lungs and have been related to IPF pathogenesis [43]. Here, we establish correlation of two MMPs with TEs and we further identify significant TE-gene correlation slope difference in MMP7 between IPF and donors which further confirms differential regulation of MMP7 in IPF (Figure 6B, p.adjust= 0.0156).
We were also able to associate a number of other genes with TE expression that have previously been related to IPF, including osteopontin (SPP1) in the 3’UTR region (Chr4: 87979662-87979893)
and the interleukin 1 receptor antagonist (IL1RN) within the 5’UTR region (chr2|113133292|113133561|Charlie18a:hAT-Charlie:DNA) (Supplemental Table 6B). Both these genes are known to be expressed at high levels in IPF AM cells, while previously reported immunohistochemistry results have confirmed that these markers are not expressed in donor tissue [18]. Our study also finds significant upregulation of these genes and their adjacent TE loci in IPF.
However regression slopes between donors and IPF did not differ for these two TE-gene pairs, suggesting that these genes might not be directly related to TE expression (Figure 6B, p.adjust= 0.1739 for SPP1, p.adjust= 0.8381 for IL1RN ) .
ScRNA-seq analysis confirms the TE changes in multiple cell populations in the fibrotic human lung
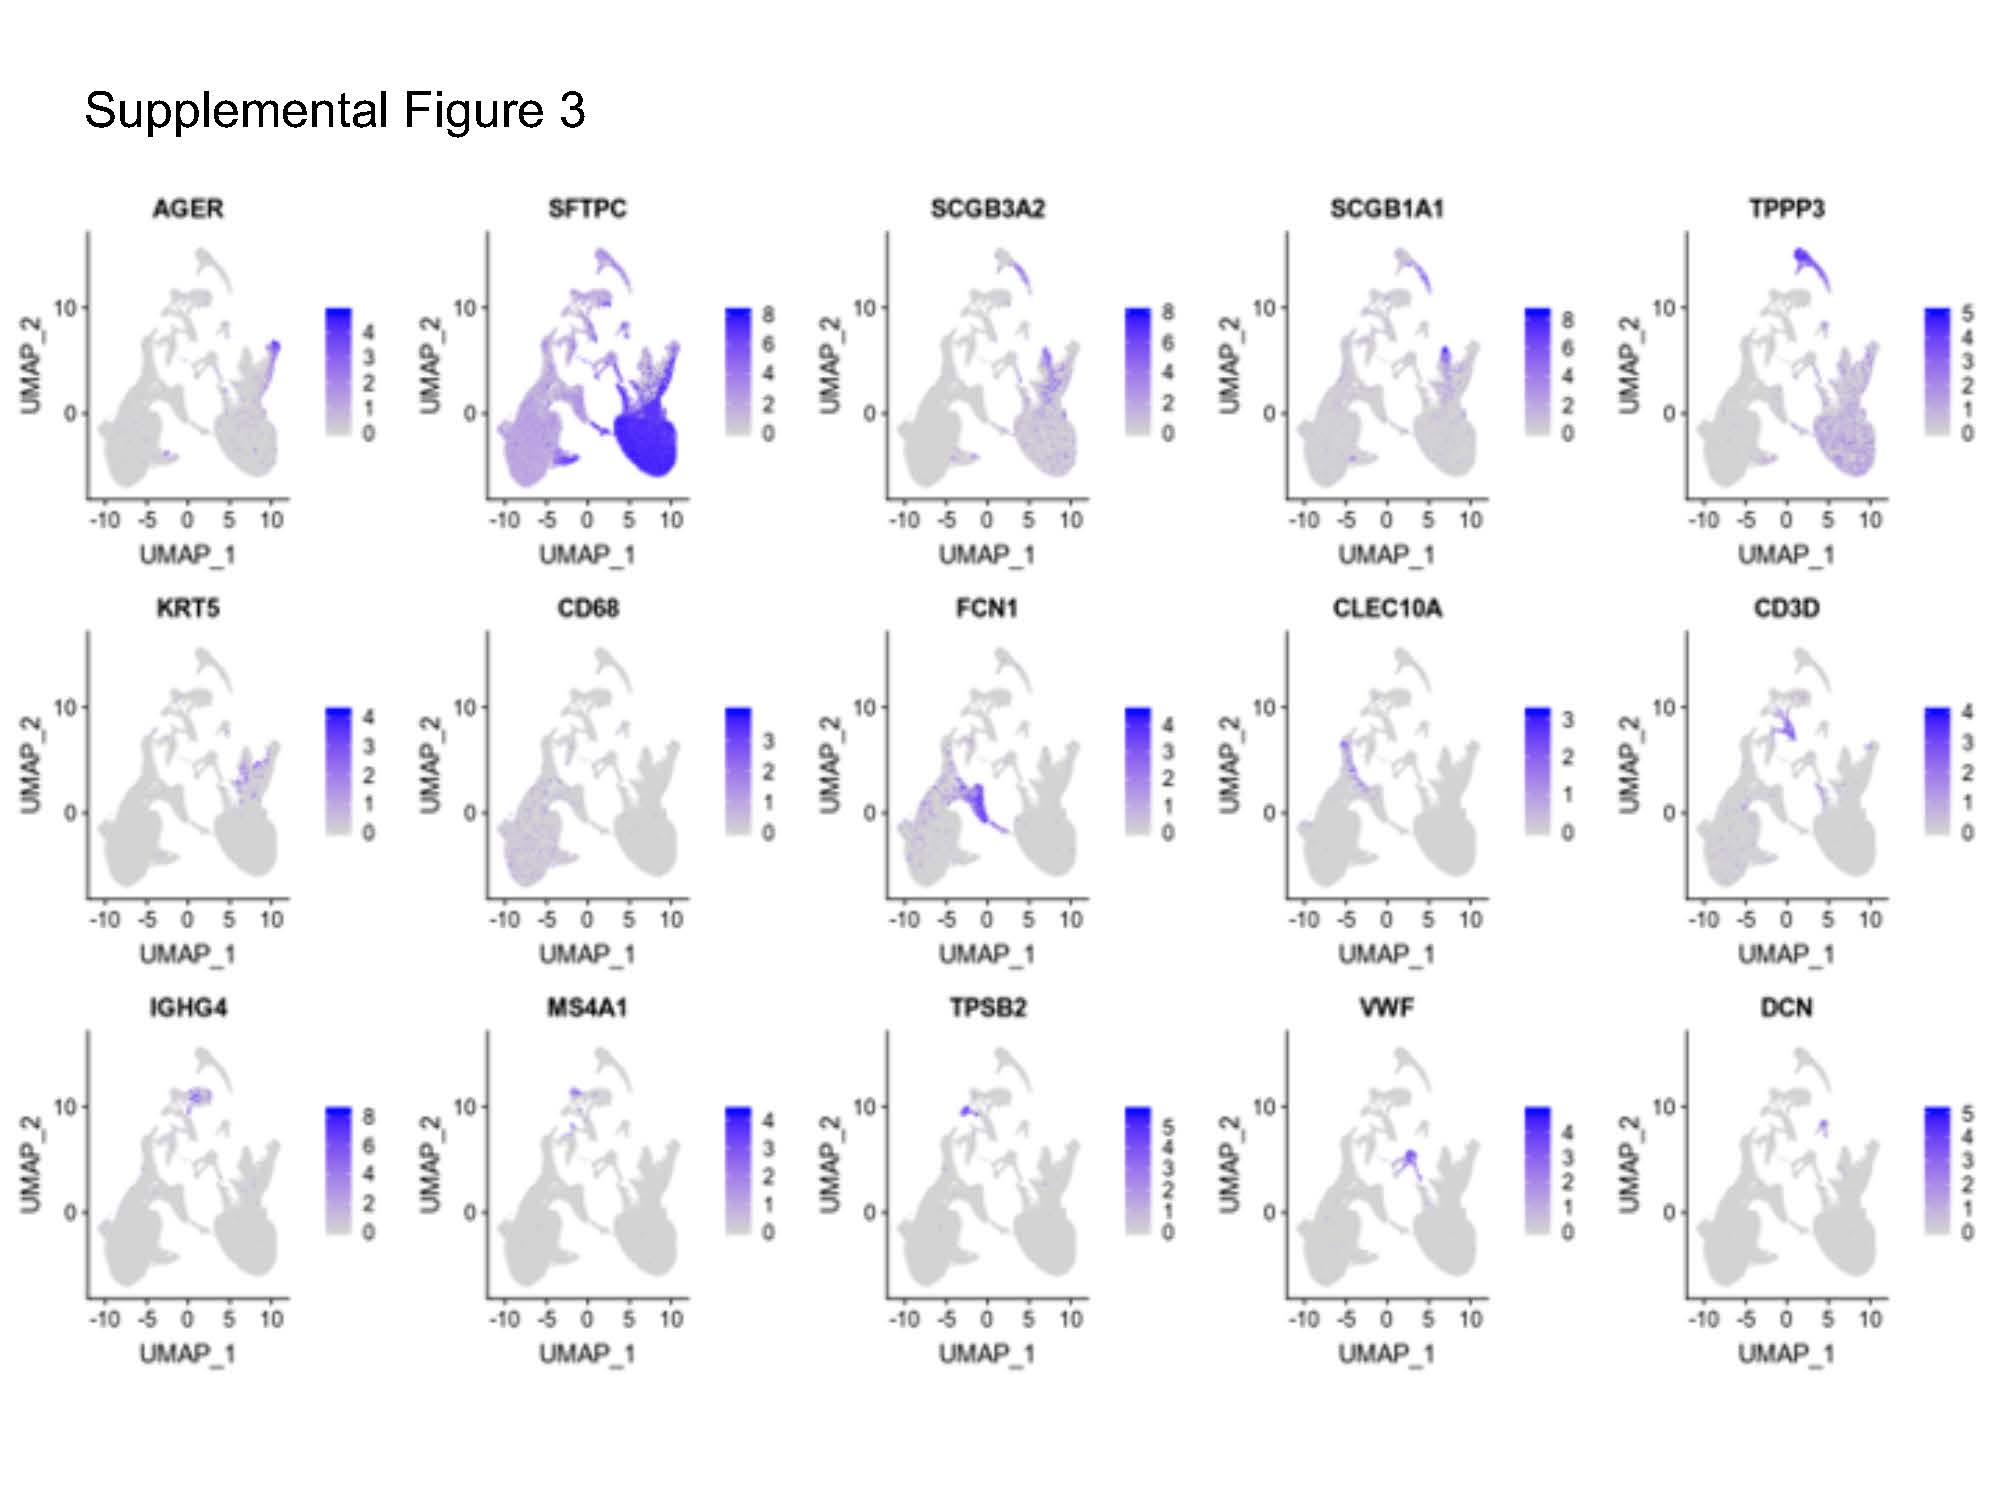
We also analyzed a previously published dataset concerning eight donors and eight IPF patients that had been generated by means of scRNA-seq technology [44]. A total of 77,517 single cells and 22,009 genes were obtained. We assigned each cluster to a cell type based on the expression of the established markers in that cluster (Supplemental Figure 3), and the following cell types were confirmed: epithelial cells (alveolar type II cells (AT2), alveolar type I cells (AT1), ciliated cells, basal cells, and club cells), immune cells (alveolar macrophages (AMs), monocytes, B cells, plasma mast cells, dendritic cells, and T cells), and mesenchymal cells (fibroblasts and endothelial cells) (Figure 7A). The distribution and identity of the cells were similar between the two phenotypes (Figure 7B, Supplemental Table 5A). To confirm the differential TE activity in the AM2 and AT2 cells in the IPF patients, as well as to determine whether the TEs differed in the other cell types, we performed a differential gene expression (DGEs) analysis between the donors and the IPF patients with regard to the TE subfamilies in each cell type (Supplemental Table 7B). The results of the DGEs analysis between the IPF patients and the donors for each identified TE subfamily and all the genes in the individual lung cell type are presented in Supplemental Table 7C and summarized in Figure 7C. We identified the increased transcription of two TE families (LINE and LTR) in the IPF patients when compared with the donors in multiple cell types (p.adjust < 0.05 and lfc > 0). Consistent with the TE upregulation identified in our RNA bulk analysis, we identified 27 significantly upregulated L1 subfamilies and eight significantly upregulated LTR subfamilies in the single-cell transcriptome. Similarly, 22 LINE subfamilies and 12 LTR subfamilies were found to be upregulated in the AM cells (Figure 7C). In addition, we also detected upregulation in the case of the IPF patients in the monocytes as well as the upregulation of a smaller number of subfamilies in the club, ciliated, B, dendritic, AT1, T, endothelial, and plasma cells.
Aside from identifying changes in multiple subfamilies, we were also interested in determining whether an association exists between the total expression of the L1 subfamilies and IPF in AT2 cells, as identified by bulk RNA-seq. Thus, we calculated the L1 score that represents the average expression of the upregulated L1 family per each cell type. The comparison between the L1 scores of the healthy donors and the IPF patients indicated that the L1 score is significantly higher among fibrosis patients in the AT2 cells, which indicates that it might be involved in IPF pathogenesis (Figure 8A). To further confirm whether the relationship between L1 activity (L1 score) and TE-related genes differs
among the IPF patients and the healthy donors, we tested 126 genes which were identified in bulk RNA-seq. We identified 27 TE regulation and inflammatory response related genes (p.adjust<0.05) (i.e. APOBE3G, STAT1, SAMHD1, IRF9) in the AT2 cells (Supplemental Table 7D, Figure 8B). This observation indicates that the L1 upregulation, also confirmed in independent dataset by scRNA-seq might promote the inflammatory response in the AT2 cells of IPF patients. Single-cell RNA sequencing is a powerful method but only generates short reads from one end of a cDNA template, limiting the mapping of highly similar TE sequences. Thus, locus specific TE expression was not performed for scRNA seq dataset.