An earthquake (mainshock) may be preceded closely in time and space by one or more smaller earthquakes which are known as foreshocks (Mogi, 1963). There have been numerous studies of foreshocks for various regions, and a wide range of reported rates of foreshock occurrence from about 10% to 70% in the western US (Jones, 1985; Abercrombie and Mori, 1996; Chen and Shearer, 2015; Trugman and Ross, 2019; van den Ende and Ampuero, 2019; Moutote et al., 2021), Japan (Yoshida, 1990; Maeda, 1996) and Italy (Console et al., 1993). There were also some well recorded larger earthquakes without foreshocks. For example, the 2004 M6.0 Parkfield earthquake did not have foreshocks while the 1934 and 1966 Parkfield earthquakes had clear foreshocks (Bakun and McEvily, 1979). In order to help clarify the rates of foreshock occurrence, we summarize the characteristics for a relatively large dataset of over 2000 mainshocks with magnitudes from Mj3.0 to 7.2 that have been recorded onshore of Japan over the last 20 years. In contrast, previous regional studies of foreshocks examined only about 50 to 100 mainshocks.
Data
Japan is one of the most seismically active regions of the world, and benefits from having some of the best observation networks. After the 1995 Mj7.3 Hyogoken-nanbu (Kobe) earthquake, the National Research Institute for Earthquake Science and Disaster Prevention (NIED) installed the High Sensitivity Seismograph Network Japan (Hi-net), which currently is composed of about 800 borehole seismic stations spaced uniformly across Japan at intervals of 20 to 30 km (Okada et al., 2004; Obara et al., 2005). These stations provide high signal to noise (SNR) recording of the earthquakes and contribute to the Japan Meteorological Agency (JMA) earthquake catalogue with a very good level of completeness.
We use hypocentral information from the JMA earthquake catalogue from January 1, 2001 to February 28, 2021. We only consider the shallow (depth <= 30 km) mainshocks which were located onshore to ensure a good level of event completeness in searching for the foreshocks. The level of completeness for our dataset is determined by looking at the plots of cumulative number of earthquakes as a function of magnitude (Fig. 1). There are several time periods shown in the figure since the processing system for earthquake detection was changed in 2016 to include more automatically detected earthquakes with magnitude less than 1.0 (Tamaribuchi, 2018). For all the three time periods (2001 – 2021, 2001 – 2016 and 2016 – 2021), the earthquake catalogues appear to be complete to a magnitude of less than 1.0. Thus, a threshold level of Mj >= 1.0 is chosen for this study.
Catalogue Declustering
In order to evaluate the foreshocks under normal ambient stress conditions, we attempt to remove aftershocks, earthquake swarms and possible triggered earthquakes from the 2011 Tohoku-oki earthquake. For the aftershocks, we decluster the earthquake catalogue based on the aftershock time-space windows from Gardner and Knopoff (1974), which are commonly used for declustered earthquake catalogues. Figure 2 shows the yearly number of earthquakes before (blue) and after (red) the aftershock removal. Earthquake swarms are sequences during which sometimes hundreds of earthquakes occur in a short time, and have patterns different from typical foreshock-mainshock sequences. Figure 3 is an example of an earthquake swarm on December 18, 2009. For this earthquake, about 277 earlier earthquakes occurred within about 4 km and 1 day prior to the mainshock. In this study, we define earthquake swarms as sequences that have more than 150 earlier earthquakes that occur within 30 days and 30 km before the subsequent mainshock(s), which is over 10 times higher than the earthquake level prior to most of the independent earthquakes. We exclude 29 mainshocks associated with swarms from our earthquake catalogue. This number is about 1% of all the identified independent earthquakes and it does not significantly affect the statistics.
The 2011 Mw9.0 Tohoku-oki earthquake presented a special problem since there was increased seismicity following the mainshock in eastern Japan, and even farther distances throughout much of the country (Miyazawa, 2011). These earthquakes are normally not classified as aftershocks, but were considered to be the triggered earthquakes related to the widespread effects of the great Tohoku-oki earthquake. The triggered earthquakes should be removed because inferred foreshocks (identified by the time-space window) may not be directly related to the subsequent nearby mainshocks, but instead caused by the larger scale regional stress changes from the Tohoku-oki earthquake. For minimizing the effects of these possible triggered earthquakes, we remove 822 earthquakes (Mj3.0 to 7.0) for 5 years from March 2011 to March 2016 across the entire country. Earthquakes which are considered to be aftershocks are still occurring in the offshore Tohoku region 10 years after the mainshock (e.g., the 2021 Mj7.3 Fukushima earthquake). However, the levels of seismicity onshore appear to return to normal levels before the Tohoku-oki earthquake in about 5 years (Fig. 2).
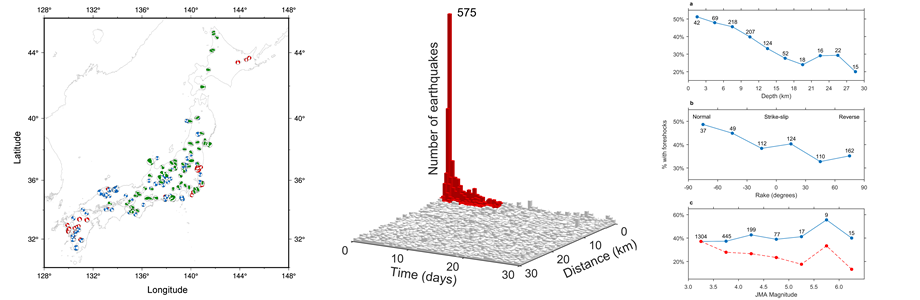
After the aftershocks, earthquake swarms and possible triggered earthquakes following the Tohoku-oki earthquake are removed, we have 2066 independent earthquakes (Mj3.0 – 7.2) for the analysis of foreshock occurrence. The earthquakes are distributed relatively evenly across the entire country (Fig. 4). Focal mechanisms are available for 593 independent earthquakes, with 86 normal (rake 225° – 315°), 235 strike-slip (rake 315° – 45° and 135° – 225°) and 272 reverse (rake 45° – 135°) earthquakes. This dataset of mainshocks can be the representative of the onshore Japan seismicity during the period for 2001 to 2021 under normal ambient regional stress conditions.
Definition of foreshocks
To define the foreshocks in this study, we investigate the time and space distribution of every pair of earthquakes when a larger earthquake follows a smaller earthquake. We use times of 0 to 30 days and distances of 0 to 30 km as the time-space window to search for earlier earthquakes. Figure 5 shows the time and space distribution of the earlier earthquakes for a total of 31,382 earthquake pairs. There are several obvious peaks within a few days and few kilometers of epicentral distance prior to the mainshocks. We use epicentral distance instead of hypocentral distance, since the location uncertainties are larger in the vertical compared to the horizontal. The red bars show values that are greater than the average background value, which is calculated for times longer than 15 days and distance greater than 10 km. Therefore, the definition of foreshocks used in this study are earthquakes smaller in magnitude than the mainshock that occur within 10 days prior to the mainshock at epicentral distances closer than 3 km. The other earthquakes at longer time and farther distance (white bars) are considered to be the random background seismicity. Figure 5 is similar to a figure presented by Jones (1985), which shows that foreshocks in California mostly occur at times of less than 5 days and distances of less than 10 km.
There may be some ‘foreshocks’ (small earlier earthquakes that are physically related to the mainshock) at longer time and farther distance than our definition. For example, studies in southern California include earthquakes up to several months before the mainshock as foreshocks (Trugman and Ross, 2019, Van den Ende and Ampuero, 2020, Moutote et al, 2021). However, in this study we cannot distinguish such possible foreshocks from the background seismicity.