Reagents and Antibodies
The S-adenosine homocysteine and EZH2 inhibitor DZNep was purchased from Ape×Bio (Houston, TX, USA), and was dissolved in phosphate buffer saline (PBS) as a stock solution at the concentration of 5 mM. Fetal bovine serum (FBS) was bought from Gibco BRL (Sydney, Australia), minimal essential medium alpha (α-MEM) was bought from Hyclone (Logan, UT, USA), and penicillin/streptomycin was purchased from Gibco BRL (Gaithersburg, MD, USA). Recombinant mouse RANKL and M-CSF were obtained from R&D (Minneapolis, MN, USA). The Cell Counting Kit-8 (CCK-8) was purchased from Dojindo Molecular Technology (Japan). The TRAP staining kits were bought from Sigma-Aldrich (St. Louis, MO, USA). The SYBR® Premix Ex Taq™ II and Prime Script RT reagent Kit were obtained from Takara Biotechnology (Otsu, Shiga, Japan). The primary antibodies against β-actin, LaminB, ERK, phospho-ERK (Tr202/Tyr204), JNK, phospho-JNK (Tr183/Tyr185), p38, phospho-p38, IKKβ, IκBα, P65, phospho-IKKα/β, phospho-IκBα, phospho-P65, EZH2, H3K27me3, GSK-3β, phospho-GSK-3β(ser9), and the secondary antibody, were bought from Cell Signaling Technology (CST, Danvers, MA, USA). The primary antibodies against NFATc1, c-FOS were purchased from Absin Bioscience Inc (Shanghai, China). All the antibody mentioned are rabbit anti-mouse.
Bone marrow-derived macrophages (BMMs) preparation and Cytotoxicity Assay
Primary BMMs were obtained from whole bone marrow of male 6-week-old C57BL/6 mice. In brief, cells were extracted from the tibiae and femurs bone marrow and suspended in complete α-MEM (α-MEM supplemented with 30 ng/ml M-CSF, 10% FBS, and 1% penicillin/streptomycin). Then, the cell cultures were kept in a humid environment at 37 °C with 5% CO2 until they reached 90% confluence. The Cytotoxic effects of DZNep on BMMs were then determined by the CCK-8 kit. Specifically, the BMMs were seeded into 96-well plates in triplicate at the density of 8×10³ cells/well in presence of 100μL complete α-MEM for 24 hours. After that, the cells were treated with increasing concentration of DZNep (control, 3.125, 6.25, 12.5, 25, 50, 100, 200nM) for 24, 48, and 96 hours. After treatment, 100μL medium contained 10% CCK-8 buffer was added to the wells and incubated in the dark at 37 °C for 2 hours. The absorbance was then detected at 450 nm wavelength (650 nm reference) on a microplate reader.
Osteoclast differentiation and TRAP Staining Assay
To evaluate the role of DZNep on osteoclastogenesis, BMMs were seeded into, in triplicate, a 96-well plate at the density of 8 × 10³ cells/well with complete α-MEM for one day. Afterward, the culture medium was replaced by the complete α-MEM containing different concentrations of DZNep (control, 3.125, 6.25, 12.5, and 25 nM) and RANKL (50 ng/ml) to stimulate osteoclast differentiation. Cells untreated with DZNep were included as the control group. For EZH2 gene knockdown studies, the cells were transfected with virus constructed of different EZH2 short hairpin RNA (shRNA) and negative control shRNA by mixed with polybrene (final concentration of 10ug/ml) for 48 hours. The transfection mixture was then replaced by complete α-MEM added with puromycin for 24 hours and BMMs were then seeded into a 96-well plate at the density of 10 × 104 cells/well with complete α-MEM. The culture medium was then replaced every 2 days until the matured osteoclasts could be observed in the plate. The plate was then washed by PBS 1 times and fixed with 4% paraformaldehyde for 15 min. TRAP staining was performed immediately without light at 37 °C for 30 min. Moreover, the BMMs treated with or without DZNep for various days were also analyzed. An optical microscope (Olympus, Tokyo, Japan) was used to image the Photos, and the TRAP-positive cells with more than three nuclei were considered osteoclasts and were quantified the area and number using the ImageJ software (NIH, Bethesda, MD, USA).
Bone Resorption Assay
To explore the effect of DZNep on the function of osteoclast, BMMs on complete α-MEM were seeded at the density of 1 × 10⁴ cells/well, in triplicate, on the Osteo Assay Surface plates (Corning, NY, USA). After thirty-six hours, the culture medium were replaced by complete α-MEM, with RANKL (50 ng/mL), and various doses of DZNep (control, 6.25, 12.5, and 25 nM). For EZH2 gene knockdown studies, the cells were transfected with virus constructed of different EZH2 short hairpin RNA (shRNA) and negative control shRNA by mixed with polybrene (final concentration of 10ug/ml) for 48 hours. The transfection mixture was then replaced by complete α-MEM added with puromycin for 24 hours and the survived BMMs were seeded into a 96-well plate, in triplicate, at a density of 1 × 10⁴ cells/well. The medium need be constantly replaced until the osteoclast had matured for 1 day. The 5% sodium hypochlorite were used to wash the wells for 3 min to remove the cells. The total area of resorption was photographed, and then calculated by Image J software (NIH, Bethesda, MD, USA).
Immunofluorescence of Podosome Actin Belt
BMMs in complete α-MEM with or without 25nM DZNep were seeded in 6-well plates at a density of 1 × 10⁵ cells/well and cultured for 6 days. Once the matured osteoclast could be observed, the plate was washed by PBS and then fixed with 4% paraformaldehyde. The 10 minutes 0.2% Triton X-PBS was then performed for permeabilizing. After three times washing by PBS, FITC-labeled phalloidin was added for 1 hour in darkness to bounds with the cells F-actin ring. The nuclei were stained at RT for 5 minutes without light by 4’, 6-diamidino-2-phenylindole (DAPI). After the final PBS wash, the perimeter of the actin ring could be observed by the fluorescence microscope (Leica), and analyzed using Image J software (NIH, Bethesda, MD, USA).
Cultivation, differentiation, and mineralization of osteoblasts
To identify the effect of DZNep on osteogenesis, bone marrow-derived mouse mesenchymal stem cells were firstly seeded into the 48-well plates for one day at a density of 5 × 10⁴ cells/well. Then the medium was changed by Low-glucose DMEM with 15% FBS, 5 mM β-glycerophosphate, 50 µg/mL ascorbic acid, 10-7mM dexamethasone, and various concentration of DZNep (0, 12.5, 25, 50, and 100 nM). The medium was changed twice a week. On day 7 and day 28, cells were stained by using BCIP/NBT kit (Beyotime, Shanghai, China) to observed the percent of Alkaline phosphatase (ALP) positive cells and 1% Alizarin red S solution (Solarbio, Beijing, China) to visualize the extracellular matrix calcium deposition.
Quantitative real-time PCR Analysis
BMMs were cultured in 6-well plates at the density of 3 × 10⁵ cells/well in α-MEM supplemented with M-CSF (30 ng/ml), RANKL (50 ng/ml). The cells were then treated with or without 25nM DZNep for 0, 1, 3, 5 days, or with various concentrations of DZNEP (0, 6.25, 25 nM) for 5 days. Once the culture completed, the Axygen RNA Miniprep Kit (Axygen, Union City, CA, USA) was used to extract the total RNA. BMSC were seeded in a 6-well plate at a number of 4 × 10⁵ cells/well and treated with 0, 25, 50, 100 nM of DZNep combined with osteoblast cultured medium for 24 hours, or with or without 100nM DZNep combined with osteoblast cultured medium for 0 and 7 days. Once the culture completed, the Axygen RNA Miniprep Kit (Axygen, Union City, CA, USA) was used to extract the total RNA. After reverse transcription to obtain cDNA from the RNA template by using the Prime Script RT reagent Kit was finished. The real-time PCR assay was subsequently performed by using the SYBR® Premix Ex Taq™ II on an ABI 7500 Sequencing Detection System (Applied Biosystems, Foster City, CA). Specifically, total volume of 10 μl liquid consisted by 5 μl of SYBR® Premix Ex Taq™ II, 1 μl of diluted cDNA, 0.4 μl of mixed forward and reverse primer, and 3.6 μl of ddH2O was added into each hole of 384 PCR plate. Conditions of the 40 cycles were: 95 °C for 5 s and 60 °C for 30 s. The melting curves and reverse transcription PCR (RT-PCR) were the methods to detect the specificity of amplification product. Each target’s quantity, run in triplicate, was normalized to Actin Beta (Actb). Mouse Actb, CathepsinK (Ctsk), tartrate-resistant acid phosphatase/acid phosphatase (Trap/Acp5), nuclear factor of activated T-cells c1 (Nfatc1), AP-1 Transcription Factor Subunit (c-Fos), Mus musculus ATPase, H+ transporting, lysosomal V0 subunit D2 (Atp6v0d2), calcitonin receptor (Calcr), RUNX Family Transcription Factor 2 (Runx2), Wnt1, Wnt10a, Wnt4, Osteocalcin (Ocn), Wnt6, Osteopontin (Opn), and collagen type 1 alpha 1 (Col1a1), primer sequences are listed in Table 1.
Table 1
Primer pairs sequences against osteoclast gene used in qPCR.
|
Mouse Gene
|
Forward 5ʹ à 3ʹ
|
Reverse 5ʹ à 3ʹ
|
|
Trap/Acp5
|
CAAAGAGATCGCCAGAACCG
|
GAGACGTTGCCAAGGTGATC
|
|
Ctsk
|
CTTCCAATACGTGCAGCAGA
|
TCTTCAGGGCTTTCTCGTTC
|
|
Atp6v0d2
|
GCAGAGCTGTACTTCAATGTGG
|
TAGTCCGTGGTCTGGAGATG
|
|
Calcr
|
TCTGCGTTCCTGAGAACACC
|
AAGGCGCTCTAATGGCACTT
|
|
Nfatc1
|
TGCTCCTCCTCCTGCTGCTC
|
GCAGAAGGTGGAGGTGCAGC
|
|
c-Fos
Runx2
Ocn
Opn
Col1a1
Wnt1
Wnt4
Wnt6
Wnt10a
Foxc1
|
CCAGTCAAGAGCATCAGCAA
TGGCCGGGAATGATGAGAAC
GCGCTCTGTCTCTCTGACCT
TTTGTAGGCGGTCTTCAAGC
TAAGGGTCCCCAATGGTGAGA
ATAGCCTCCTCCACGAACCT
GAGCAACTGGCTGTACCTGG
GGTCACTCAAGCCTGTTCCA
CTGAACACCCGGCCATACTTC
CACTCGGTGCGGGAAATGT
|
AAGTAGTGCAGCCCGGAGTA
GGATGAGGAATGCGCCCTAA
TTTGTAGGCGGTCTTCAAGC
GTGAGATTCGTCAGATTCATCCG
GGGTCCCTCGACTCCTACAT
GATGAACGCTGTTTCTCGGC
GGAACTGGTACTGGCACTCC
CCGAAGTCCACATCGTCTCC
CTGAACACCCGGCCATACTTC
GTGCGGTACAGAGACTGACTG
|
|
Actb
|
ACAGCAGTTGGTTGGAGCAA
|
ACGCGACCATCCTCCTCTTA
|
Western Blotting Analysis
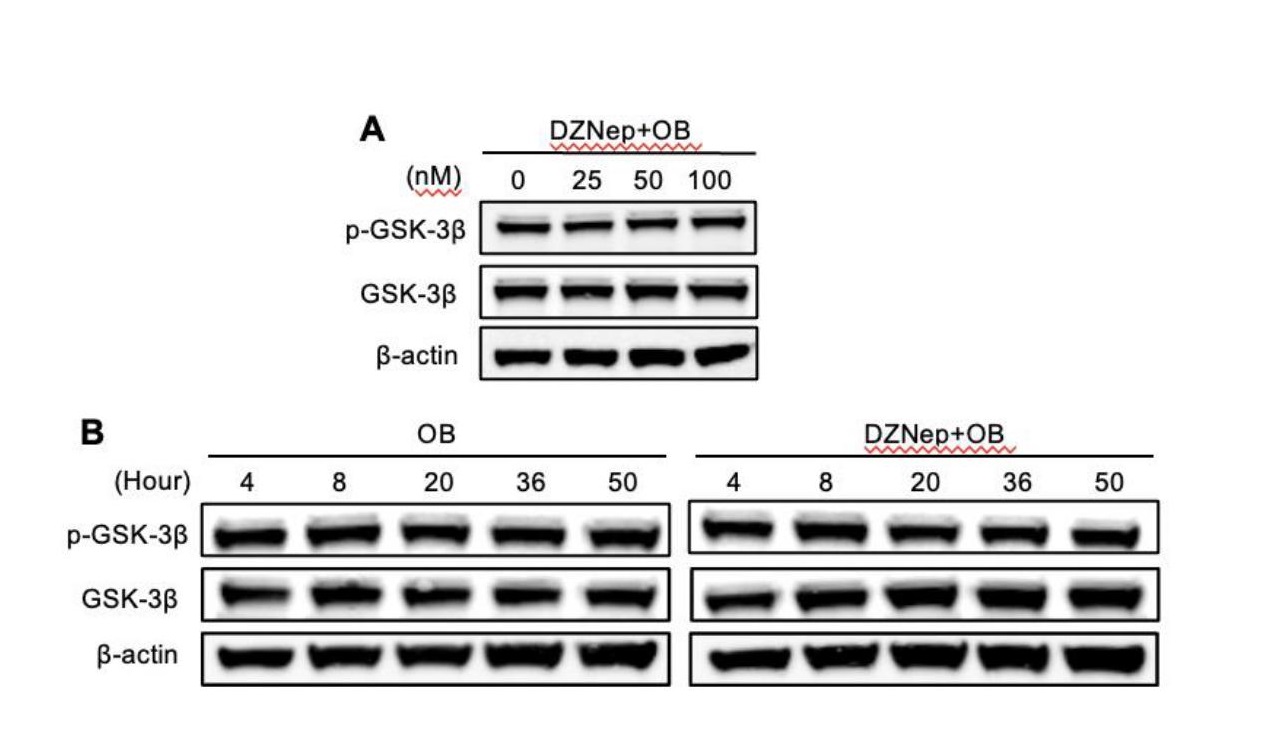
To explore the variation of the proteins on long-term activated signaling, BMMs were cultured in α-MEM containing M-CSF (30 ng/ml) and RANKL (50 ng/ml) at a density of 2 × 10⁵ cells/well on 6-well plates. After 24 hours, the BMMs were treated with or without 25 nM DZNep for 0, 1, 3, and 5 days, and total protein was obtained respectively on these specific time points. To determine the effect of DZNep on the protein of short-time activated phosphorylated, RAW264.7 cells were cultured in α-MEM at a density of 5 × 10⁵ cells/well on 6-well plates. One day later, the cells were treated with the serum-free α-MEM in the presence or absence of DZNEP for 3h, then stimulated with 50 ng/mL RANKL for 0, 10, 20, 30, and 60 mins. To identify the role of DZNep on the EZH2 and H3K27me2 in osteoblasts, BMSC cells were cultured with α-MEM supplemented 10% FBS at a density of 5 × 10⁵ cells/well on 6-well plates. After one day, different doses of DZNEP were treated on the cells for 4h, then osteoblast cultured medium was added for another 24 hours. Afterward, the cells were washed by the phosphate-buffered saline (PBS), total protein of the cells was extracted by using lysate consisting of protease, phosphorylase inhibitor cocktail (Sigma-Aldrich), and radioimmunoprecipitation assay (RIPA) lysis buffer (Beyotime, Shanghai, China). After centrifuged at 13,000 x g for 15 min, the bicinchoninic acid (BCA) assay was then used to detect the concentrations of the protein in the supernatant. Finally, the supernatant proteins were diluted by 5×SDS-sample loading buffer and separated by 4-20% SDS-PAGE before transferred to nitrocellulose filter membranes (GE Healthcare Life Sciences, Pittsburgh, PA, USA). The 5% skim milk dissolved in 1 × TBST (Tris-buffered saline with Tween 20) were used to block the membranes at room temperature for 1 h. And the primary antibodies (β-actin, 1:1000; LaminB, 1:1000; ERK, 1:1000; p-ERK, 1:1000; JNK, 1:1000; p-JNK, 1:1000; p38, 1:1000; p-p38, 1:1000; IKKβ, 1:1000; p-IKKα/β, 1:500; IκBα, 1:1000; p- IκBα, 1:1000; P65, 1:1000; p-P65, 1:500; NFATc1, 1:500; c-FOS, 1:1000; EZH2, 1:1000; H3K27me3, 1:1000; GSK-3β, 1:1000; and p-GSK-3β, 1:1000;) were then incubated with the membranes together overnight at 4 °C. After TBST wash for 3 times, the secondary fluorescence antibodies were incubated without light for 1 h at room temperature and the reactivity was visualized by using Odyssey V3.0 image scanning (Li-COR. Inc., Lincoln, NE, USA).
Osteoblasts and osteoclasts co-cultivation
For the osteoblasts and osteoclasts co-culture system, calvarial OB isolated from day 1-3 pups were cultured for 24 hours. Then the calvarial OB with complete α-MEM (α-MEM supplemented with 10% FBS, 1% penicillin/streptomycin) were seeded into 24 well plates at a density of 2 × 10⁴ cells/well. After 3 days of cultivation, the medium was replaced by the complete α-MEM containing 50ng/ml Ascorbic acid and 5mM β-glycerophosphate. On the same day, bone marrow monocytes were isolated from bone marrow and cultured in 10cm dish. Another 3 days later, BMMs were seeded at a density of 4 × 10⁴ cells/well into the 24-well plate containing the calvarial OB, and the α-MEM supplemented with 15% FBS, 1% penicillin/streptomycin, 1, 25-dihydroxy vitamin D3 (10 nM; CSN), and PGE2 (1 μM; CSN). After changed every 3 days for 2 times of the culture medium, the cells were then fixed and stained to observe the percent of the positive ALP staining area using a kit according to the manufacturer’s instructions (Beyotime, Shanghai, China). The percent of area was then quantified using Image J.
Tibia cortical and trabecular bone defect mice model
This study was totally carried out in terms of the guidelines for the Ethical Conduct in the Care and Use of Nonhuman Animals in Research by the American Psychological Association. Moreover, the Animal Care and Experiment Committee of Shanghai Jiao Tong University School of Medicine approved the animal experiment of this research.
The tibia cortical and trabecular bone defect mice model was established to determine the bone healing effect of DZNep in vivo. Firstly, all mice (twelve 8-week-old C57/BL6 male mice (approximate weight 20± 2g)) were anesthetized by 2% isoflurane, the right tibia was exposed and muscles were dissociated. Then a pilot hole was first made with a burr drill point in the proximal tibia, but away from the growth plate to some extent. Then the hole was enlarged with a 1 mm reamer. Afterward, the mice were average divided into two groups: (1) DZNep group (injection with 100μg/kg DZNep); (2) Sham group (injection with 1× PBS). Two days after operation, 1× PBS for sham group and DZNep for treatment group were intraperitoneally injected every two days during next two week. All mice were finally euthanized after experiment, and whole tibia bones were separated. After fixed in 4% paraformaldehyde for 24 hours, the 75% ethanol were then used to soak the specimens for further histological and radiographic analysis.
Micro-Computed Tomography scanning
High-resolution micro-CT (μCT-100, SCANCO Medical AG, Switzerland) was used to perform the micro-computed tomography (CT) scanning. Scans were conducted in 75% ethanol and used an X-ray intensity of 200 uA, an X-ray tube potential of 70 kVp, and an integration time of 300 ms. For analysis bone mass of defect section, a region of defect section trabecular bone was contoured, starting from the first defect section level away from proximal end of the distal femoral growth plate. Femoral trabecular bone was thresholded at 211 per mille. The indicators of bone microstructure (bone volume/tissue volume (BV/TV), trabecular thickness (Tb.Th), trabecula number (Tb.N), trabecula separation (Tb.Sp), and bone surface/ bone volume (BS/BV)) were measured by software (Version: 6.5-3, SCANCO Medical AG, Switzerland) through evaluating and analing the three-dimensional region of interest (ROI).
Histological analysis
After fixing in 4% paraformaldehyde for 48 hours, the 10% EDTA was used to decalcify the fixed tibias for 21 days. Then the tissues were processed by dehydrating in different concentrations of ethanol, infiltrating with xylene, and embedding with paraffin. Hematoxylin and eosin (H&E) and TRAP staining were then performed on these prepared histological sections. As for immunofluorescent staining, slices were processed in a sequence of deparaffinization, hydration, antigen retrieval, permeabilization, blocking, primary antibody incubation (OCN, USA, Affinity; dilution 1:100), secondary antibody incubation, and nuclear staining finally. The specimens were observed and photographed under the high-quality microscope (Leica DM4000B). Each sample’s number of osteoclasts, TRAP-positive multinucleated osteoclasts per field (Oc.S/BS) were calculated.
Statistical analysis
The results were analyzed by using Prism 8 (GraphPad Software Inc, San Diego, CA, USA). The data were uniformly presented in the form of median and interquartile range. The comparisons between experimental and control groups were made by the 2-tailed, unpaired Student’s t test, One-way ANOVA with turkey‘s post hoc-test. Statistical significant were determined to be at *p < 0.05; **p < 0.01; ***p <0.001; ****p <0.0001.