Evaluation of BPH resistance
In this study, a genomic fragment containing BPH6 with its native promoter was transferred into the BPH susceptible wild type (WT) japonica variety Nipporebare, and got BPH6-trancgenic plants (BPH6G). The homozygous T2 transgenic lines were analyzed for BPH resistance using the bulk seedling test. WT plants began to wither on the 4th day and died on the 7th day after BPH infestation, but the BPH6G plants were still alive (Fig. 1A). In the BPH host choice test, the average number of BPHs settled on WT increased rapidly from 6 to 48 hours, whereas those on the BPH6G lines remained relatively constant over 72 hours (Fig. 1B). Moreover, the ratio of weight gain was significantly less for BPH fed on the BPH6G plants than those on WT from 12 to 72 hours (P < 0.01 at 12 hours) (Fig. 1C).
Phytohormone, such as salicylic acid, JA-Ile and cis-zeatin were induced to high levels from 3 to 24 hours after BPH infestation in the BPH6-transgenic plants compared to Nipponbare [11]. Phytohormone synthesis-related genes, PAL (phenylalanine ammonia-lyase), AOS2 (allene oxide synthase 2) and IPT10 (isopentenyl-transferase 10) were selected for expression analysis in BPH6G and WT plants after BPH infestation. Expression of PAL and IPT10 increased more rapidly in the BPH6G plants from 6 to 24 hours, whilst the expression levels of AOS2 increased after 48 hours in both plants (Fig. 1D-F). These results demonstrate that the BPH6G plants were resistant to BPH, and defense establishment and significant progression exists up to 48 hours after BPH infestation. Therefore, RNA was isolated from the leaf sheathes of the BPH6G and WT plants from 0 to 72 hours after BPH feeding, and divided into non-infested controls (0 hour), early feeding stages (including 6, 12 and 24 hours), and late feeding stages (including 48, 60 and 72 hours) for high-throughput sequencing analysis.
Small RNA library construction and sequencing
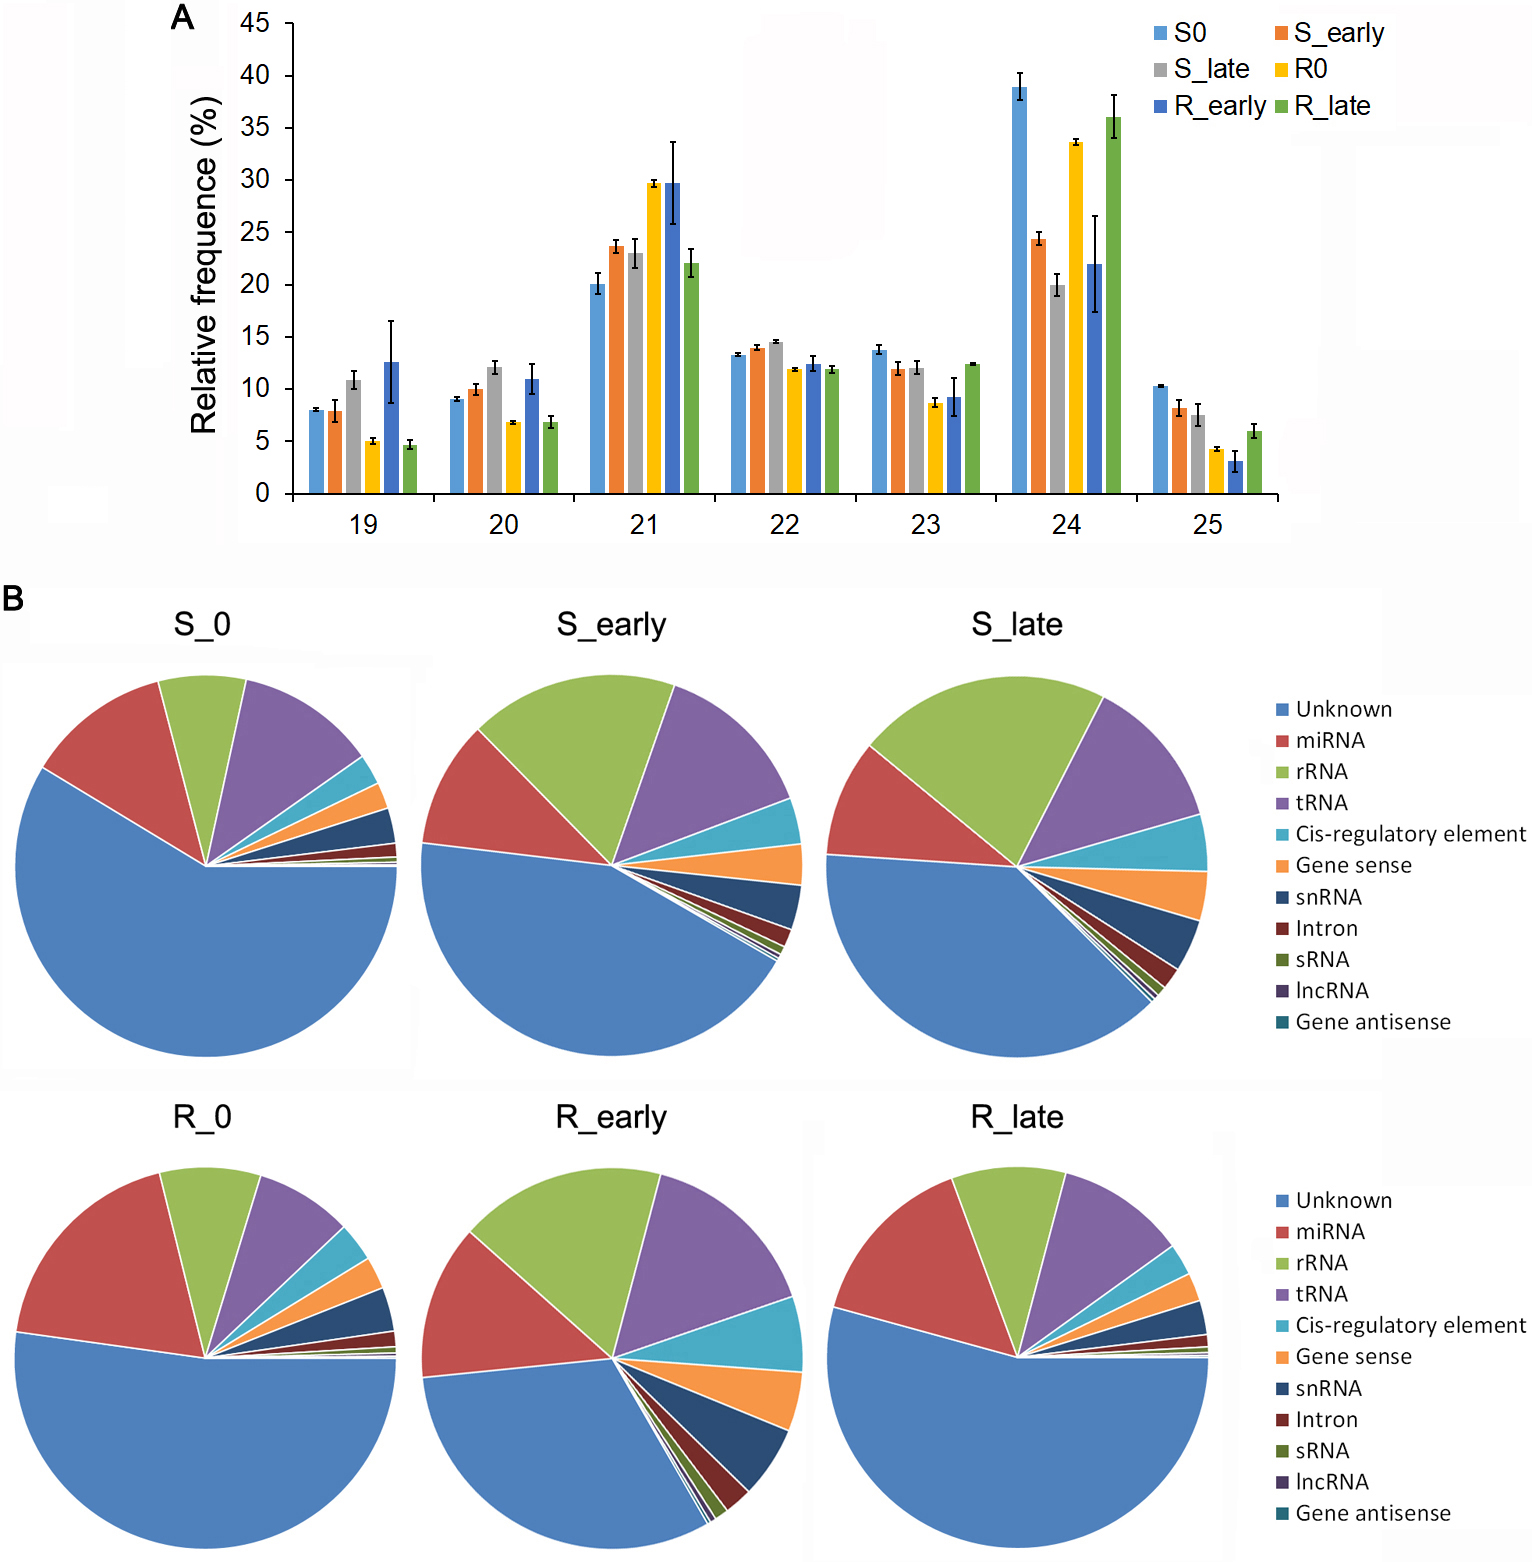
A total of 18 small RNA libraries were constructed with the BPH6G plants (R) and WT (S) infested by BPH for non-infested (R0, S0), early feeding stages (R_early, S_early) and late feeding stages (R_late, S_late), using high-throughput RNA sequencing. Total reads of 10,765,888-13,036,033 (S0), 9,506,071-11,149,266 (S_early), and 10,146,511-12,854,519 (S_late), 9,416,313-12,417,777 (R0), 9,034,925-12,520,216 (R_early) and 9,289,358-14,016,694 (R_late) were got respectively (Additional file 1: Table S1). After removing all low-quality reads, poly A, incorrect adaptors and reads of < 20 nt and > 24 nt, a total of 6,507,818-8,291,591, 4,503,508-4,875,946, 5,052,571-5,914,336, 6,130,761-8,119,955, 4,778,110-5,215,770 and 5,639,456-8,547,717 clean reads remained in the S0, S_early, S_late, R0, R_early and R_late libraries, respectively (Additional file 1: Table S1). In the 18 libraries, the main size classes were 21 nt and 24 nt followed by 22 nt and 23 nt as previously reported for rice small RNAs (Additional file 2: Fig. S1A). All of the sequences were aligned in the GenBank and Rfam database, and mapped to the rice genome to identify and remove rRNA, tRNA, scRNA, snoRNA, snRNA and small RNAs mapped to exons or introns and repeat sequences (Additional file 2: Fig. S1B). Approximately 20.16-23.09% (S0), 23.68-26.35% (S_early), 19.88-24.39% (S_late), 30.66-31.04% (R0), 31.37-35.58% (R_early) and 23.57-23.67% (R_late) of the clean reads were assigned to the miRBase database (Additional file 1: Table S1). Rice miRNA is the most thoroughly studied monocot miRNA, and 738 mature miRNAs were identified in the miRbase (release 22). Accordingly, we analyzed the 738 known miRNAs in our data.
DEMs in the BPH6G and WT plants before and after BPH feeding
After normalization of the raw sequence reads, the average normalized reads of three independent biological replicates in the libraries were chosen for further analysis. The expression levels of miRNAs were compared amongst the different groups. Using fold changes ≥ 2, P < 0.05 of the average value of three replicates, 231 DEMs were detected, including 119 DEMs between the different varieties and 217 DEMs between different feeding stages (Fig. 2A-B). In the early feeding stages, there were more DEMs in WT (89) than in the BPH6G plants (61) (Fig. 2A). In the late feeding stages, the number of up-regulated DEMs (92) were four folds higher than down-regulated ones in WT (Fig. 2A), indicating that serious damage was caused by BPH. In the BPH6G plants, 18 DEMs appeared in two of the comparisons (R_early/R0 and R_late/R0), whilst 61 DEMs appeared in both S_early/S0 and S_late/S0 (Fig. 2B), suggesting a lower number of miRNAs were involved in BPH defense responses in the BPH6G plants.
To verify the data in miRNA sequencing, six DEMs were selected for quantitative stem-loop RT-PCR assays [32]. The results were broadly consistent to those from sequencing analysis, although expression of some miRNAs differed a little (Fig. 2C).
Identification of miRNAs related to BPH resistance
miRNA expression differences in BPH resistant and susceptible rice before BPH attack was first compared. There were 55 DEMs, including 24 up-regulated and 31 down-regulated miRNAs in R0/S0 (Fig. 2A), many of which belonged to known miRNA families including miR156, miRNA160, miR166, miR169, miR1846, miR1861 and miR319 (Additional file 3: Table S2). Members of the miRNA families were reported to be involved not only in growth, development, grain size and hormone signaling, but also in response to biotic and abiotic stress. These BPH6 responsive DEMs might be involved in response to BPH.
To identify miRNAs related to plant resistance responses, Venn diagrams were used to show the DEMs appeared in the BPH6G plants compared to WT (R0/S0, R_early/S_early and R_late/S_late) (Fig. 2B). There were 23 overlapping DEMs in the comparisons (Fig. 2B), 18 of which showed opposite expression before and after BPH feeding (Fig. 3A, Additional file 3: Table S2). Members of the miR169 family were up-regulated before BPH feeding (R0/S0) and down-regulated after BPH feeding (R_early/S_early or R_late/S_late). In contrast, members of miR160 and miR166 families were down-regulated in R0/S0 and up-regulated in R_early/S_early or R_late/S_late. These results indicate that the roles of the members of the miR160, miR166 and miR169 families in BPH response are consistent with their respective roles in pathogen defense [24-26].
The DEMs in early and late feeding stages of the two varieties (S_early/S0, S_late/S0, R_early/R0 and R_late/R0) were analyzed by Venn diagrams (Fig. 2B). A total of 63 DEMs were expressed in R_early/R0 or R_late/R0 and 9 specifically expressed in both R_early/R0 and R_late/R0 (Fig. 2B). Furthermore, 29 DEMs were opposite expressed in BPH6G and WT plants after BPH feeding (Fig 3B, Additional file 4: Table S3). These results suggest that these miRNAs were associated with rice resistance against BPH. Among them, members of the miR169 family, miR156b-3p and miR396c-5p were down-regulated, whilst members of the miR160 and miR166 families were up-regulated in BPH6-trangenic plants, further suggesting that miRNAs play an important role in rice immunity against BPH. In addition, members of miR1861 and miR319, and other miRNAs appeared opposite expression in BPH6G and WT plants after BPH feeding, or were specifically expressed in both R_early/R0 and R_late/R0 (Fig. 3B), suggesting their involvement in BPH6-mediated resistance to BPH.
General mRNA expression profiles
mRNA libraries were constructed to analyze gene expression and to profile all miRNA targets that were differentially expressed in response to BPH feeding. Total reads of 95,904,402-107,440,012 (S0), 95,975,518-111,697,630 (S_early), 104,064,522-110,801,772 (S_late), 95,834,398-110,390,690 (R0), 95,471,364-108,706,076 (R_early) and 95,908,290-110,627,486 (R_late) were sequenced from mRNA libraries. After deletion of low-quality reads in samples from the BPH6G plants, 84.70-89.99% of the reads were mapped to 28,988-30,383 rice genes (Additional file 5: Table S4). In the replicates from WT, 82.67-90.84% of the reads were mapped to 28,838-30,006 rice genes (Additional file 5: Table S4).
Considering that some reference genes are suppressed in host-herbivore interaction [33], we carefully selected reference genes with stable expression during BPH infestation for qRT-PCR analysis. Eight frequently used reference genes, eEF1α (Os03g08020), GAPDH (Os02g38920), SDHA (Os07g0424), TBP (Os03g45410), HSP (Os03g31300), β-tubulin (Os03g56810), Ubiquitin (Os03g03920) and LSD1 (Os12g41700) were selected to evaluate the respective FPKM values extracted from our RNA-seq data (Fig. 4A). eEF1α, GAPDH and β-tubulin were significantly reduced in S_late and R_late, and LSD1 was stable but relatively low. Combined with our previous results [11, 33], TBP was used as the reference gene for qRT-PCR analysis.
DEGs in the BPH6G and WT plants before and after BPH feeding
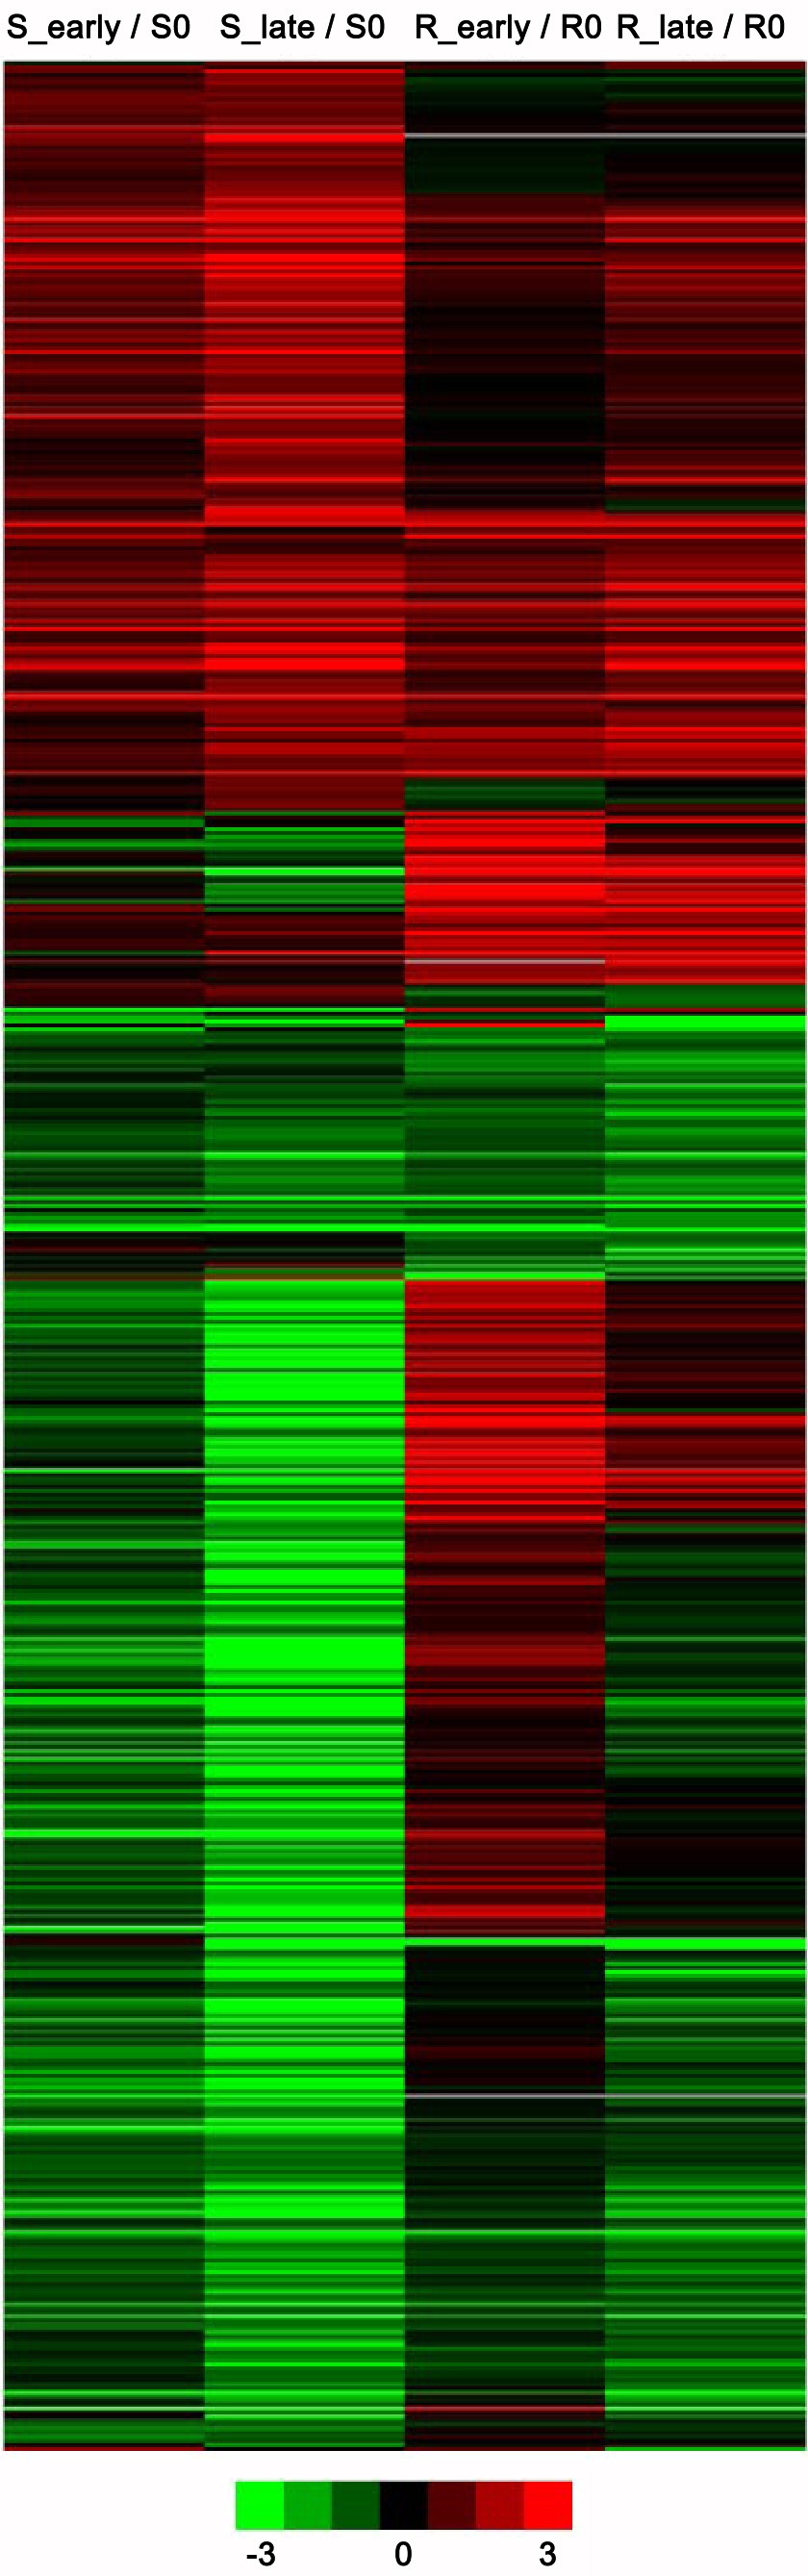
To identify genes that were differentially expressed under BPH infestation, EB-Seq algorithm was used to filter the DEGs between various groups based on significance analysis, P-values and FDR analysis [34]. There were 8,577 DEGs (log2FC ≥ 1, FDR < 0.05) detected in this, including 4,608 between the different varieties and 7,874 between different feeding stages (Table 1). DEGs in the BPH6G and WT plants at different feeding stages were hierarchically clustered. Amongst the four comparisons, the expression patterns of the DEGs were similar, showing consistent up- or down-regulation (Additional file 6: Fig S2).
During early feeding stages, more DEGs were up-regulated in BPH6G plants (1,851) compared to WT (965) (Table 1), and the numbers with FCs ≥ 5 were more in BPH6G plants (590) than in the WT (184), suggesting that the inducible defense response against BPH in BPH6G plants was more robust than in WT at the mRNA level. Up-regulated DEGs (1,851) were three-fold more than down-regulated ones (657), and the number of up-regulated DEGs with FCs ≥ 5 (590) were six-fold more than down-regulated ones (94) in the BPH6G plants, suggesting that the expression of genes associated with resistance in the BPH6G plants was up-regulated. During late feeding stages, the number of up-regulated DEGs (1,356) were similar to that of down-regulated ones (1,569) in BPH6G plants. However, during early feeding stages, the down-regulated DEGs (1,952) were almost two-fold more than up-regulated ones (965) in WT, indicating the response to BPH-induced wounding and physiological stresses. During late feeding stages, the number of DEGs in WT dramatically increased from 2,917 to 6,394, and the number with FCs ≥ 5 increased remarkably from 549 to 2,854, indicating more serious damage to rice plants caused by BPH.
To verify the RNA-seq data, 30 DEGs were selected for qRT-PCR analysis. The results indicated similar fold-changes with a correlation ratio of R2 = 0.968 (Fig. 4B). The similar percentage of mapped reads, the similar number of mapped genes and the similar expression of the genes indicate that these mRNA libraries are suitable for further comparative gene expression analysis.
Identification of genes related to BPH resistance
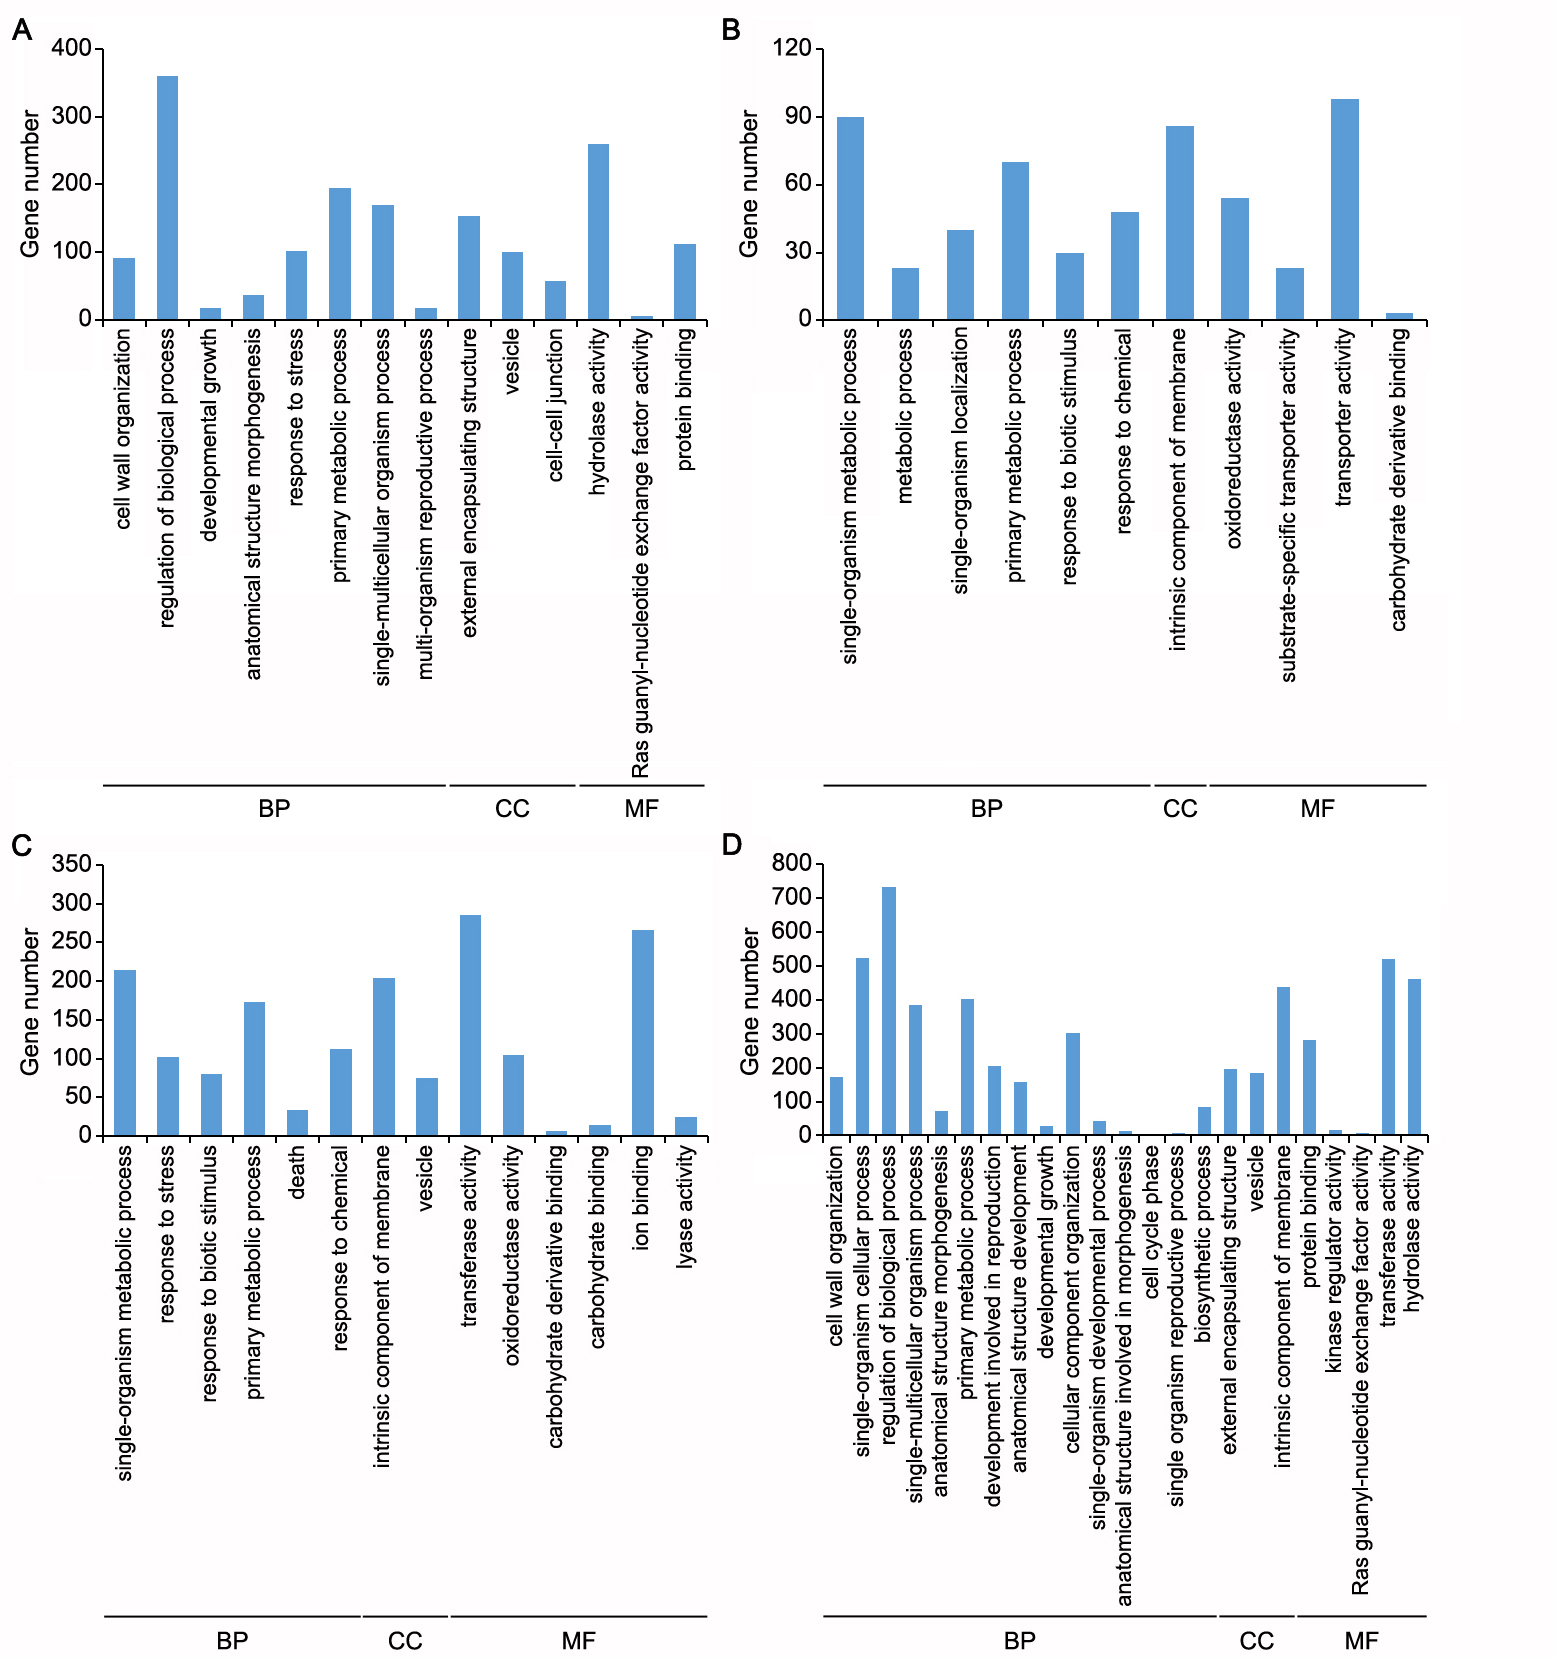
To investigate the function of BPH6, the sequencing data of BPH6G and WT plants before BPH feeding were compared. There were 3,327 DEGs with FC ≥ 2, including 649 up-regulated and 2,678 down-regulated ones (Table 1). To explore the functions of these DEGs, GO (gene ontology) enrichment analysis were performed. The up-regulated genes were enriched in defense, protein modification and protein targeting to membrane. Down-regulated genes were enriched in the regulation of transcription, signal transduction, cell wall organization and cell proliferation. In addition, these DEGs were enriched in plasma membrane, extracellular region, and cell wall for cellular component (Fig 5A-B). These results indicate that BPH6 also takes part in other developmental and physiological process besides defense and stress.
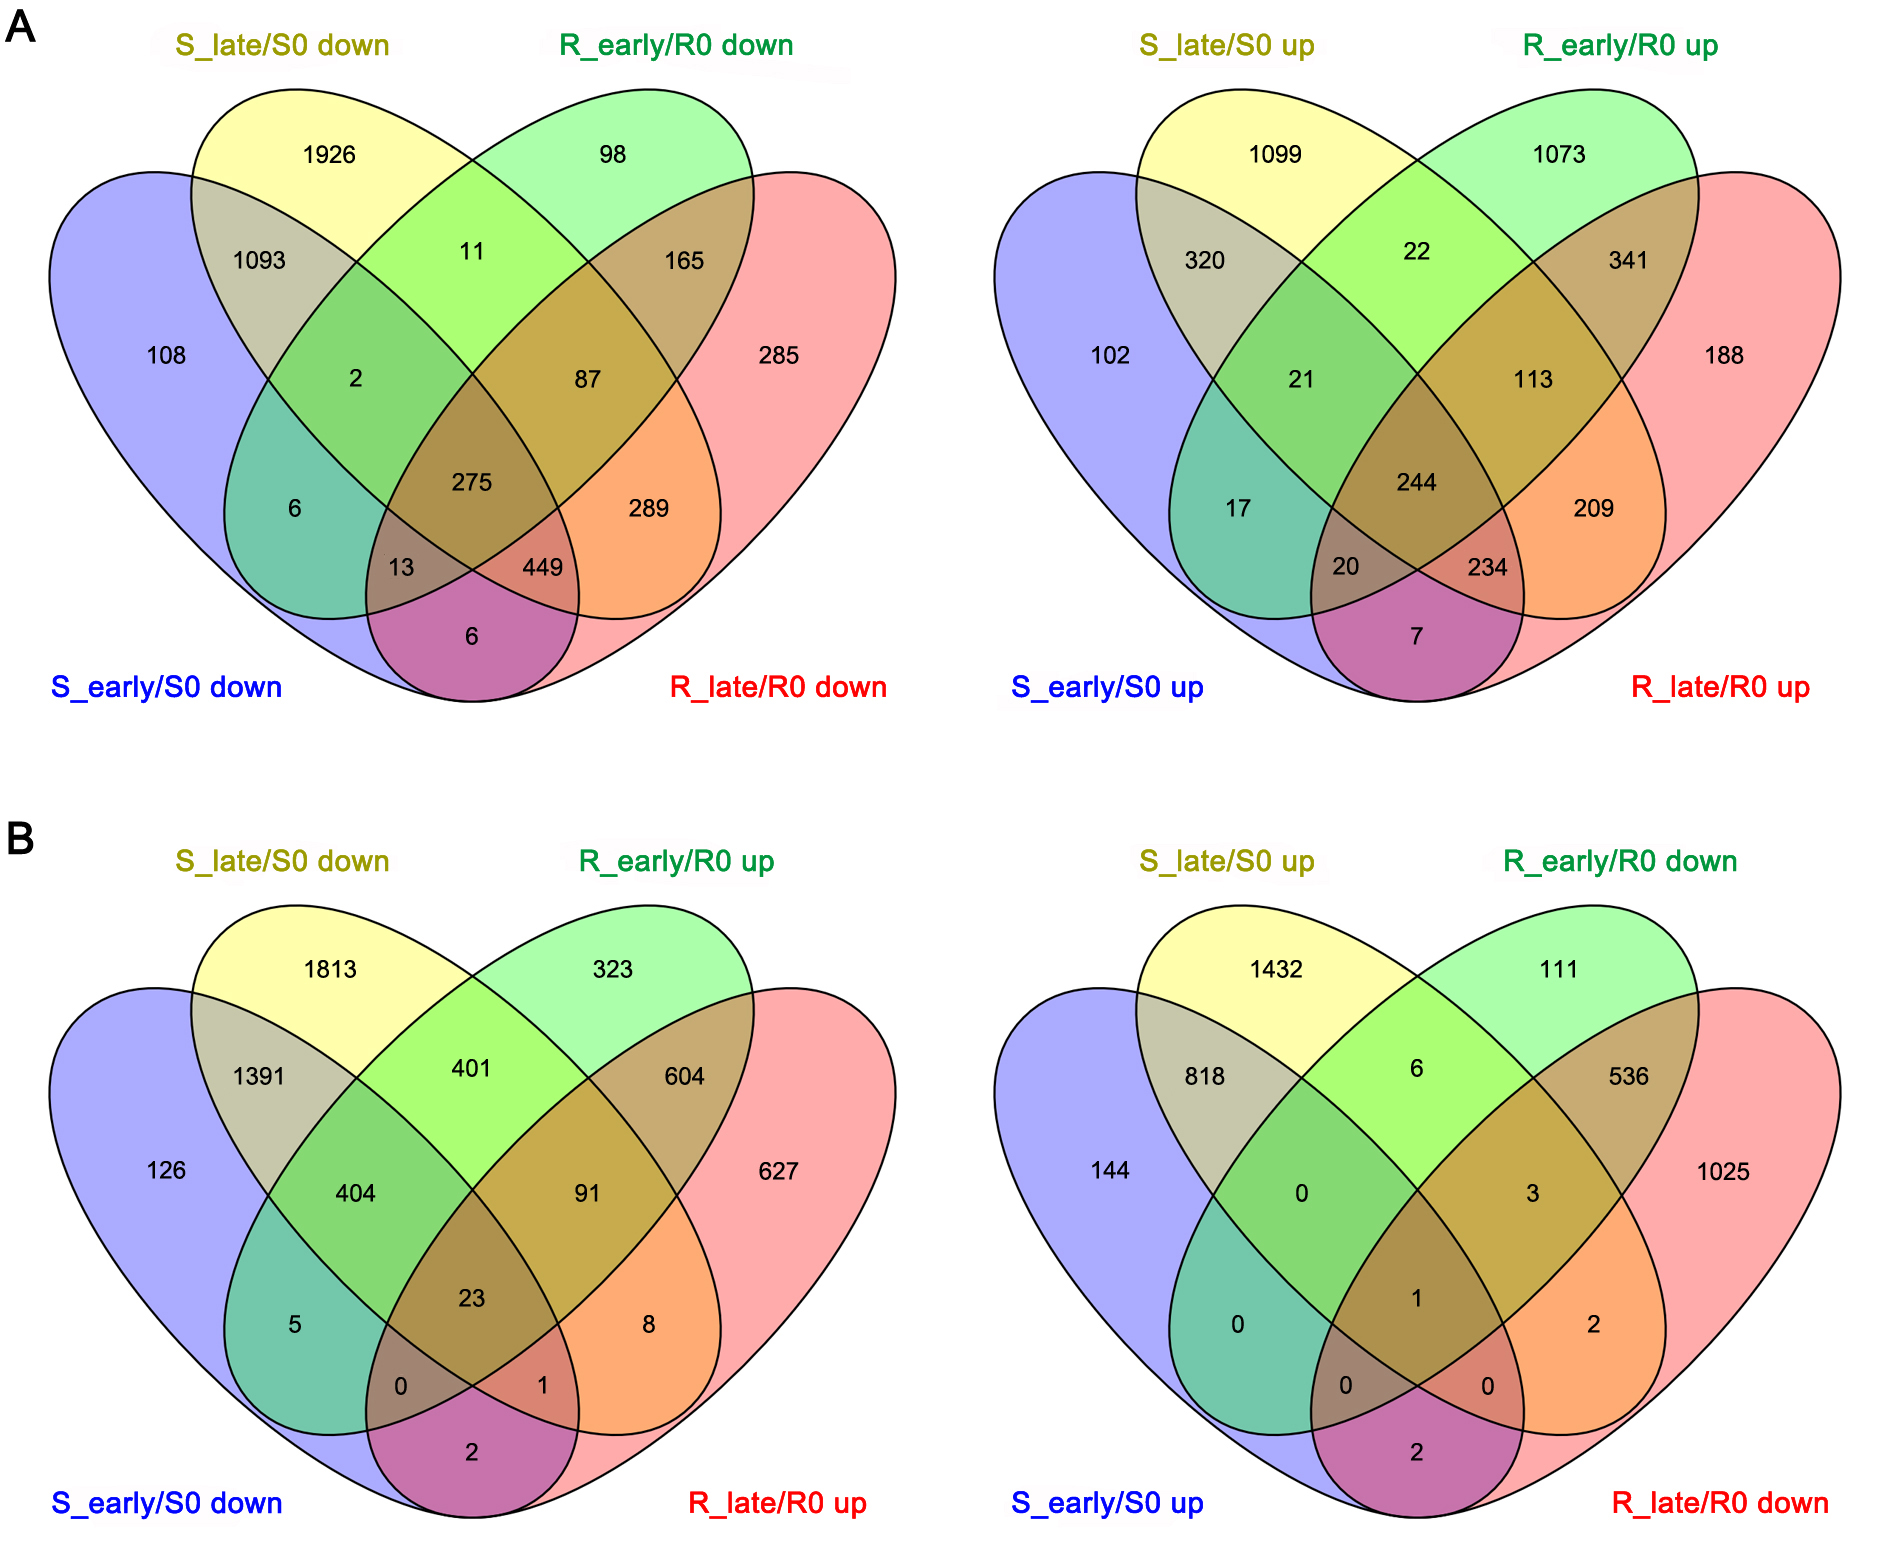
Next, Venn diagrams were used to analyze the possible BPH resistance-related genes in the DEGs of the two rice genotypes. In the BPH6G plants, there were 548 and 1,572 DEGs down- and up-regulated respectively after BPH feeding; while in WT, 3,127 and 1,521 DEGs were respectively down- and up-regulated after BPH feeding (Additional file 7: Fig. S3A). To fully understand the function of these DEGs, GO enrichment analysis were performed. When the biological processes were considered, the up-regulated genes in the BPH6G plants and the down-regulated genes in WT were both enriched in cell wall organization or biogenesis, regulation of biological process, developmental growth, anatomical structure morphogenesis and single-multicellular organism process (Additional file 8: Fig. S4A, D). Down-regulated genes in the BPH6G plants and up-regulated genes in WT were both enriched in single-organism metabolic process, primary metabolic process and response to biotic stimulus and chemical (Additional file 8: Fig. S4B, C). Genes associated with hydrolase activity, Ras guanyl-nucleotide exchange factor activity and protein binding were most contrasting amongst the molecular function GO terms in the two rice varieties (Additional file 8: Fig. S4). Three cellular components of GO terms, external encapsulating structure, vesicle and intrinsic component of membrane were enriched, suggesting involvement of cell wall, vesicle and plant membrane in the response to BPH feeding (Additional file 8: Fig. S4).
To further streamline potential BPH resistance-related genes, the opposite expression DEGs during early and late feeding stages of two varieties were assessed. There were 949 DEGs in the BPH6G and WT plants after BPH feeding, of which, 935 were up-regulated in the BPH6G plants and down-regulated in WT, whilst 14 were down-regulated in the BPH6G plants and up-regulated in WT, suggesting that the majority positively regulate rice immunity against BPH (Additional file 7: Fig. S3B). GO enrichment analysis indicated that these resistance-related genes were enriched in metabolic process, cellular development, cell wall organization, cellular component movement and hormone transport for biological process, and membrane-bounded vesicle and cell wall for cellular component (Fig. 5C). These results suggest that BPH6 confers resistance to BPH by participating in hormone regulation, protein modification, transport to the membrane, the cell wall and the extracellular region. For further information regarding the molecular and biochemical responses of rice after BPH infestation, BPH responsive DEGs were combined with KEGG processes (Kyoto Encyclopedia of Genes and Genomes). At the P < 0.05, the BPH responsive DEGs were enriched in key pathways. The up-regulated DEGs were involved in primary and secondary metabolite processes, such as limonene and pinene degradation, starch and sucrose metabolism, stilbenoid, diarylheptanoid and gingerol biosynthesis, and brassinosteroid biosynthesis, suggesting that these metabolites play important roles in rice defense against BPH. In contrast, amino and nucleotide sugar metabolism and diterpenoid biosynthesis were remarkably enriched among the down-regulated genes (Additional file 9: Table S5). Finally, 24 genes were differentially expressed in both the BPH6G and WT plants after BPH feeding, and were considered BPH resistance-related genes (Table 2). Of these DEGs, 23 were dramatically up-regulated in the BPH6G plants and down-regulated in WT after BPH infestation. A single gene was down-regulated in the BPH6G plants and up-regulated in WT. Among them, two genes encoding germin-like proteins, two lipid transfer proteins, two cytochrome P450 family proteins and two Rop guanine nucleotide exchange factors played important roles against BPH. The majority of these genes were enriched in response to stress, transport, cell wall organization, Rho GTPase activity and oxidation-reduction process, and were enriched in the extracellular region, cell wall, membrane and nucleus (Table 2).
Integrated analysis of miRNA and mRNA expression profiles
In most cases, miRNAs negatively regulate target mRNA through translation repression or mRNA degradation [19]. To correlate the identified miRNAs with their target genes, the psRNA target tool was used to predict miRNA targets on mRNAs using the parameters fold changes ≥ 2, P < 0.05 [35]. There were 89, 117, 61 and 92 DEMs that significantly and negatively correlated with 488, 1,096, 235 and 498 target mRNAs in S_early/S0, S_late/S0, R_early/R0 and R_late/R0, respectively (Fig 2A). In addition, 55, 24 and 70 DEMs negatively correlated with 269, 88 and 369 target mRNAs in R0/S0, R_early/S_early and R_late/S_late, respectively (Fig. 2A).
To identify potential miRNA-mRNA pairs related to BPH resistance, 70 DEMs in R_early/R0 or R_late/R0 (Fig. 2B) and 29 DEMs at different feeding stages (Fig. 3B) were selected and negatively correlated with 656 target mRNAs (Additional file 10: Table S6). These miRNAs target different mRNAs during each feeding stage. For example, miR156b-3p was up-regulated in S_early/S0 and down-regulated in R_late/R0, which negatively correlated with 20 down-regulated target genes in S_early/S0 and 4 up-regulated ones in R_late/R0, respectively. However, the majority of these targets showed a similar trend of expression in the BPH6G and WT plants after BPH feeding (Additional file 10: Table S6). Excluding these miRNAs and their corresponding targets, 34 miRNAs corresponding to 42 target genes were differentially expressed in R_early/R0 or R_late/R0, or opposite expressed in the BPH6G and WT plants after BPH feeding, and selected as BPH resistance-related miRNA-mRNA candidates (Table 3). Among them, three miRNA families and targets could respond to BPH feeding. Members of the miR169 family and their targets are involved in defense responses, whilst members of miR1861 family and their targets are involved in plant growth and auxin regulation. Members of the miR818 family and their targets are involved in stress responses, cell wall organization and flavonoid biosynthesis. In addition, miR156b-3p and its targets participate in plasma membrane and cell wall organization, whilst miR396c-5p and its targets are involved in ABA regulation and disease resistance, and miR5513 and its targets respond to ethylene and brassinosteroid.
To validate whether these miRNAs negatively regulate target expression, four miRNAs and their targets were selected for qRT-PCR verification. The results indicated that miR156b-3p negatively regulated LOC_Os02g40440 and LOC_Os03g06940 in S_early/S0, and LOC_Os07g05370 in R_late/R0, miR396c-5p negatively regulated LOC_Os02g47470, LOC_Os03g21800 and LOC_Os03g47140 in R_late/R0, and miR169g/o and miR2871a-3p negatively regulated LOC_Os07g31840. Furthermore, three target genes (LOC_Os05g38980, LOC_Os07g46560 and LOC_Os11g36180) were down-regulated by miR169i-5p.2 in S_early/S0 and S_late/S0, up-regulated in R_early/R0, while unaffected in R_late/R0 (Fig. 6A).
miR156b-3p and miR169i-5p.2 with their targets encoding GDSL-like lipase (GDSL/LOC_Os02g40440) and Leucine Rich Repeat family protein (LRR/LOC_Os11g36180) respectively were selected for validation in rice protoplasts. Two plasmids of each pair, one encoding pri-miRNA, and the other YFP and HA fused target, were transfected into the protoplasts. In both cases, the inflorescence signal of the blank YFP plasmid could not be weakened by the pri-miRNAs, however, that of the targets could be significantly weakened by the respective pri-miRNAs (Fig. 6B). Western blot verified the results of the YFP signal at the protein level (Fig. 6C). These results indicate that miR156b-3p and miR169i-5p.2 down-regulate GDSL and LRR expression in rice cells, respectively.