Expressions and localization of B7-H3, B7-H4, and HHLA2 in PC tissues
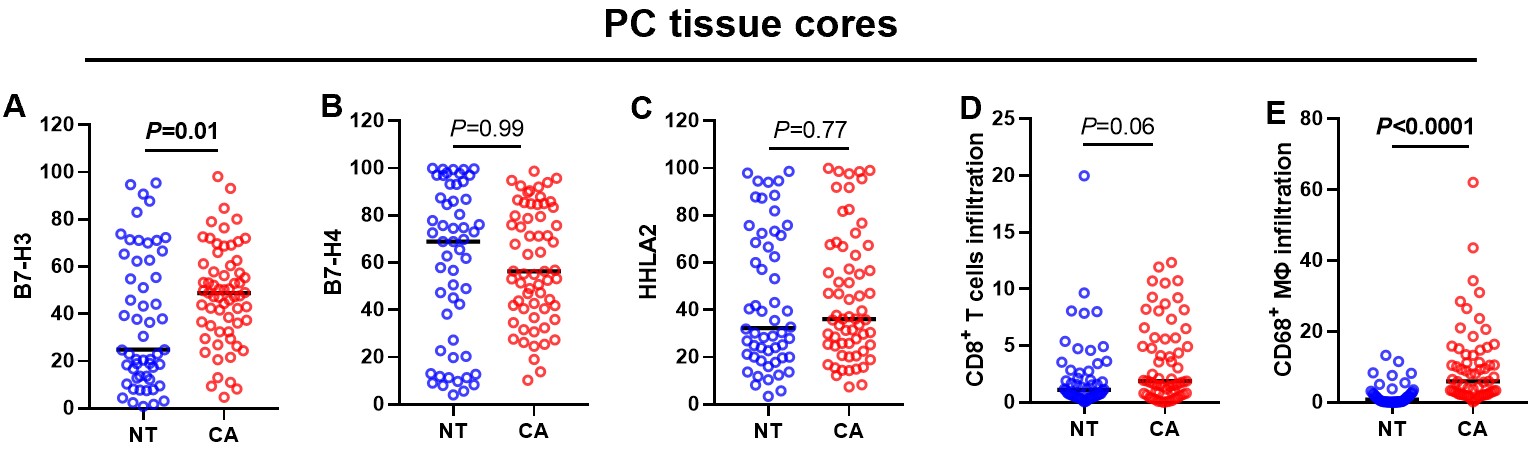
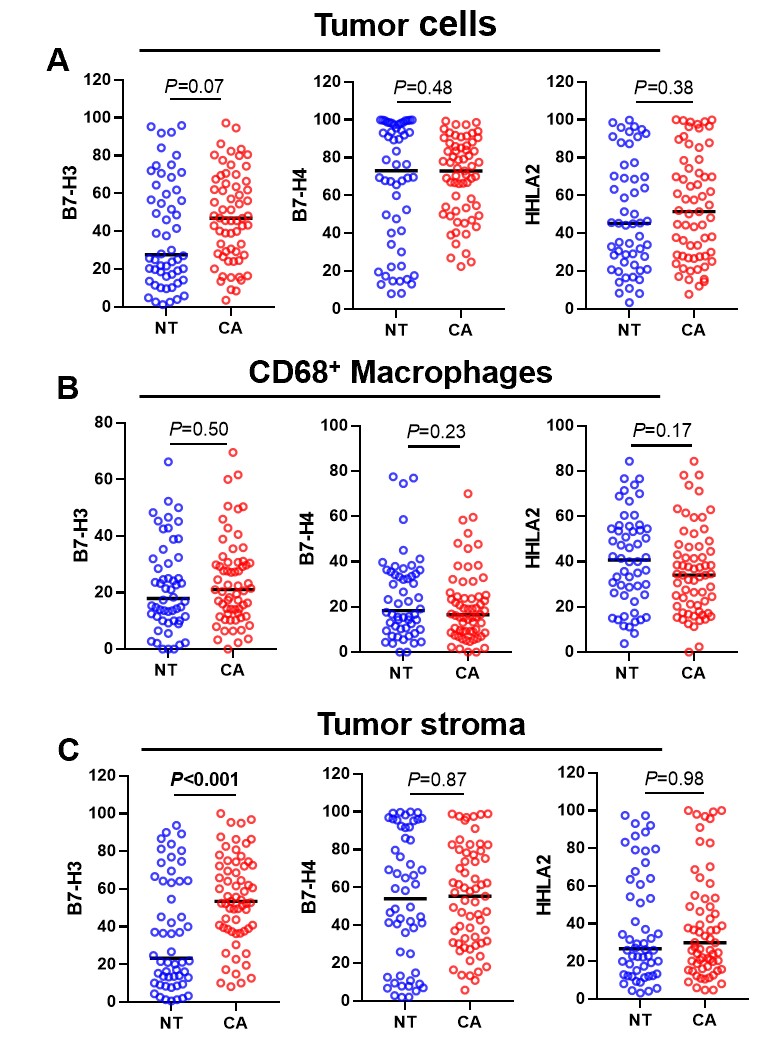
In the present study, we examined the localization of B7-H3, B7-H4, HHLA2, CD8, and CD68 in 63 cases of PC tissues by using mIHC. Figure 1 shows that the expressions of B7-H3, B7-H4, and HHLA2 could be predominantly detected on the membrane and in the cytoplasm of cancer cells, stromal cells, and TAMs. Supplementary Fig. 1–2 reveal that the expression of B7-H3 in stromal cells in cancer tissues, was significantly higher compared with the normal tissues. However, there were no significant differences between cancer tissues and normal tissues regarding the expressions of B7-H3, B7-H4, and HHLA2 in tumor cells or CD68+macrophage, and neither B7-H4 or HHLA2 was expressed in stromal cells. Moreover, the expression of B7-H3 and the infiltration intensity of CD68+macrophages in cancer tissues were significantly higher compared with the normal tissues. Supplementary Table 1–4 show that there was a significant correlation between the expression of HHLA2 in tumor cells and gender and a significant correlation between the expression of B7-H3 in CD68+macrophages and tumor size. No other significant correlations were observed between the expressions of B7-H3, B7-H4, and HHLA2 in tumor cells, stromal cells, CD68+macrophages, and PC tissue cores and clinical parameters.
Prognostic values of the expressions of B7-H3, B7-H4, and HHLA2 in tumor cells and stromal cells
Figure 2 shows that patients with low expression of B7-H3 in tumor cells had a significantly worse OS than those with high expression (cut-off = 80; HR = 2.36, 95% CI: 1.19–4.70, P = 0.05, Fig. 2a), patients with high expression of B7-H4 in tumor cells tended to have a worse OS than those with low expression (cut-off = 90.5; HR = 1.70, 95% CI: 0.77–3.77, P = 0.11, Fig. 2b), patients with low expression of HHLA2 in tumor cells tended to have a worse OS than those with high expression (cut-off = 26.7; HR = 1.81, 95% CI: 1.77–4.24, P = 0.08, Fig. 2c). With regards to the expressions of B7-H3, B7-H4, and HHLA2 in stromal cells, patients in the high-expression sub-groups had no significantly different OS compared with the low-expression sub-groups. (Fig. 2d-f).
Prognostic values of the expressions of B7-H3, B7-H4, and HHLA2 in CD68 + TAMs
Figure 3 shows that patients with high expression of B7-H3 in CD68+macrophages had a significantly worse OS than those with low expression (cut-off = 29.2, HR = 2.79, 95% CI: 1.33–5.86, P < 0.001, Fig. 3a). Patients with high expression of HHLA2 in CD68+macrophages had a significantly worse OS than those with low expression (cut-off = 59.6, HR = 4.26, 95% CI: 1.46–12.4, P = 0.01, Fig. 3c), while patients with high expression of B7-H4 sub-group had no significant different OS compared with low-expression sub-group (cut-off = 33.0, Fig. 3b). Furthermore, the comparison of different combinations between the expressions of B7-H3 and B7-H4 in CD68+macrophages showed that B7-H3lowB7-H4low patients had a significantly better OS than B7-H3highB7-H4low patients (HR = 0.45, 95% CI: 0.18–1.13, P < 0.05, Fig. 3d) or B7-H3highB7-H4high patients (HR = 0.28, 95% CI: 0.08–0.98, P < 0.001, Fig. 3d).The comparison of different combinations between the expression of B7-H3 and HHLA2 in CD68+macrophages revealed that B7-H3lowHHLA2low patients had a significantly better OS than B7-H3highHHLA2low patients (HR = 0.35, 95% CI: 0.14–0.92, P < 0.01, Fig. 3e) or B7-H3highHHLA2high patients (HR = 0.30, 95% CI: 0.08–1.11, P < 0.01, Fig. 3e),. We also found that B7-H4lowHHLA2low patients had a significantly better OS than B7-H4lowHHLA2high patients (HR = 0.39, 95% CI: 0.13–1.16, P < 0.01, Fig. 3f).
Prognostic values of tumor-infiltrating CD8 + T cells and CD68 + TAMs in PC tissues
In our present study, we also analyzed the prognostic values of tumor-infiltrating CD8+T cells and CD68+macrophages in PC tissues. Figure 4 shows that patients with high density of infiltrating CD8+T cells tended to have a better OS than those with low infiltration (cut-off = 0.34, HR = 0.52, 95% CI: 0.19–1.47, P = 0.09, Fig. 4a), and patients with low density of CD68+TAMs tended to have a better OS than those with high infiltration (cut-off = 10.5, HR = 0.61, 95% CI: 0.33–1.15, P = 0.09, Fig. 4b). CD8lowCD68high Patients had a significantly worse OS than CD8highCD68low patients (HR = 0.20, 95% CI: 0.01–4.16, P < 0.05, Fig. 4c) or CD8highCD68high patients (HR = 0.25, 95% CI: 0.02–3.71, P < 0.05, Fig. 4c).
Cox model analyses based on the expressions of B7-H3, B7-H4, and HHLA2 in tumor cells, stromal cells, and CD68 + TAMs
Table 2 reveals that patients with T stage of III + IV had a significantly reduced death risk (HR = 0.32, 95% CI: 0.14–0.75, P = 0.01) compared with patients with T stage of I + II after adjustment of gender, age, tumor size, TNM stage, pathological stage, infiltration of CD8+T cells, infiltration of CD68+macrophages, expression of B7-H3 and etc. Patients with pathological stage of III + IV had a significantly increased death risk (HR = 2.98, 95% CI: 1.27–7.01, P = 0.01) compared with patients with pathological stage of I + II. Patients with low infiltration of CD8+T cells had a significantly increased death risk (HR = 13.4, 95% CI: 2.95–60.6, P < 0.001) compared with patients with high infiltration of CD8+T cells). Patients with high infiltration of CD68+macrophages had a significantly increased death risk (HR = 11.4, 95% CI: 3.69–35.3, P < 0.001) compared with patients with low CD68+macrophages infiltration. Patients with high expression of B7-H3 had a significantly increased death risk (HR = 4.12, 95% CI: 1.06-16.0, P = 0.04) compared with patients with low expression of B7-H3. Patients with low expression of B7-H3 in tumor cells had a significantly increased death risk (HR = 3.98, 95% CI: 1.19–13.3, P = 0.02) compared with patients with high expression of B7-H3 in tumor cells. Patients with low expression of HHLA2 in tumor cells had a significantly increased death risk (HR = 2.28, 95% CI: 0.71–7.26, P = 0.05) compared with patients with high expression of HHLA2 in tumor cells. Patients with high expression of HHLA2 in stromal cells had a significantly increased death risk (HR = 6.94, 95% CI: 1.67–28.8, P = 0.01) compared with patients with low expression of HHLA2 in stromal cells.
Table 2
Univariate analyses and Cox model analyses based on the clinicopathological features, the expression of B7-H3, B7-H4, and HHLA2 in tumor cells, stromal cells, and CD68+TAMs
| Variables | | Unfavorable/favorable | | Univariate analysis | | Multivariate Cox regression analysis |
| | | HR (95% CI) | P value | | HR (95% CI) | P value |
| Gender | | Male/Female | | 1.21(0.69–2.15) | 0.51 | | 1.70(0.68–4.23) | 0.26 |
| Age | | ≥ 66/<66 | | 1.42(0.80–2.50) | 0.23 | | 1.85(0.85–4.02) | 0.12 |
| Tumor size | | ≥ 4/<4 | | 0.85(0.47–1.55) | 0.59 | | 1.60(0.71–3.57) | 0.26 |
| TNM stage | | IV/I + II | | 3.67(1.26–10.7) | 0.02 | | 1.70(0.68–4.23) | 0.26 |
| T stage | | III/I + II | | 0.88(0.48–1.62) | 0.68 | | 0.32(0.14–0.75) | 0.01 |
| Pathological stage | | III/II | | 2.01 (1.13–3.56) | 0.02 | | 2.98(1.27–7.01) | 0.01 |
| CD8+T cells infiltration | | Low/high | | 1.92(0.68–5.38) | 0.09 | | 13.4(2.95–60.6) | < 0.001 |
| CD68+ macrophages infiltration | | High/low | | 1.63(0.87–3.04) | 0.09 | | 11.4(3.69–35.3) | < 0.001 |
| B7-H3 expression | | High/low | | 1.07(0.42–2.71) | 0.88 | | 4.12(1.06-16.0) | 0.04 |
| B7-H4 expression | | High/low | | 2.41(1.07–5.42) | 0.03 | | 0.62(0.10–3.78) | 0.6 |
| HHLA2 expression | | Low/high | | 1.29(0.70–2.35) | 0.41 | | 3.47(0.83–14.5) | 0.09 |
| B7-H3 expression in tumor cells | | Low/high | | 2.36(1.19–4.70) | 0.05 | | 3.98(1.19–13.3) | 0.02 |
| B7-H4 expression in tumor cells | | High/low | | 1.70(0.77–3.77) | 0.11 | | 2.12(0.67–6.70) | 0.20 |
| HHLA2 expression in tumor cells | | Low/high | | 1.81(1.77–4.24) | 0.08 | | 2.28(0.71–7.26) | 0.05 |
| B7-H3 expression in stroma cells | | High/low | | 1.35(0.76–2.38) | 0.30 | | 1.00(0.42–2.42) | 1.00 |
| B7-H4 expression in stroma cells | | High/low | | 0.75(0.42–1.32) | 0.31 | | 1.23(0.42–3.61) | 0.71 |
| HHLA2 expression in stroma cells | | High/low | | 1.59(0.77–3.30) | 0.27 | | 6.94(1.67–28.8) | 0.01 |
| B7-H3 expression in CD68+TAMs | | High/low | | 2.79(1.33–5.86) | < 0.001 | | 3.06(0.96–9.72) | 0.16 |
| B7-H4 expression in CD68+TAMs | | High/low | | 1.44 (0.63–3.26) | 0.32 | | 0.51(0.13-2.00) | 0.80 |
| HHLA2 expression in CD68+TAMs | | High/low | | 4.26(1.46–12.4) | < 0.01 | | 1.22(0.39–3.81) | 0.57 |
| Bold signifies P < 0.05. |
Correlations among the expression levels of B7-H3, B7-H4, and HHLA2 in tumor cells, stromal cells and CD68 + macrophages
Figure 5a shows that there was no correlation between the expressions of B7-H3 and B7-H4 in tumor cells. There was a significant positive correlation between the expressions of B7-H3 and HHLA2 in tumor cells (P < 0.0001, Fig. 5b), while there was a significant negative correlation between the expressions of B7-H4 and HHLA2 in tumor cells (P < 0.01, Fig. 5c). There were significant positive correlations between the expressions of B7-H3 and B7-H4 (P = 0.01, Fig. 5d) or HHLA2 (P < 0.0001, Fig. 5e) in stromal cells, respectively. However, there was no correlation between the expressions of HHLA2 and B7-H4 in stromal cells (Fig. 5f). With regards to the correlations among the expressions of B7-H3, B7-H4, and HHLA2 in CD68+macrophages, we found that there were significant positive correlations between the expressions of B7-H3 and B7-H4 (P < 0.01, Fig. 5g) or HHLA2 (P < 0.0001, Fig. 5i) respectively. However, there was no significant correlation between the expressions of HHLA2 and B7-H4 in CD68+macrophages (Fig. 5h).
Correlations among the expression levels of B7-H3, B7-H4, and HHLA2 in tumor cells and tumor-infiltrating immune cells
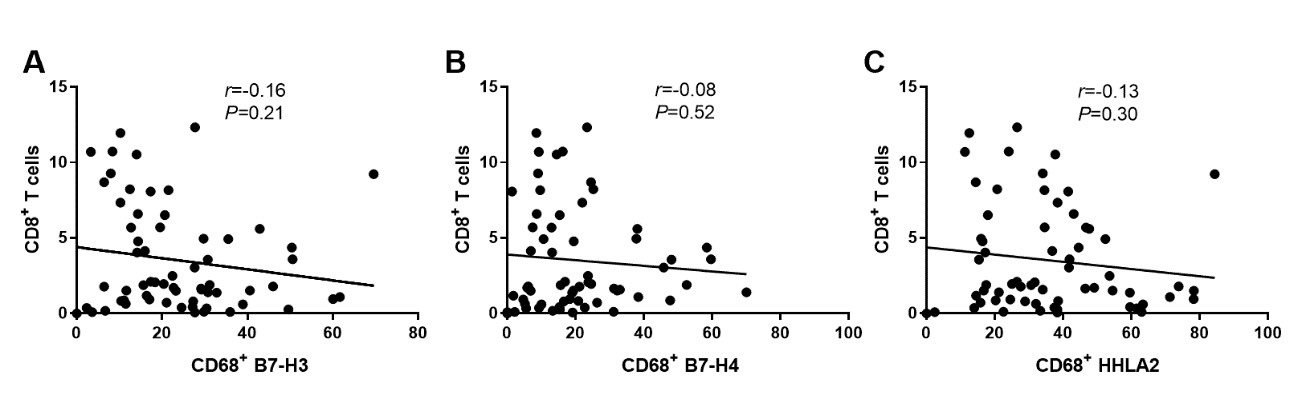
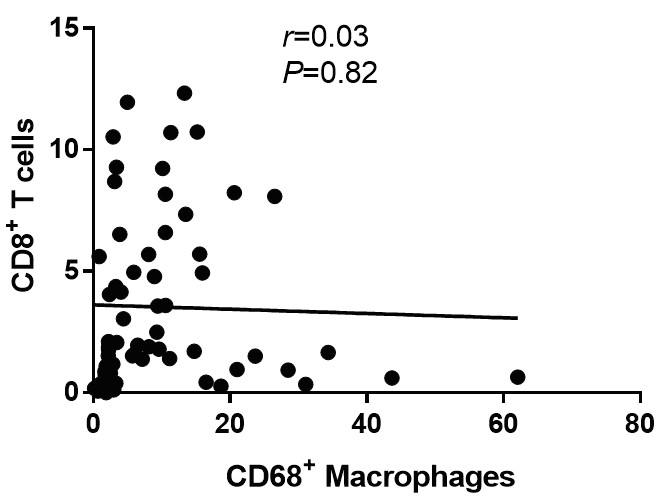
Figure 6 shows that there was no correlation between the infiltration intensity of CD8+T cell and B7-H3 expression in tumor cells, and neither B7-H4 nor HHLA2 (Fig. 6a-c). There were significant positive correlations between the infiltration intensity of CD68+macrophages and B7-H3 expression (P = 0.03, Fig. 6d) or HHLA2 expression in tumor cells (P < 0.0001, Fig. 6f). However, there was a significant negative correlation between the infiltration intensity of CD68+macrophage and B7-H4 expression in tumor cells (P = 0.01, Fig. 6e). Figure 7 indicates that there was a significant negative correlation between the infiltration intensity of CD8+T cell and B7-H3 expression in stromal cells (P = 0.01, Fig. 7a), but not B7-H4 or HHLA2 expression in stromal cells (Fig. 7b-c). With regards to the correlations between B7-H3, B7-H4 or HHLA2 expression in stromal cells and the infiltration intensity of CD68+macrophages, we found that there was a significant negative correlation between the infiltration intensity of CD68+macrophage and B7-H4 expression in stromal cells (P = 0.01, Fig. 7e), while there was a significant positive correlation between the infiltration intensity of CD68+macrophage and HHLA2 expression in stromal cells (P < 0.0001, Fig. 7f). However, we did not find any significant correlation between the infiltration intensity of CD68+macrophage and B7-H3 expression in stromal cells (Fig. 7d). Moreover, there were no significant correlations between B7-H3, B7-H4, and HHLA2 expression in CD68+macrophages and the infiltration intensity of CD8+T cells (Supplementary Fig. 3a-c). Moreover, there was no significant correlation in the infiltrating density between CD68+macrophages and CD8+T cells (Supplementary Fig. 4).