Post-mortem Specimens
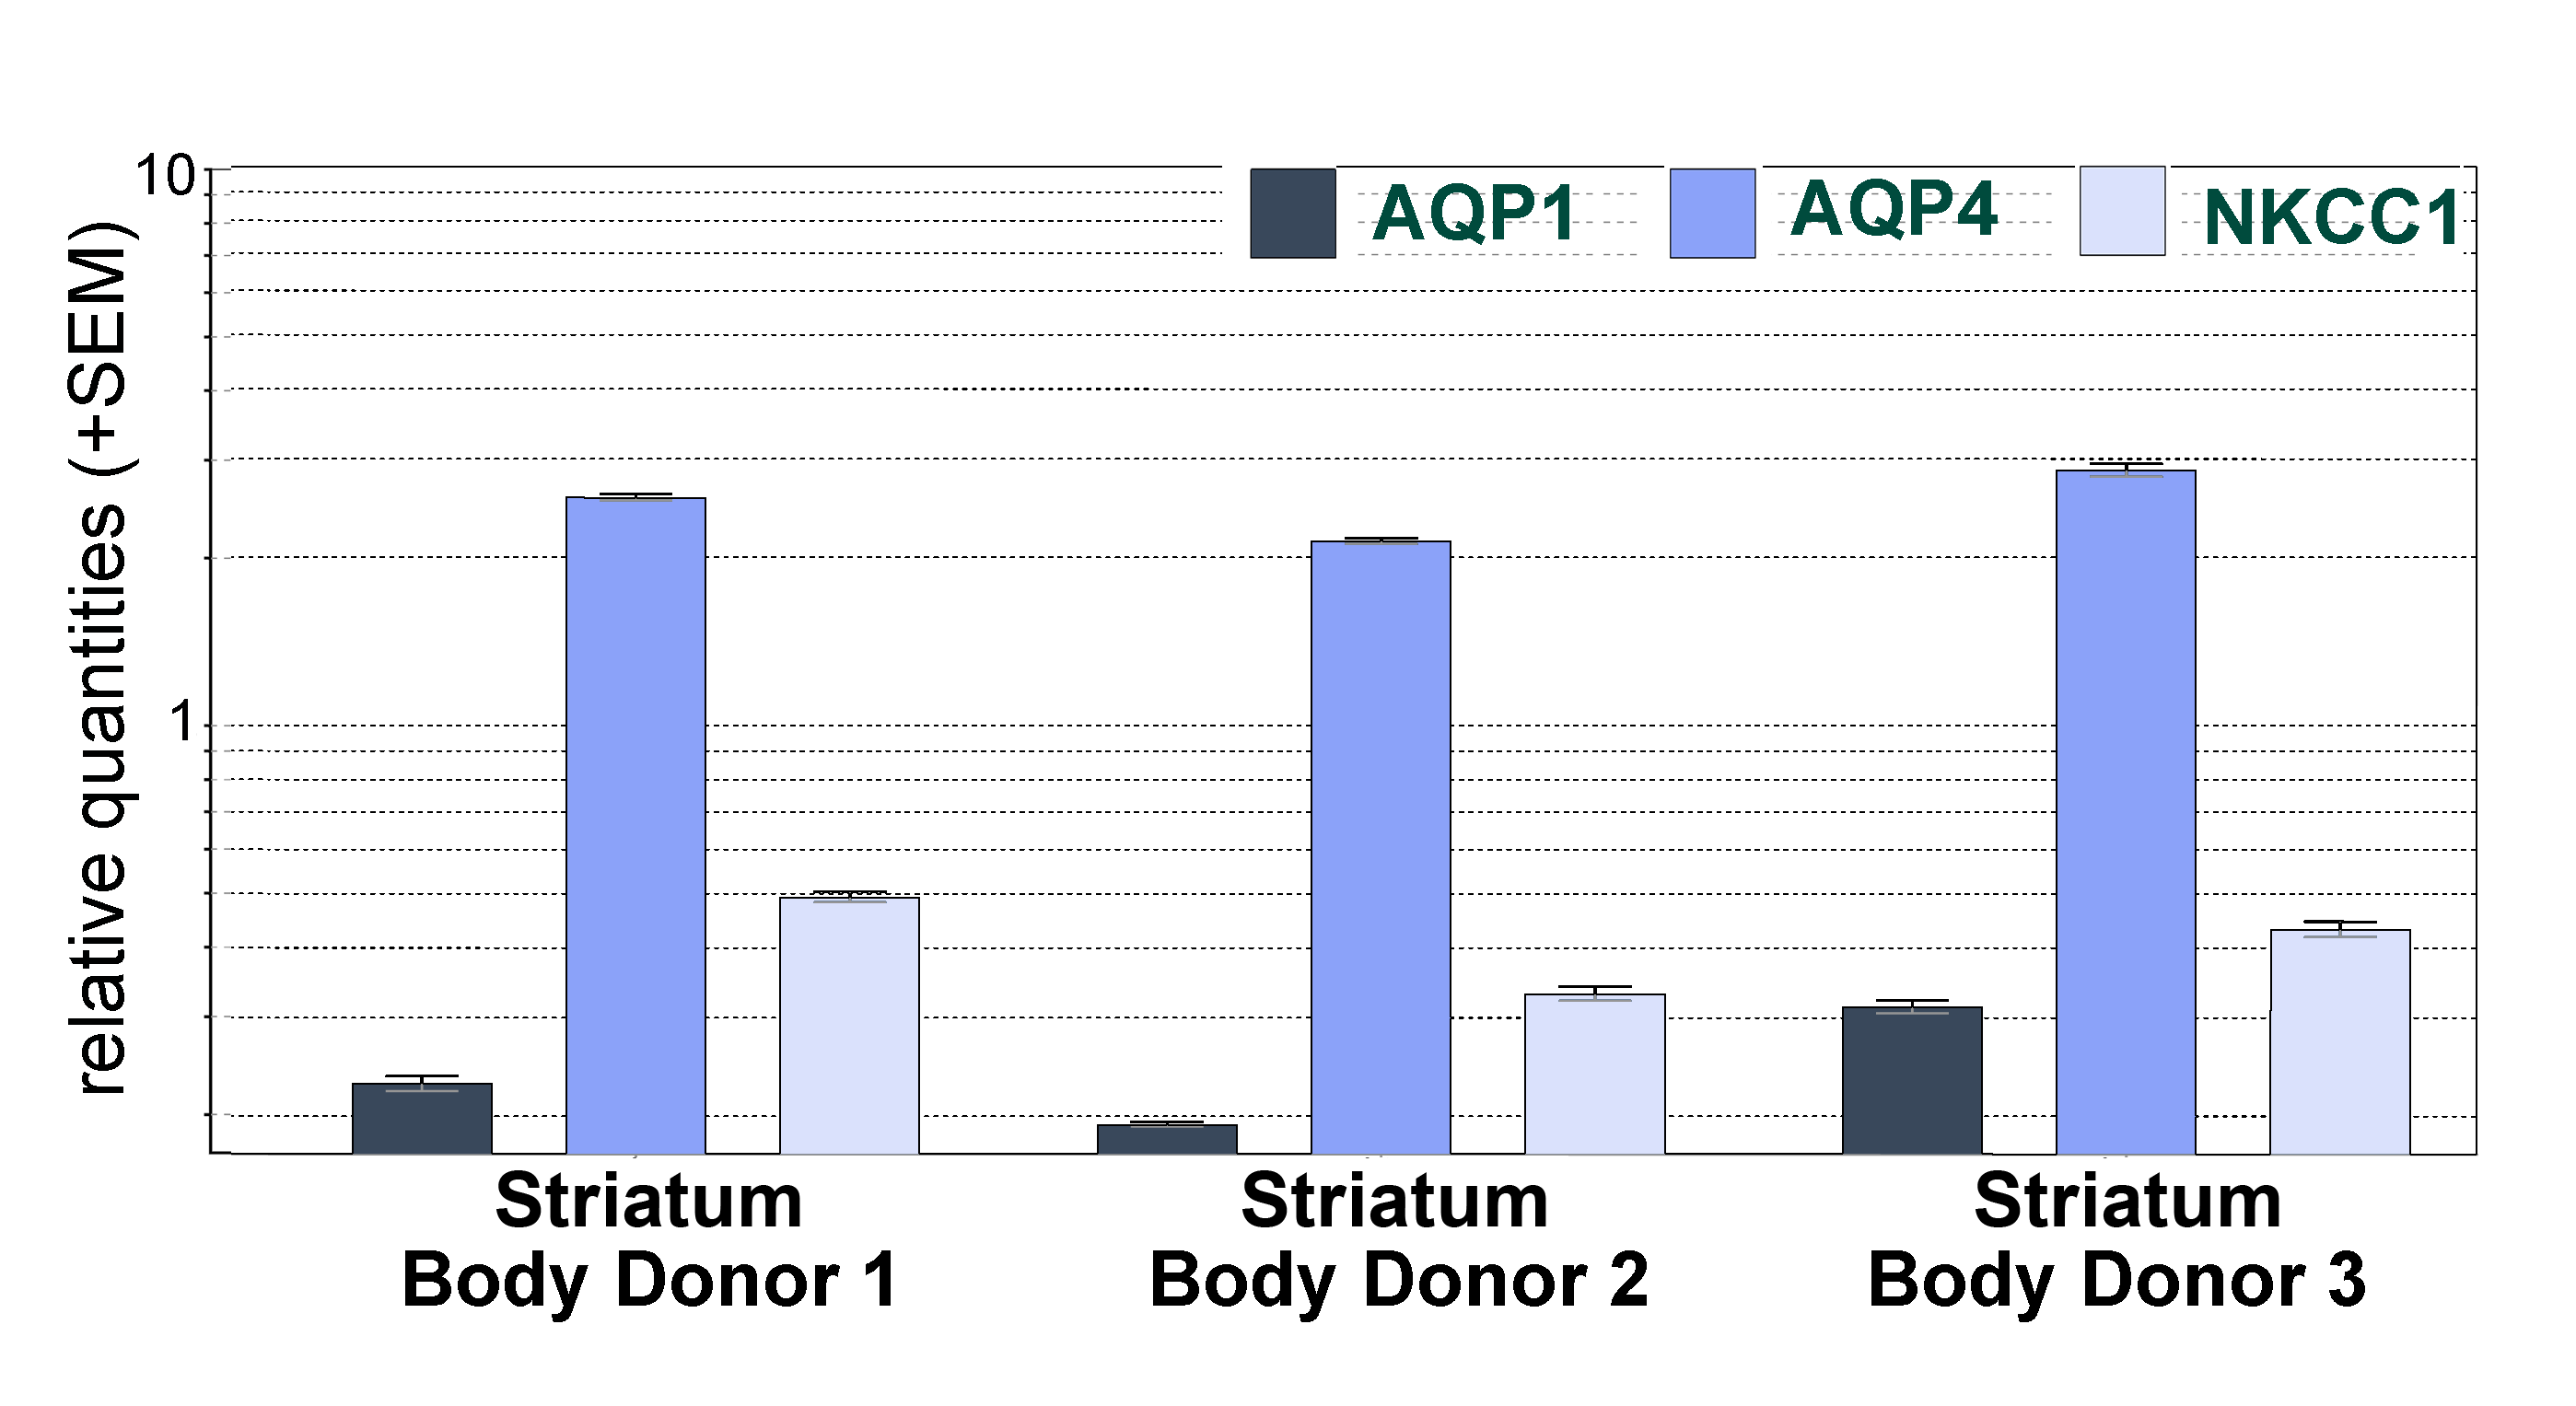
Human CP were taken from eight individuals who voluntarily donated their bodies to the Institute of Clinical Anatomical and Cell Analysis, Tübingen. They gave their informed consent in agreement with the declaration of Helsinki to use the cadaver for research purposes. This procedure was approved by the Ethics Committee of the Medical Department of the University of Tübingen under the project number 237/2007BO1. Details on the female and male body donors aged 74 and 94 years are provided in supplementary table 1. CP samples were collected and processed within 8 to 19 hours post-mortem. Parenchyma from the striatum was used as reference tissue for histology and RNA isolation.
Animals
For this study we used the CP from C57BL/6 mice bred in the facility of our institute. All procedures were performed according to University of Tübingen and governmental guidelines, and were approved by local authorities (Regierungspräsidium Tübingen). For PCR analysis, we used 15 mice from both sexes and three age cohorts: young (2-6 months old), adult (12 months old) and old (more than 30 months old), five animals each. Immunohistochemistry was performed on tissues from ten animals. For the removal of the CP and parenchyma from the striatum, mice were anaesthetized with CO2 and decapitated.
RNA Isolation
For qPCR analysis, the CP was removed immediately and placed in ice-cold, RNAse-free phosphate buffered saline (PBS, Sigma Aldrich, St. Louis, MO, USA). Care was taken to obtain solely tissue from the CP. Unfortunately, a pure CP epithelial preparation cannot be performed in such a way that no surrounding tissue is attached, especially for the mouse CP. For this reason, parenchyma from the striatum was used as control tissue for human and murine brains. For each prepared mouse, CPs from the left and right lateral ventricles were combined. In addition, the CP from the fourth ventricle was collected as a single sample, so that two CP samples were obtained from each mouse. The reference striatal tissue was always taken from the corresponding brain.
Immunohistochemistry
After removal, the excised CP was fixed in 4% paraformaldehyde overnight, afterwards rinsed with PBS, and placed into 30% (w/v) sucrose for another 24 hours for cryoprotection. The fixed samples were frozen in isopentane-nitrogen cooled TissueTek® (Sakura, Staufen, Germany), stored at -80°C before cryosectioned at 18 µm.
Sections were re-hydrated and washed in PBS for 10 min, followed by incubation in blocking solution containing PBS, 4% (v/v) goat serum (Biochrom, Berlin, Germany), 0.1% (v/v) bovine serum albumin (Roth, Karlsruhe, Germany), and 0.1% (v/v) Triton® X-100 (Roth, Karlsruhe, Germany) for 90 min. at room temperature. Next, the sections were incubated with primary antibodies (table 1) diluted in the preincubation solution overnight at 4°C in a humidified chamber. After washing with PBS three times for 10 minutes, the secondary antibodies (table 1) were applied for 90 minutes at room temperature. Afterwards, sections were stained with the nuclear stains DRAQ5 (1:1000; Thermo Fisher, Waltham, MA, USA) or DAPI (1:1000) and washed with PBS three times for 10 minutes before mounting with Mowiol 4-88 (Roth).
Light Microscopy
The cryostat sections were analyzed on a Zeiss LSM510 Meta confocal microscope (Zeiss, Oberkochen, Germany) equipped with an argon laser excitation wavelength at 488 nm and two helium-neon lasers with wavelengths for excitation at 543 nm and 633 nm, respectively and appropriated filter set. Alternatively, images were taken on an Axio Imager Z1 fluorescence microscope (Zeiss) with an Apotome module. The systems’ software Black and Blue ZEN were used for image acquisition, and image plates were assembled and processed with Adobe Photoshop CS2 (San José, CA, USA).
Electron Microscopy
CP tissue was fixed in 2.5 % glutaraldehyde buffered in 0.1 M cacodylate (pH 7.4) for 2 h. For ultrathin sections, samples were post-fixed in 1% osmium tetroxide in PBS (pH 7.4) for 1 h and subsequently dehydrated in a graded ethanol series and acetone, and embedded in epoxy resin (Sigma Aldrich, Darmstadt, Germany).
For freeze-fracture sample preparation, fixed tissues were cryoprotected in 30% glycerol and snap-frozen in nitrogen slush (-210°C). Subsequently, they were fractured in a freeze fracture apparatus (BAF400D; Balzers, Liechtenstein) at 5x10⁻⁶ mbar and -150°C. The fracture faces were contrasted with platinum/carbon (3 nm, 45°) and stabilized with carbon (30 nm, 90°) for stabilization of the replica. Remaining cell material was removed with 12% sodium hypochlorite, and the rinsed replicas were collected on Pioloform-coated copper grids.
Ultrathin sections and freeze-fracture replicas were analyzed, and images recorded on a Zeiss EM10 or a LEO 912AB transmission electron microscope (both Zeiss, Oberkochen, Germany).
RT and qPCR Analysis
Preparation material was placed in a Precellys® Lysing Kit (VWR Life Science Competence Center, Erlangen, Germany) filled with 900 µl QIAzol® Lysis Reagent (Qiagen, Hilden, Germany) immediately after collection and placed on ice. After thawed on ice, the samples were homogenized for 10 s at 3000 rpm in a Minilys system (Bertin Instruments, Montigny-le-Bretonneux, France). The homogenized samples were stored at -80°C until further processing.
The collected tissues were incubated for 5 min at room temperature. After addition of 100 µl gDNA eliminator (Qiagen), the homogenate was transferred to a MaXtract High Density Tube (Qiagen) and 200 µl chloroform was added. Centrifugation was performed at 12,000 rpm and 4°C for 5 min. The upper aqueous phase containing the nucleic acids was pipetted into a new Eppendorf reaction tube (2ml Safe-Lock). The RNA was automatically isolated in a QIAcube® (Qiagen) using the RNeasy® Plus Universal Mini Kit (Qiagen) and the corresponding QIAcube® (Qiagen) protocol.
The QIAxcel Advanced System (Qiagen) was used to determine both RNA integrity and RNA concentration. Only RIS values (RNA integrity score) of at least 6.0 were used for murine samples, and RIS values of at least 5.8 were used for human samples.
The Reverse Transcription was performed with the QuantiTect Reverse Transcriptase Kit (Qiagen) according to the manufacturer's instructions. For negative controls, the Reverse Transcriptase was replaced with nuclease-free water. The total cDNA concentration of each sample was measured using the QubitTM ssDNA Assay Kit on a Qubit 2.0 Fluorometer (Thermo Fisher Scientific, Waltham, MA, USA).
The primers/probes used to quantify mRNA expressions of aquaporin genes were acquired from TaqMan®GenExpression assays (Thermo Fisher) as summarized in supplementary table 2.
cDNA with a concentration of 5 ng/µl was used for analysis. Measurements were conducted in triplicates, and a no-template blank served as the negative control (duplicates). Parenchyma from the striatum was used as reference tissue. qPCR was performed on Applied Biosystems Step One™ (Applied Biosystems - Thermo Fisher) for 40 cycles: 15 s denaturation at 95°C, followed by 1 min annealing at 60°C. The data were collected with the StepOneTM Software v2.3 and Ct values were exported to Microsoft Excel.
qPCR Data Evaluation and Statistical Analysis
Analysis of relative mRNA expression was performed using qbase+ software (Biogazelle, Zwijnaarde, Belgium), with relative abundance (RQ values) calculated using a series of normalization methods based on the classical delta-delta Ct method and MIQE - compliant procedures (23). The RT-qPCR cycle threshold (Ct) values were the input data in the qbase+ program. Results were calculated for 100 % PCR efficiency and ‘unpaired’ experimental design.
Statistical analysis for mouse AQP4 expression was performed with GraphPad Prism 6.07 (GraphPad Software, San Diego, USA) by processing the qbase+ RQ values using an unpaired t-test. P values <0.05 were considered statistically significant.
After the amplification, PCR products were analyzed by high-resolution capillary electrophoresis with the Qiaxcel DNA High Resolution Kit, QX Alignment Marker 15 bp/600 bp and the QX DNA Size Marker 25 bp - 500 bp at a concentration of 30 ng/µl was used (Qiagen). The separation was performed using the OM800 method of the Qiaxcel System with the following parameters: 4 kV and 5 seconds for alignment marker injection, 5 kV and 10 seconds for the sample injection and 3 kV for 800 seconds for separation. The results were displayed as gel images as obtained from QIAxcel system software.