2.1 Materials. Cetyltrimethylammonium bromide (CTAB), MnCl2•4H2O, 1-butanol, cyclohexane, KHCO3, NH4HCO3, polyethyleneimine (PEI, 10,000 KDa), and ethanol were purchased from Aladdin Co., 1,3-diphenylisobenzofuran (DPBF), Ltd (Shanghai, China). Riboflavin, 30% hydrogen peroxide (H2O2), Calcein-AM, propidium iodide (PI), and cell counting Kit-8 (CCK-8) were purchased from Sigma-Aldrich (USA) Phosphate buffer saline (PBS), fetal bovine serum (FBS), penicillin/streptomycin (PS) and Dulbecco’s modified Eagle’s medium (DMEM) were purchased from Gibco Life Technology (AG, Switzerland). 4% Paraformaldehyde fix solution and GSH/GSSG assay kit were obtained from Beyotime. Hypoxia detection kit was bought from Enzo Biochem. Inc. (USA). L-buthionine sulfoximine (L-BSO) was obtained from Meilun Biotechnology Co., Ltd (Dalian, China). All of chemical reagents were used as received without further purification. The Escherichia coli containing iSurvivin-pDNA and pGL-control was purchased from GenePharma Co., Ltd. (Shanghai, China). The iSur-pDNA and pGL-control vector were amplified in Escherichia coli and isolated with an EndoFree Plasmid Mega Kit (Tiangen Biotech Co., Ltd., Beijing, China) The forward primer and reverse primer sequences of survivin were: Sur-sense: 5’-AATCATGAATCCATGGCAGCCAG-3’ and the reverse primer 5’-AAGAATTCATGGGTGCCCCGA-3’15. β-actin sense: 5′-CCA ACC GCG AGA AGA TGA-3′ and the reverse primer 5′-CCA GAG GCG TAC AGG GAT AG-3′, respectively.
2.2 Preparation of MnCO3 NCs. The MnCO3 synthetic process was according our previous work16. CTAB (2 g), MnCl2•4H2O (10 mmol) were mixed in 2.0 mL water, 3.0 mL 1-butanol and 60 mL cyclohexane, and then the mixture were vigorously stirred at room temperature, named as A solution. CTAB (8g), of KHCO3 (19 mmol), NH4HCO3 (1 mmol), 8.0 mL water, 3.0 mL 1-butanol and 240 mL cyclohexane were mixed and vigorously stirred in container B. After magnetic stirring for 1 h, solution A was added to container B under continuous stirring. After reacted for another 0.5 h, the solution was centrifuged at 8,000 rpm for 10 min to remove the supernatant. The final MnCO3 was washed with ethanol and dd H2O for three times, and then the precipitates were extracted several times using methanol with 1% NaCl to remove the redundant CTAB.
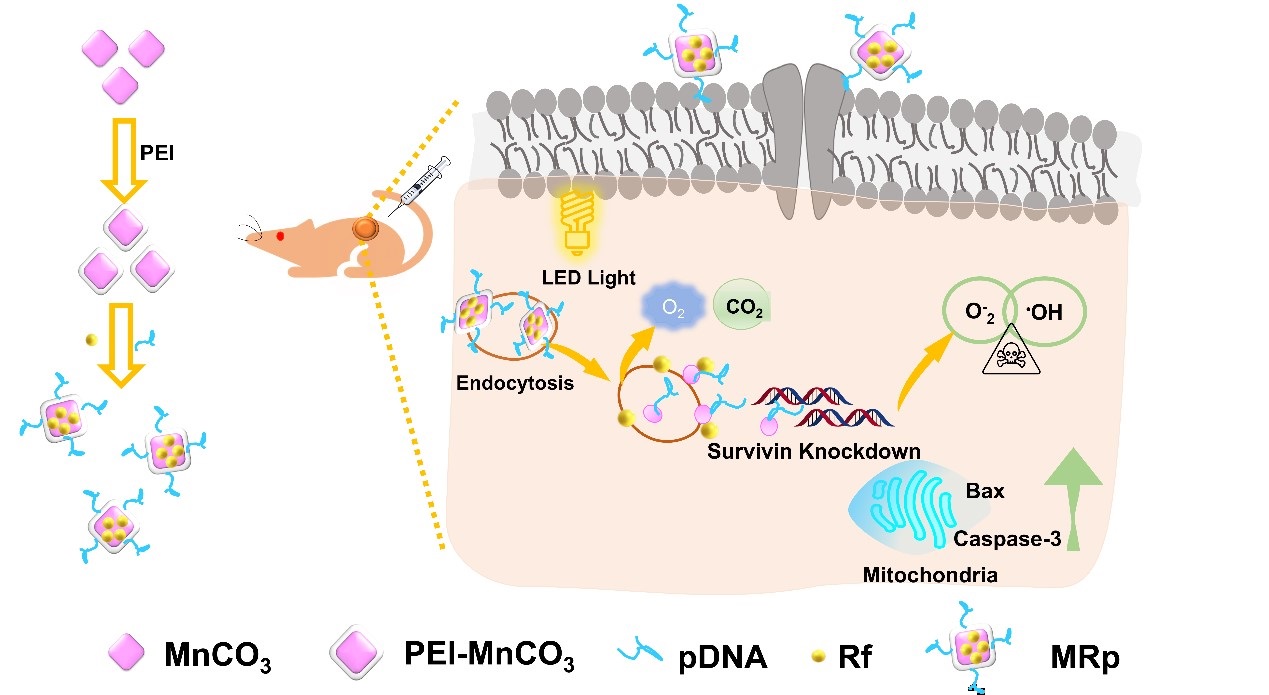
2.3 Modification of MnCO3 NCs. Surface modification of MnCO3 NCs with amine-containing PEI was followed below, 0.1 g MnCO3 NCs were dispersed in 100 mL ddH2O with vigorously stirring, then 0.1 g PEI was added to the solution. The mixture was stirred at room temperature for another 2 h. The PEI-MnCO3 NCs were collected by centrifugation (10,000 rpm, 10 min) and washed with water for 3 times to remove the redundant PEI.
2.4 Characterization. The powder X-ray diffraction (XRD) patterns were collected with a Siemens Kristalloflex 810 D-500X-ray diffractometer using Cu Kα irradiation (λ = 1.5406 Å). High-resolution transmission electron microscopy was taken on a field emission scanning electron microscope (JEOL JEM-2100F, Japan). Zeta potential and hydrophilic size were measured using a zetasizer (Zetasizer Nano ZS, Malvern, UK). UV-vis-NIR absorption spectra and absorbance were examined using multifunctional microplate reader (TECAN, infinite M200 PRO, Swiss)
2.5 Drug loading. PEI-MnCO3 NCs (500 µg) were suspended in 5 mL PBS solution, and then Rf was dispersed in the solution at a concentration of 100 µg mL− 1. After stiring at 4 oC for 24 h, the solution was centrifuged. And the supertatant and percipants were collected respectively. PEI-MnCO3/Rf NCs was named as MR. The drug loading efficiency was calculated as below:
Drug loading efficiency (%)=\(\frac{Total Rf amount-Supernatant Rf amount}{Total Rf amount} \times 100\) (1)
2.6 Extracellular O2 Measurement.The O2 production from PEI-MnCO3 NCs in H2O2 solution was monitored by a portable dissolve oxygen meter. Briefly, different concentrations of PEI-MnCO3 NCs (0, 100, 200 µg mL-1) was added to 10 mM H2O2 PBS solution. The data was recorded every 5 s for 10 min using the portable dissolve oxygen meter.
ROS detection. ROS generation was detected by ESR. Typically, Rf, PEI-MnCO3 and MRf NCs (100 µL, 0.5 mg mL-1) were mixed with H2O2 (100 µL, 16 mM) containg the trapping agent 5, 5-dimethyl-1-pyrroline-N-oxide (DMPO, 10 µL, 10 mM). Then, the X-band ESR spectra were acquired by Bruker ELEXSYS-II sepctrometer at 37 ℃. The raw MnCO3 and H2O2 were set as control.
2.7 Extracellular ROS Detection. 1 mM fluorescent dye 2′,7′-dichlorodihydrofluorescein diacetate (DCFH-DA, Sigma, USA) was hydrolyzed to DCFH using NaOH (1 mM) for intracellular ROS detection. Rf (10 µg mL− 1), PEI-MnCO3, and MRf NCs (100 µg mL− 1) was added to 2 mM H2O2, DCFH (1 µM) was added to the above solution and the mixture was exposure to LED light for 10 min, then their emission was monitored using a microplate reader (Ex/Em = 488/525 nm).
2.8 Biodegradation of MnCO3 in TME simulation solution. PEI-MnCO3 NCs were incubated in a solution of PBS (pH = 6.5) containing 2 mM H2O2 for 3, 12 and 24 h, respectively. The morphologic changes of the PEI-MnCO3 NCs were observed using TEM. In addition, PEI-MnCO3 NCs were incubated in PBS (pH = 6.5) for 10, 30, 60 and 120 min, the CO2 contents was assessed by Meteorological chromatograph. After 2 h, the solution was centrifuged, the precipitates were analyzed using XPS.
2.9 1O2Measurement. 1O2 generation was measured using a 1,3-diphenylisobenzofuran (DPBF) probe. PEI-MnCO3 NCs were incubated in a simulated TME solution (PBS (pH = 6.5) containing 2 mM H2O2). 2 µL of DPBF solution (10 mM, DMSO) was added to 200 µL of above solution. The absorbance of DPBF at 410 nm was recorded every 2 minutes by a microplate reader.
2.10 Cell lines. The mouse TNBC cell line 4T1 and L929 cells were obtained from American Type Culture Collection. 4T1-Luc cells were maintained in RPMI 1640 medium (Sigma) with 10% FBS and penicillin (100 U/mL) and streptomycin (100 µg/mL) (Invitrogen). L929 cells were maintained in Dulbecco’s modified Eagle’s medium (Sigma) with 10% fetal bovine serum (FBS, Gibco) and penicillin (100 U/mL) and streptomycin (100 µg/mL) (Invitrogen). The cells were cultured at 37 oC under a humidified atmosphere of 95% air and 5% CO2 and the medium was changed every 2 days.
2.11 Cell viability. 4T1 and L929 cells were seeded in 96-well plates with a density of 5×10⁴ cells per well, respectively. After culturing for 24 h, gradient concentrations of PEI-MnCO3, Rf and MRf (500, 250, 125, 62.5, 31.25, 15.6, 7.8, 0 µg/mL) were co-cultured with the cells for another 24 h. Then, MTT assay was measured according to the standard protocol.
2.12 Transfection of pDNA. 4T1 cells were seeded in 6-well plates with a density of 5×10⁴ cells per well. The medium was removed with fresh 1640 medium without FBS. All NCs were prepared by MRf/pDNA with a weight ratio of 15/1. Then 15 µL MnCO3/pDNA mixture was added to the 6-well plate co-cultured for 6 h. The medium was changed with fresh 1640 containing 10% FBS and 1% PS
2.13 Live/Dead Staining. 4T1 cells were seeded on 24-well plates at a concentration of 5 × 10⁴ cells/cm2 under 37°C with 5 % CO2 for 24 h. 200 µL of PEI-MnCO3 (50 µg mL− 1), Rf (50 µg mL− 1), MRf (50 µg mL− 1), MRp (50 µg mL− 1) were added to the plate, then those groups were exposure to LED light or in dark for 10 min, respectively. After co-cultured for 24 h, the cells were subject to Live/Dead staining following the manufacturer's protocol (Sigma, USA) and imaged under a fluorescence microscope (DMI4000, Leica).
2.14 Intracellular ROS Detection. Intracellular ROS production was detected by DCFH-DA. In brief, 4T1 cells were seeded in 24-well plate (1×10⁵ cells per mL) and cultured overnight. Then cells were treated similarly as above (as live/dead staining). Finally, the cells were incubated with DCFH-DA probe (1 µM) for 15 min, washed with PBS and observed by fluorescence microscopy. Moreover, their quantitative analysis was using a multifunctional microplate reader (Ex/Em: 488/525 nm).
2.15 Intracellular pH Detection. The changes of intracellular pH were using a intracellular pH fluorescence probe (BCECF AM). Briefly, the 4T1 cells were treated with PEI-MnCO3 NCs (50 µg mL− 1) as experiment group and medium as control group, then the cells were cultured with BCECF AM (5 µM) for 20 min, and their images were observed under fluorescence microscopy. And their quantitative analysis was using a multifunctional microplate reader (Ex/Em: 488/535 nm).
2.16 Animals. Balb/c nude mice (six-week-old, female) were purchased from Guangdong Medical Lab. Animal Center. The protocol was approved by Institutional Animal Care and Use Committee of General Hospital of Southern Theater Command of PLA.
2.17 In vivotumor therapy. 5 × 10⁶ 4T1 cells were injected to the second breast nodule of the nude mice. After the tumors grew to a size of 50 ‒ 70 mm2, the mice were divided into 5 random groups (n = 4) undergoing different treatments: 1) PBS; 2) PEI-MnCO3; 3) Rf + LED light; 4) MR + Light; 5) MRp + LED light; The NCs were injected intratumorally into the 4T1-bearing mouse. The size of the tumors was measured every other day for two weeks. The tumor volumes were carefully measured every other day for 14 days by a caliper and calculated as Equation S2:
$$V=\frac{a{b}^{2}}{2}$$
2
where V (mm3) is the volume of the tumor, and a (mm) and b (mm) is length of tumor and width of tumor, respectively. Then the tumors were histologically analyzed by hematoxylin and eosin (H&E) staining.