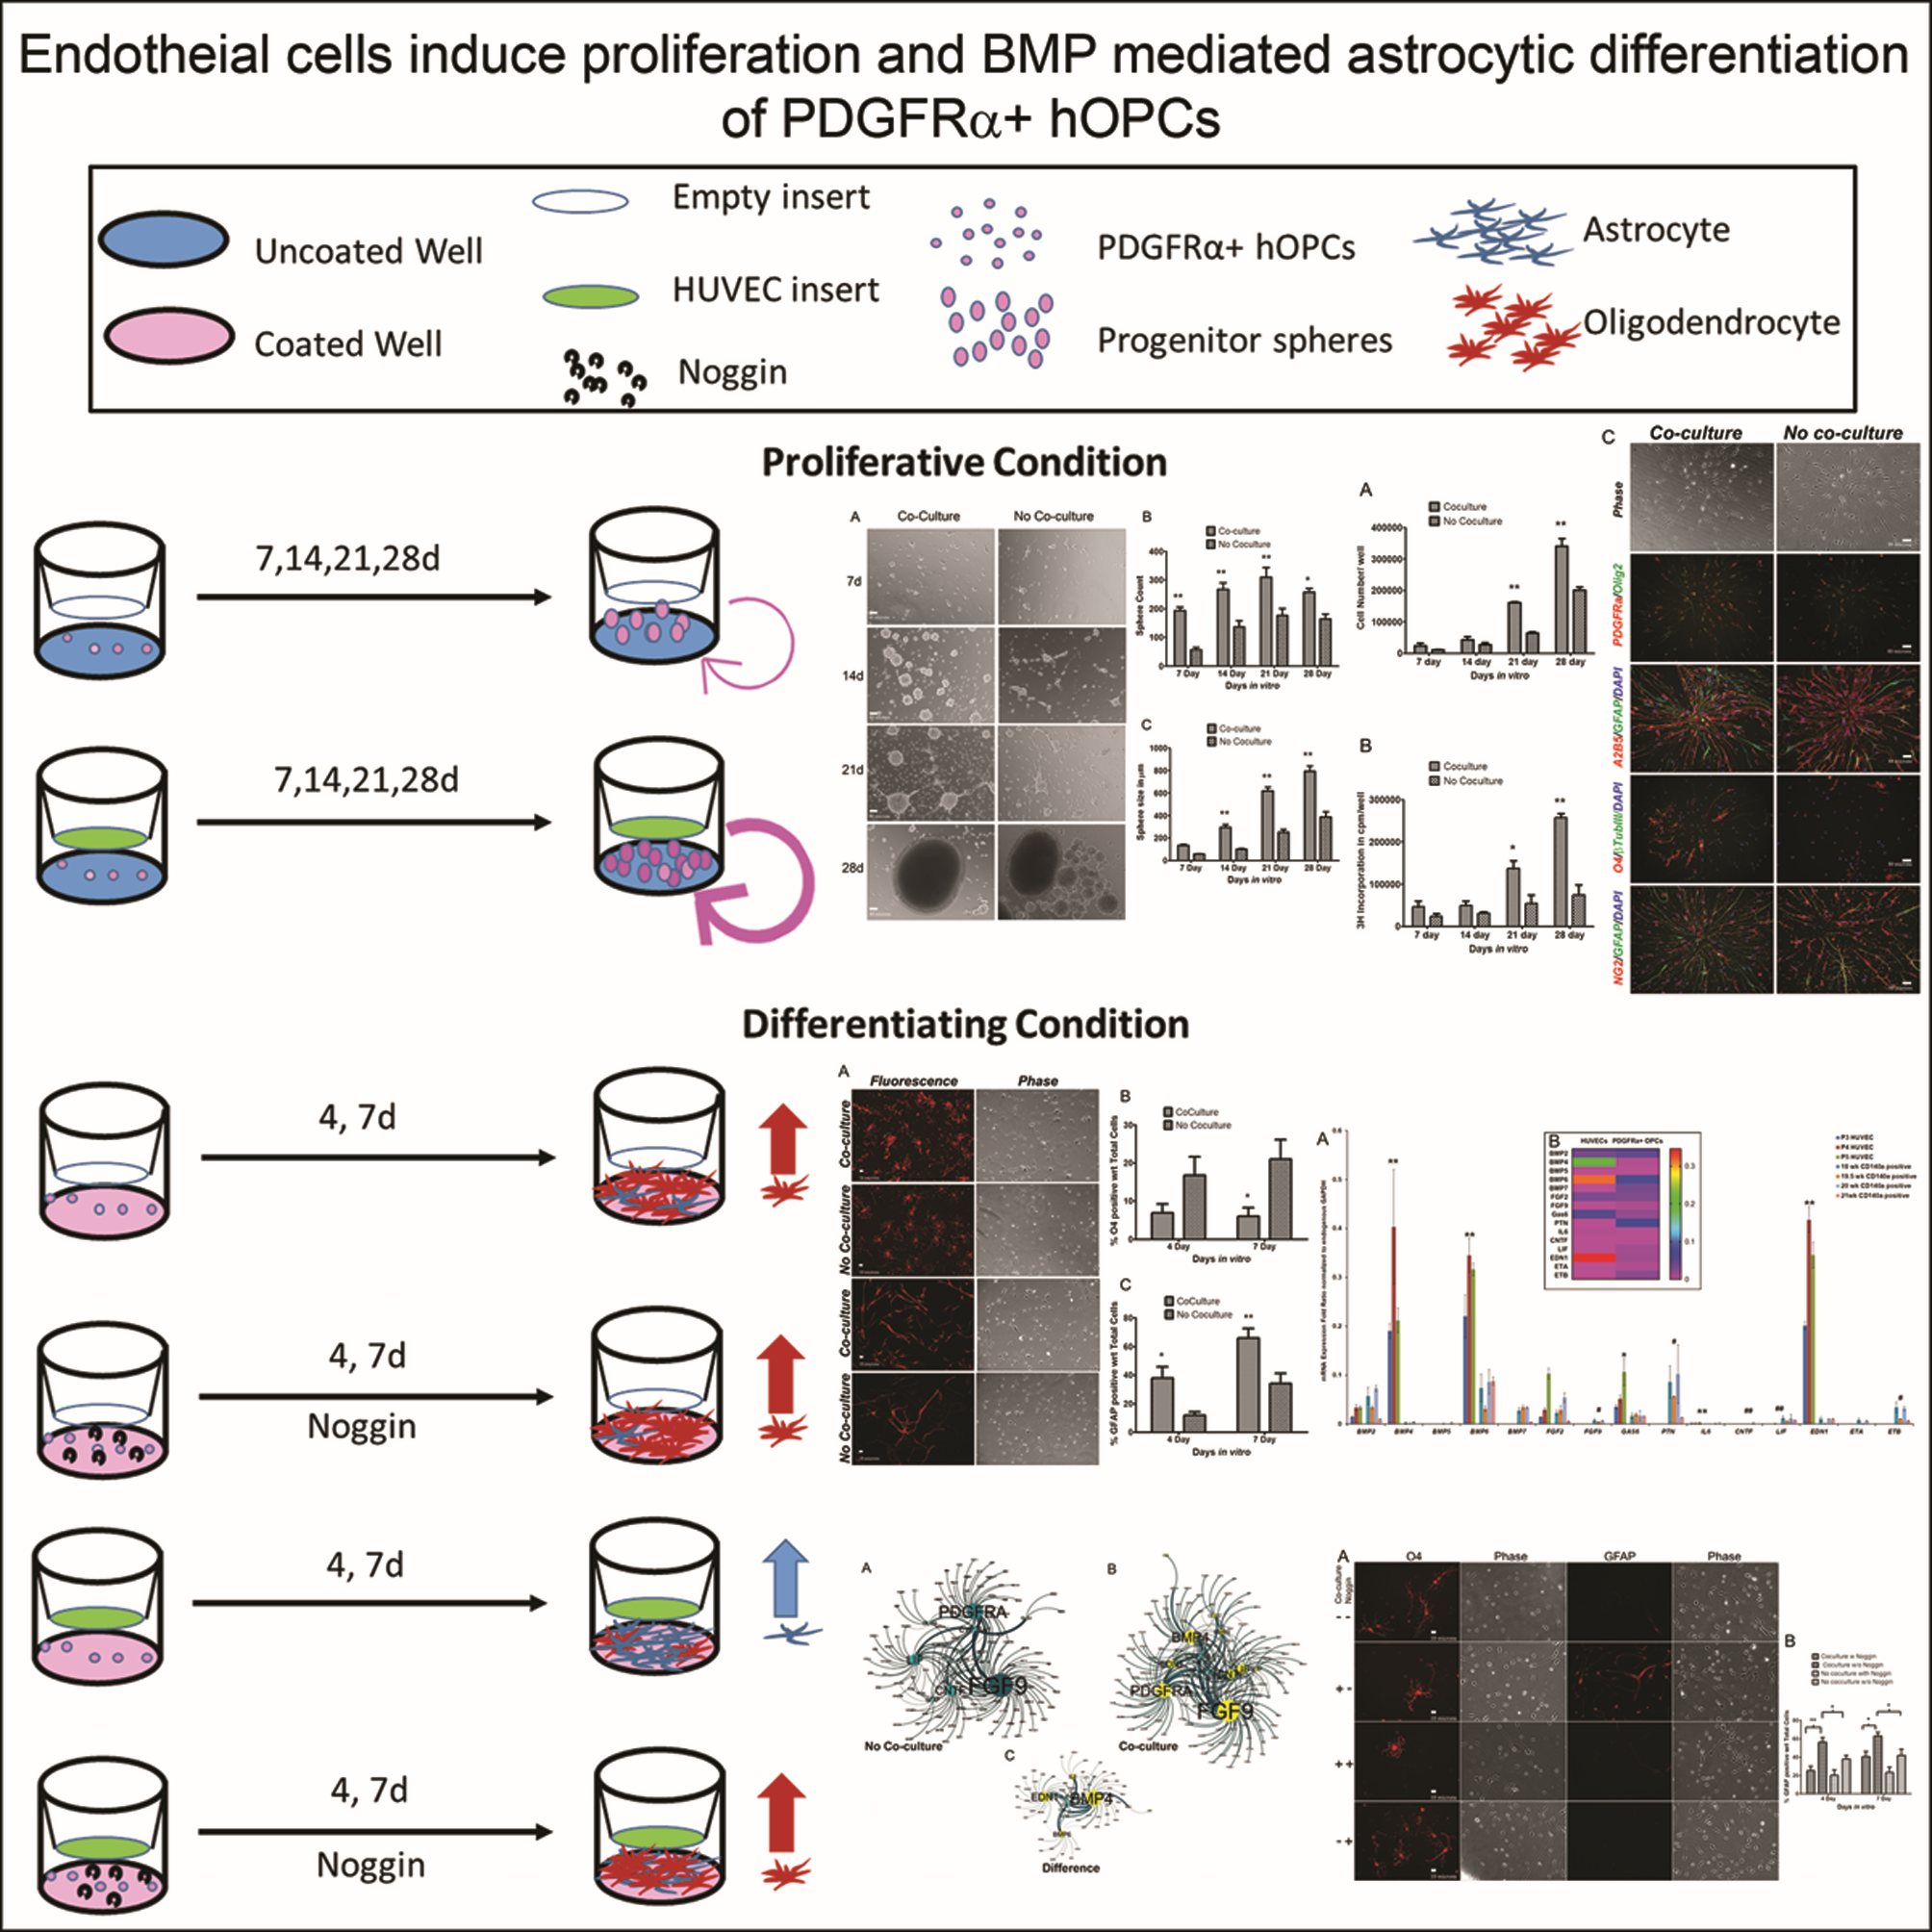
Endothelial cells encourage sphere formation in PDGFRα+ oligodendrocyte precursor cells
To determine the effect of endothelial cell derived soluble factors on the oligodendrocyte precursor cells, when the hOPCs were maintained under proliferative conditions in co-culture with HUVECs on trans-well for four weeks, with trans-well inserts being changed every 5-7 days, OPC spheres originated as adherent spheres by clonal expansion. These spheres were more in number and of larger diameter when the hOPC were in co-culture with the HUVECs compared to those without co-culture. A minimum hOPC sphere was visually perceived to be consisting of approximately eight cells. After three weeks in culture, hOPC spheres grew too large to be held to the substrate, and they would detach and stay close to the surface of the plate. At this stage, the spheres also showed a tendency to gather and fuse, forming mega-spheres. There was always a significant difference in the number of spheres and the diameter of the largest sphere between co-culture and no-co-culture conditions (Figure 1 A). The co-culture effect was highly significant (P<0.0001), and the increase in sphere numbers was also a function of time (P<0.0001) (Figure 1 B). In the same experiment, when the diameter of the largest sphere was measured every week for wells with and without HUVEC co-culture, the co-culture effect was highly significant, with P<0.0001 and along with the time effect with P<0.0001 (Figure 1 C). Thus, co-culture with HUVECs encouraged survival or proliferation or both for the PDGFRα+ OPCs.
Endothelial cells induce proliferation in PDGFRα+ human oligo progenitors
To determine if co-culture with endothelial cells encouraged the proliferation of progenitors, hOPCs were allowed to grow up to four weeks with or without co-culture. When cell numbers in hOPC spheres were determined by dissociating them with papain/DNase at 7, 14, 21, and 28 days, effect of HUVEC co-culture on the increase in hOPC cell number was significant with P=0.0013. The difference in cell numbers between the co-culture and no co-culture group was significant at 21-day (t=6.208, p<0.001) and 28-day (t=8.991, p<0.001) time points. Independent of the co-culture, the cell numbers also increased as a function of time with a P<0.0001 (Figure 2 A). Synthesis of new chromatin material should accompany increased proliferation. To assess the net proportion of active DNA synthesis, when the hOPCs in quadruplicate wells with or without co-culture were pulsed for 72 hours with [3H- methyl] thymidine at 4, 12, 18, and 25 days, thymidine incorporation in the OPCs showed that the effect of co-culture was significant with P=0.0052. Again the effect was significant at only21-day (t=3.995, p<0.01) and 28-day (t=8.819, p<0.001) time points and not at 7 and 14 days. The effect of time was also highly significant with P<0.0001 (Figure 2 B).
Co-culture does not alter differentiation outcome of the hOPC spheres
To determine if the hOPCs in co-culture generated in the proliferative conditions had more oligogenic potential, human OPC spheres formed at the end of each week of culture in proliferative conditions with or without co-culture with HUVECs were re-plated and incubated in differentiation conditions for 2h to 4-days. The differentiated spheres were then stained for common progenitor and differentiation markers - PDGFRα, A2B5, NG2, Olig2, O4, GFAP, and β III tubulin (Figure 2 C). Fluorescence micrographs show that the distribution of these markers are not significantly different between the spheres arising from co-culture and no co-culture conditions. However, there were always minor differences in the distribution of markers between sphere to sphere within the same condition. Thus irrespective of co-culture, some spheres were remarkably rich in O4 or GFAP compared to the other spheres in the same well, indicating preservation of asymmetric division of the progenitors under proliferative conditions irrespective of co-culture. In addition, regardless of co-culture, O4 expression and its clonal expansion from the PDGFRα+ OPCs could be seen only up to the first two weeks in these experiments, during which some spheres gave rise to more number of O4 positives than others within the same well. At the end of four weeks in vitro, irrespective of co-culture, the PDGFRα+ hOPC spheres upon re-plating were mostly A2B5 positive (50 to 75%) and GFAP positive (70 to 85%), with minimal (3 to 6%) O4 positive cells.
Endothelial cells induce the differentiation outcome of hOPCs to Astrocytes
To examine if co-culture with HUVECs could affect the differentiation pattern of the oligodendrocyte precursors independent of their proliferation, PDGFRα+ hOPCs were seeded directly under differentiating conditions and incubated for either 4 or 7 days. Differentiation of the OPCs to oligodendrocyte and astrocyte lineages were assessed by immunocytochemistry for differentiation markers O4 and GFAP respectively (representative micrographs in Figure 3 A). Counting the immuno-stained cells revealed that the percent of oligodendrocytes as determined by O4 staining decreases significantly upon co-culture with P=0.0351, with the decrease in the O4 percentage at seven days being significant (t =2.730, p < 0.05) though the difference at four days was not significant (Figure 3 B). Time had no significant effect on the O4 survival within this one week. Co-culture very significantly caused induction of astrocytic lineage as measured by the percent of GFAP positive cells, P=0.0082, with a 26% astrocytic induction at four days (t=2.894, p<0.05), and 31.66% at seven days (t=3.500, p<0.01). GFAP induction in these cultures also significantly increased with time, with P=0.0001 (Figure 3 C). Thus, co-culture with endothelial cells encourages astrocytic differentiation of the PDGFRα+ hOPCs with a concomitant decrease in differentiation to oligodendrocytic lineage.
Transcriptional analysis of HUVECs and hOPCs reveal predominant soluble mediators
The relative contribution of soluble factors from HUVECs and PDGFRα+ hOPCs to the co-culture environment was assessed by measuring the expression levels of 15 relevant genes using Inventoried Taqman’s human Gene Expression Assay. Fold ratio (FR) for gene expression was calculated HUVEC to hOPC with respect to the respective endogenous GAPDH using the delta CT method. Figure 4 A shows the gene expression in each biological replicate as mean expression in three technical replicate assays. Heat map of mean expression ratio with respect to endogenous GAPDH in HUVECs and PDGFRα+ hOPCs is shown in the inset; Figure 4 B. HUVEC to hOPC fold ratio (FR) of gene expression is given in Table 1. Of all the 15 genes tested for, the highest difference in mRNA expression relative to GAPDH was observed for bone morphogenic protein 4 (BMP4), with HUVEC to hOPC expression FR=134.9 (p=0.0026). HUVECs also showed increased expression of bone morphogenic protein 6 (BMP6) with FR=4.211 (p = 0.00071) and endothelin1 (EDN1) with FR=41.50 (p=0.00101). Growth arrest specific 6 (GAS6) had FR=3.753 (p = 0.02363) and interleukin6 (IL6) had FR=3.726 (p = 0.00296), both showing higher expression in HUVECs than the hOPCs. Endothelin1 receptor B (EDNRB) was significantly more abundant in PDGFRα+ OPCs than HUVECs. The other endothelin1 receptor EDNRA did not show any significant difference in expression between two cell types. Transcripts of soluble factors more abundant in OPCs compared to HUVECs includes Pleiotrophin (PTN) with FR=0.003612 (p=0.01972), followed by fibroblast growth factor 9 (FGF9) or glia activating factor, with FR=0.004552 (p=0.02482), and cytokines as, ciliary neurotrophic factor (CNTF), and leukemia inhibitory factor (LIF), with FR of 0.032551, (p=0.00710), and 0.048426 (p=0.00235) respectively. Other humoral factor genes that did not show differential expression between the two cell types were the bone morphogenic proteins 2 and 5 (BMP2 and BMP5) and the fibroblast growth factor -2 (FGF2). Raw Ct values for these experiments are given in Supplemental Spreadsheet 1.
Network Analysis reveals BMP4 as the key differentiation factor
Knowledge-based networks were built using gene-lists specific to the co-culture and no co-culture environments on the PCViz2 application of Pathway Commons with Input Gene-lists for Differential Networks given in Table S2. The networks were analyzed with Cytoscape 3.4.0. and represented with statistical weightage of molecular interactions at the nodes as well as the edges for no co-culture and co-culture conditions (Figure 5 A & B). The difference network between the co-culture and no co-culture environments (Figure 5 C) revealed BMP4 as the predominant node with the most connections, followed by EDN1, BMP6, IL6 and GAS6 closely following the experimental FRs of transcripts in HUVECs to hOPCs determined by Taqman Assay. The complete list of nodes and edges for all three networks are given in Supplemental Spreadsheet 2.
Noggin can inhibit HUVEC induced differentiation of hOPCs to Astrocytes
Based on the relative fold ratios of the transcripts seen in gene expression assay (Table 1, Figure 4) and the knowledge based networks (Figure 5), bone morphogenic protein 4 (BMP4) was hypothesized to be the most significant humoral factor from HUVECs in co-culture media that could affect the differentiation fate of hOPCs in co-culture. If the astrocytic differentiation of the PDGFRα+ OPCs in co-culture with HUVECs is mediated by the BMPs, the same should be attenuated by noggin, the general inhibitor of BMP signaling. Therefore, PDGFRα+ hOPCs were plated for differentiation with a pre-treatment by 100ng/ml of Noggin for 4h to block all endogenous BMP signaling, followed by the start of co-culture with HUVECs. The Noggin treatment was repeated every 24 hours until 4 and 7 days, followed by immunocytochemistry for O4 and GFAP to assess commitment to oligodendrocyte or astrocyte lineage, respectively. Representative micrographs are presented in Figure 6 A. Statistical analysis of the cell counts by one-way ANOVA revealed that Noggin could effectively reduce HUVEC induced astrocytic differentiation at both 4 and 7 day time points with P=0.0012. Effective lowering of the percent of GFAP positive cells for co-culture was from 56.27 ± 5.085 (mean ± SE) without Noggin to 25.21 ± 4.814 with Noggin (p < 0.01). While in the absence of co-culture, only 37.83 ± 4.042 percent of human OPCs showed GFAP expression under identical conditions (p < 0.05)). On day 7, the daily noggin treatment continued to attenuate HUVEC mediated astrocytic differentiation with a similar statistical pattern (Figure 6 B). Since HUVEC mediated astrocytic differentiation of PDGFRα+ hOPCs was completely attenuated by Noggin, the endothelial mediated astrocytic differentiation of hOPCs was concluded to be BMP mediated.