Patient demographics and clinical characteristics
Among 83 patients who underwent emergency EVT in our stroke unit, 11 (13.3%) patients were excluded owing to the following causes: 2 (2.4%) died as a result of non-cardiovascular disease, 4 (4.8%) had inadequate BP during the first 24 hours, 3 (3.6%) exited the study during the 3-month follow-up, and 2 (2.4%) died as a result of cerebral hernia. As a result, 72 patients with AIS-LVO within the anterior circulation were enrolled in this study.
The baseline clinical demographic characteristics of the study population are summarized in Table 1. Of the 72 patients, including 42 (58.3%) with favorable outcomes and 30 (41.7%) with unfavorable outcomes at 3-months, the mean age was 64.8±10.9 years, and 27 (37.5%) were women. The median NIHSS score at admission was 14 points [IQR, 9-19], while the median ASPECTS was 8 points [IQR, 7-9]. Of the 72 patients, 86.1% patients achieved recanalization (TICI 2b or 3). In total, 26.4% patients received combined intravenous thrombolysis and thrombectomy, 13.9% of patients were treated with intra-arterial thrombolysis alone, and 59.7% of patients were treated with direct mechanical thrombectomy. Intracranial haemorrhagic transformation occurred in 13 patients (18.0%), while the hemorrhagic transformation was no different between the patients with the three treatments of EVT (Additional file 1).
Compared to patients with an unfavorable outcome group, the NIHSS scores, admission SBP level, and frequency of MT were significantly lower in the favorable outcome group (all P<0.05). Patients with a 3-month favorable outcome were more likely to have lesions in the M1 of middle cerebral artery, to have higher rates of successful recanalization, to have higher admission ASPECT scores, and to receive intra-arterial thrombolysis alone. The rates of vascular risk factors, time of symptom onset to groin puncture, and HI were not significantly different between the two groups.
Table 2 lists the baseline characteristics of patients in different groups, in which patients are divided into four groups according to systolic SV values quartiles: Systolic SV values ≤10.96, 10.97-12.71, 12.72-14.24, and>14.24 . The frequency of MT, ASPECT score at admission and rates of successful recanalization post EVT differed among the four groups (all P<0.05).
BPV and 3-month functional outcome
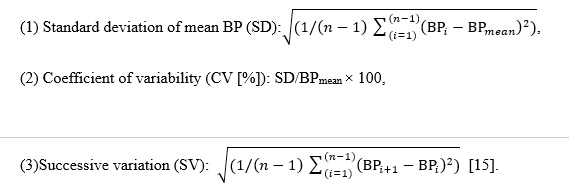
In this study (Fig. 1), we detected the difference in maximum SBP, systolic CV, SV, and SD between the two outcome groups. Patients with unfavorable prognosis had higher maximum SBP ([163.5±15.6] vs. [154.3±16.8], P=0.02), systolic CV ([11.0%±1.8%] vs. [8.8%±2.0%], P<0.001), SV ([14.6±2.0] vs. [11. 4±2.3], P<0.001), and SD ([13.8±3.9] vs. [10. 5±2.4], P<0.001). We found no significant difference in the level of MAP, mean SBP, minimum SBP, and dates of DBP variability between the two groups (P>0.05). On subgroup analysis, we also found the maximum SBP, systolic SV, CV, SD were lower in patients with a favorable outcome in the successful recanalization group; however no significant difference was observed in the non-successful recanalization group. Lower systolic SV, CV, and SD were found in M1 of the MCA lesion group, according to vascular lesions. In the ICA lesion group, the systolic SV was lower amongst those patients with a favorable outcome; other BPV parameters were not found to be different (Table 3).
Influencing factors of 3-month functional independence
Table 4. summarizes the univariable and multivariable associations of BP measurements after EVT and other clinical characteristics with the 3-month functional prognosis. The following variables were found to be significantly related (P<0.05) to 3-month functional independence in the initial univariable analysis: NIHSS score at admission, SBP at admission, ASPECTS at admission, M1of the MCA occlusion, frequency of mechanical thrombectomy, measurement of EVT, successful recanalization, maximum SBP and systolic SD, CV, and SV post MT. After adjusting for potential confounders, multivariable logistic regression revealed that systolic SV (OR: 4.273, 95% CI: 1.030 to 17.727, P=0.045) was an independent predictor of unfavorable outcome, and a high ASPECTS was independently associated with a better likelihood of a favorable outcome (OR: 0.200, 95% CI: 0.054 to 0.744, P=0.016).
mRS score distribution according to quartiles of systolic SV
Patients were divided into 4 groups according to systolic SV values by quartile to clarify the relationship between SV values and mRS scores (Fig. 2). One-way ANOVA analysis demonstrated that there was a significant in mRS scores at 3-month of the four groups (P<0.001). In addition, Multiple Post Hoc Comparisons showed compared with the group with high systolic SV, those with lower systolic SV had lower mRS scores at 3 months (P <0.001, OR = -1.833, 95% CI = -2.722 to -0.945 for Q1:Q4; P <0.001, OR = -1.444, 95% CI = -2.333 to -0.556 for Q1:Q3; P <0.001, OR = -1.389, 95% CI = -2.277 to -0.500 for Q2:Q3; P <0.001, OR = -1.778, 95% CI = -2.666 to -0.889 for Q2:Q4;), no statistically difference in mRS scores was noted in patients with systolic SV Q1 and Q2 (P=0.998), Q3 and Q4(P=0.659). Furthermore, after adjusted for age, sex, frequency of MT, ASPECT score at admission and rates of successful recanalization, the risk of unfavorable outcome at 3-month was significantly decreased in patients with low systolic SV levels compared with the group with high systolic SV levels (P = 0.015, OR = 0.056, 95% CI =0.007 to 0.433 for Q1:Q4). After additional adjustment for hypertension, diabetes mellitus, coronary heart disease, atrial fibrillation, smoking, admission NIHSS scores, admission serum glucose, LDL-C, admission SBP, admission DBP, onset to groin puncture time, vascular lesion and type of EVT, the significance persisted (P = 0.004, OR = 0.008, 95% CI =0.000 to 0.141 for Q1:Q4).
ROC analysis
ROC analysis demonstrated that the areas under the curve (AUC) of systolic SV for predicting unfavorable outcome was 0.868 (95% CI: 0.781 to 0.955, P<0.001; Fig. 3). The optimal cut-off value was 12.499, which resulted in 93.3% sensitivity, 73.8% specificity, 71.1% PPV, and 91.2% NPV (Table 5). This indicates that an systolic SV of 12.499 had an excellent predictive value for a poor 3-month functional outcome.