All text analytics were carried out in R 3.4.3 with the CRAN package pubmed.mineR version 1.0.10 [46]. Diabetes abstracts were extracted from the PubMed database.
1. Data Collection:
All type 2 diabetes abstracts, were downloaded from PubMed and then subjected to an R package pubmed.mineR [46] to extract the gene disease associations
2. Entity recognition and their relationships
We used sentence tokenization function of pubmed.mineR to extract sentences with co-occurrence of the two entities: genes and disease terms. Mention of genes included gene symbols including official symbols recommended by the Human Gene Nomenclature Committee's (HGNC) [47], other symbols (aliases, previous symbols), alternative names from UniProt and gene names from HGNC using official_fn(), altnamesfun(), prevsymbol_fn(), alias_fn() and names() functions of pubmed.mineR. False matches arise due to use of identical acronyms by authors signifying other meanings. These were manually identified and discarded. The extracted sentences were examined for ‘proof of association’ or ‘of evidence’ in terms of relationships between the entities. In cases where the relationship was not clear, the entire abstract was examined along with full text wherever available from PubMed Central. We have analyzed the trends of resulting genes to mark their significance and their annotation with Gene Ontologies (GOs) by using DAVID (Database for Annotation, Visualization and Integrated Discovery) [48]. The schematic representation of the methodology is given in Figure 1. These genes are termed T2DMTB genes.
3. Web server development:
The fully annotated data of T2DMTB genes was plugged into T2DiACoD [49].
4. Gene Enrichment Analysis:
To infer potential biological significance of the reported genes, we have used DAVID (Database for Annotation, Visualization and Integrated Discovery) [48]. The output table was obtained with the following information: Annotation Cluster, Enrichment Score, Category, Term, Count, % (involved genes/total genes), Genes, List Total, Pop Hits, Pop Total, Fold Enrichment, Bonferroni, Benjamini and FDR, P-Value (calculated by Fishers' exact test) as well as FDR <= 0.05 were considered strongly enriched in the annotation categories. Gene ontology enrichment was prepared using EnrichmentMap [50], a cytoscape plugin.
5. Differential Expression:
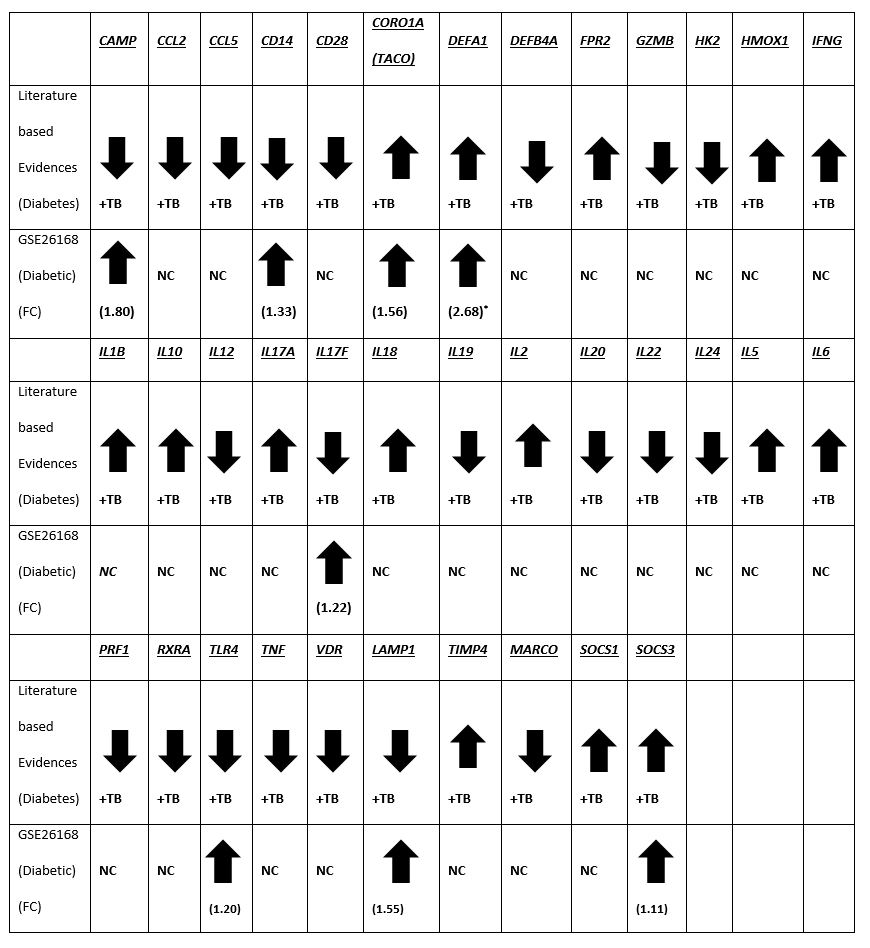
The microarray gene expression (GSE26168) data for blood samples from T2DM patients were collected from NCBI GEO [51]. The GSE26168 is a super-series and composed of two subseries, GSE21321 and GSE26167. This data contains mRNA and miRNA profiles of T2DM patients without tuberculosis. From GSE21321 subseries, 8 controls, 7 impaired fasting glucose, and 9 diabetic mRNA samples, whereas 10 control, 7 impaired fasting glucose and 9 diabetic miRNA human samples were studied. For mRNAs, the illumina platform and for miRNAs, the miRCURY LNA microRNA array platform was used. This illumina dataset was processed using the lumi package [52]. Normalization was performed using a modified Z-score method based on median absolute deviation (MAD) [53]. For differential expression, the limma [54] package was used. The differentially expressed mRNAs and miRNAs were selected on the basis of P-values < 0.05 and Padj < 0.05.
6. Integrative Analysis
i) Collection of deregulated miRNAs in Blood from T2DM and TB patients
We sought to identify the miRNAs targeting T2DMTB genes to understand their role in the pathogenicity of the co-morbidity. We used NetworkAnalyst [34] to obtain gene-miRNA interactions. It uses TarBase and mirTarBase databases for information retrieval. We extracted common miRNAs deregulated in T2DM as well as in TB in blood. Further literature mining was performed for the evidence of deregulated miRNAs in both conditions.
ii) Differential Expression
The deregulated miRNAs from the literature (Supplementary Table S5) were further examined for differential expression in microarray expression of miRNAs from blood samples of T2DM patients (GSE26168).
iii) Identification of regulators of miRNA-146a & the gene targets of miRNA-146a
To investigate the role of the differentially expressed hsa-miRNA-146a in the disease, the regulators of miRNA-146a and the gene targets regulated by hsa-miRNA-146a were extracted using text mining from PubMed. Literature mining using pubmed.mineR was performed to extract the human host regulators and targets of miRNA-146a.
iv) STRING Analysis
All 36 T2DMTB genes were included. Among the genes identified from other approaches, only the genes differentially expressed were included among the following datasets: between diabetic patients and normals (GSE26168), host genes susceptible to TB (12 genes), regulators of miR-146a (3 genes), genes targets of miR-146a (8 genes). The invariant genes in Human genomes [55] were also included and the entire gene set was interrogated using STRING [56]. The connections between genes with score >= 0.7 only were considered.
iv) Pathways Enrichment
The STRING output provided a list of 120 significant pathways (FDR < 0.05). Our goal was to identify the pathways with potential to render susceptibility to Tuberculosis in diabetic patients. We therefore excluded 54 disease pathways from the list. Pathways information for genes not output by STRING were manually searched for their pathways and then included in Biological Network Simulation (BioNSi).
vi) Biological Network Simulation
BioNSi [35], a biological network simulator, was used to simulate the pathways in normals and T2DM patients. The BioNSi is a discrete biological network simulator tool. Pathways were imported and merged into a large network for simulation. The average MAD Z-score of normalized expression values for normals as well as T2DM patients were provided as input to BioNSi. Based on the expression values of the genes a state value in the range 0-9 is assigned. Subsequently, the connections between the regulators of and targets of hsa-miR-146a were added manually (Supplementary Table S2). 29 nodes (genes) in the merged network of pathways were connected to miR-146a. These connections included the differentially expressed 3 regulators and 8 targets of miR-146a. The initial state of miR-146a in diabetics was set to '6', while in normals it was set to '9' using the scaling criteria of gene expression values of BioNSi.
The initial states assigned based on gene expression values is updated during the course of simulation using a state updation function. We used the default set up in the BioNSi tool for this purpose. Authors of BioNSi have also provided a Python script to calculate the differences between the simulation contours for a given gene and rank them in terms of the differences in the state values during the course of simulation. This information was used to trace back to pathways and we selected the highly perturbed pathways between the disease state and the normal state as the one in which multiple genes in the same pathway showed differences in the states.