Jakarta is the capital of Indonesia and is considered as one of the most vulnerable cities to climate-related disasters, including flooding, sea-level rise, and storm surge, in the world. Therefore, the development of a flood-forecasting system for Jakarta is crucial. However, the accurate prediction of flooding in Jakarta is challenging because of the rapid flood-concentration time in highly urbanized basins and the shortage of rainfall data in poorly gauged areas. The aim of this study is to simulate flood inundation that occurred in recent years using global satellite mapping of precipitation (GSMaP) products. The GSMaP products (NRT and Gauge V7) were evaluated and compared with the observation data obtained hourly from five ground stations in the Ciliwung River Basin. In addition, a rainfall-runoff and flood inundation model were applied to the target basin. The results of the analysis showed that the GSMaP Gauge data were more accurate than the GSMaP NRT data. However, the GSMaP Gauge could not be used to provide real-time rainfall data and is, therefore, inadequate for real-time flood forecasting. We conclude that the GSMaP Gauge is suitable for replicating past flood events, but it is challenging to use the GSMaP NRT for real-time flood forecasting in Jakarta.
Research article
Flood Inundation Simulations based on GSMaP Satellite Rainfall Data in Jakarta, Indonesia
https://doi.org/10.21203/rs.3.rs-86386/v1
This work is licensed under a CC BY 4.0 License
You are reading this latest preprint version
GSMaP
Flood inundation simulation
Rainfall runoff simulation
Jakarta
Indonesia
Chiliwung River
Jakarta is considered to be one of the most vulnerable cities in the world to climate-related disasters, such as flooding, sea-level rise, and storm surge (Firman et al. 2011). Jakarta has experienced several flood disasters in the past, including in 1996, 2002, 2007, 2013, and 2020. These floods not only led to severe economic damages but also human casualties.
Several studies related to flood problems in Jakarta have been conducted. Moe et al. (2016) applied a rainfall-runoff and flood inundation model to the 2013 flood event and concluded that a shortage of capacity in the lower Ciliwung and other rivers accounted for 79.6% of the total flood inundation volume in Jakarta, with urbanization and land subsidence contributing to 20.4%. According to Bricker et al. (2014), the reduced capacity of the drainage system generated by trash-clogging flood gates is a factor that causes flooding. Budiyono et al. (2016) and Januriyadi et al. (2018) reported that climate change in the future would increase flood risk in Jakarta.
In these flood-prone situations, several countermeasures have been implemented in Jakarta to mitigate flood damages, such as dredging and diversion tunnels. However, flood risk in Jakarta is still high, and more than 60 people were killed in Jakarta during the most recent flood event that occurred in January 2020. A flood-forecasting system is required in Jakarta to ensure early evacuation and prevent traffic jam during flood disasters. Nevertheless, the development of a flood-forecasting system in Jakarta is a challenging task because of the rapid flooding of rivers and canals and the shortage of rainfall data attributed to uncertainty in predicting rainfall.
In this study, we analyzed whether satellite rainfall data can be used as an input for real-time flood forecasting in Jakarta because of the discontinuation of rainfall radars in 2013 owing to high maintenance costs. Various satellite rainfall products can be accessed and downloaded freely, and the data are provided in near real-time worldwide. We used global satellite mapping of precipitation (GSMaP) products as the satellite rainfall data in this study. GSMaP products have been evaluated and verified through comparison with observation data in several previous studies.
Based on a verification study of hourly GSMaP rainfall conducted by Setiawati and Miura (2016), GSMaP-MVK data can be used to replace rain gauge data, particularly for lowland areas in the Kyusyu region, Japan, if inconsistencies and errors are resolved. However, without bias correction, significant underestimation of the heavy rainfall events will be observed. Moreover, the current algorithm of the microwave radiometer of the GSMaP does not consider topographical effects (Setiawati and Miura 2016). Other researchers also reported underestimation via the GSMaP (Fu et al. 2011; Admojo et al. 2018; Pakoksung and Takagi 2016). Fu et al. (2011) evaluated the accuracy of the GSMaP using a gauge station in a basin in China and found that GSMaP products generally underestimated the precipitation amount. Additionally, GSMaP rainfall data are less accurate when used for mountainous regions than flat areas owing to the occurrence of topographical rainfall. Conversely, Tian et al. (2010) reported that satellite products (e.g., GSMaP) overestimate rainfall in the summer based on the estimations over the contiguous United States.
Hence, GSMaP rainfall products provide less accurate results compared to gauge-based rainfall networks or radar rainfall information systems. Nevertheless, GSMaP rainfall products are often used as an input for hydrological models in simulating flood events. Admojo et al. (2018) and Pakoksung and Takagi (2016) statistically evaluated satellite rainfall products, including the GSMaP, and applied hydrological simulations to a large river basin in Thailand using satellite data. They showed acceptable model results to simulate the observed discharge in a river basin. Additionally, the bias correction (Sayama et al. 2012) of satellite rainfall products and the ensemble flood simulation methods (Jiang et al. 2014) have been successfully used for flood simulations in large-scale basins. Sayama et al. (2012) applied a hydrological model with a bias-corrected GSMaP for flood inundation simulation in Pakistan to provide additional information for flood relief operations. The simulated flood inundation area reasonably matched well with the actual area even though the satellite rainfall products were used as the input for the simulation.
These literature reviews indicate that the accuracy of GSMaP data should be verified for several cities and regions before being used in practice. In several studies, hydrological models were applied with satellite rainfall data to large basins, where the flood travel time is relatively slow. However, GSMaP evaluation investigations of highly urbanized cities prone to rapid flooding in rivers and subjected to local convective rainfall owing to urban heat environment or humid tropical climate have not been conducted in detail.
The main objective of this study is to investigate a satellite-based rainfall product for the flood inundation modeling of a flood event in Jakarta, which is a mega Asian city located in a humid tropical region. Satellite-based rainfall can be used to reconstruct historical flood events. A problem faced by developing countries is the evaluation of historical flood events with insufficient survey and hydrological observation data. Thus, GSMaP data was also evaluated in this study as the input rainfall data to simulate the historical flood events in Jakarta, including the most recent large-flood event that occurred in January 2020.
Study Area
Jakarta is the capital of Indonesia and is located on the northwest coast of Java island. Jakarta is the largest metropolitan city in Indonesia, and its development is progressing rapidly.
The rainy season in Jakarta begins in November and ends in March, and the peak rainfall intensity often occurs in January and February. Thirteen main rivers flow through the region, with the Ciliwung River being the longest. The area selected for this study included Jakarta and the surrounding river basins, which cover a total of 1,346.6 km2 (Fig. 1). It should be emphasized that Jakarta is a highly urbanized area with complex urban systems of river channels and canals, buildings, and roads. Thus, the flood concentration time is relatively short (approximately 12–16 h), which creates problems regarding the use of warning systems, evacuation, and the prevention of traffic congestion.
Almost every year, Jakarta experiences flooding in January, February, or both owing to high rainfall with insufficient capacity flows in the drainage system. Details of the floods and damages are listed in Table 1. In Table 1 the damage cost and main damages were obtained from several sources such as web online news and several reports and the values of the rainfall, water level and flooded area were obtained from the observed data. In the 2013 flood event, the failure of an embankment on the west drainage canal at Laturharhari occurred, and city’s financial core, including the president palace, were inundated, which led to the death of 41 people. In 2020, at least 67 people were killed, and 60,000 were displaced in the worst flooding that has occurred in the area since 2007.
Dataset
For the rainfall-runoff and flood inundation simulation, the following data were used. A digital elevation model data set of the Shuttle Radar Topography Mission having a 30 m resolution was used in this study. The river cross-sectional and drainage system data for the Ciliwung River recorded in 2011 were obtained from the project authority of the Japan International Cooperation Agency. Water-level and river-flow discharge data for the Ciliwung River and a flood inundation map of Jakarta were provided by Badan Penanganan Bencana Daerah (Jakarta Disaster Management Agency).
Satellite rainfall products
The GSMaP project was implemented in 2002 to develop retrieval algorithms of rainfall rates and to produce high-resolution global precipitation maps based on satellite data (Ushio et al. 2009; Aonashi and Liu, 2000). GSMaP products are distributed by the Japan Aerospace Exploration Agency (JAXA) Global Rainfall Watch. GSMaP Now, GSMaP NRT, and GSMaP MVK are provided by JAXA.
GSMaP Now only allows the extrapolation of rainfall maps every 30 min; therefore, the accuracy of the data may be relatively low. Moreover, it only provides data for 2017, 2018, and 2019. GSMaP MVK is a reanalysis version of GSMaP NRT and has a resolution of 0.1°/h with a domain coverage from 60° N to 60° S. It was available from March 2000 until December 2010. GSMaP NRT uses the same algorithm with GSMaP MVK, and it has been available since October 2008. GSMaP NRT is released every hour (4 h latency), and a Kalman filter algorithm is applied to the data (Ushio et al. 2009). GSMaP Gauge V7 is a calibrated version based on the ground gauge data and yields high accuracy. Its data has been available since March 2014.
In this study, we evaluated the data using GSMaP NRT and GSMaP Gauge V7. GSMaP NRT can be used as the input for a real-time flood-forecasting system, and GSMaP Gauge can be used for reconstructing past flood events. The simulated data were compared with ground observation data.
Ground observation rainfall data
Hourly rainfall data were obtained for the target area from Badan Meteorologi, Klimatologi dan Geofisika (Indonesian Agency for Meteorology, Climatology, and Geophysics). We evaluated the uncertainties in the hourly satellite rainfall data from the Citeko, Darmaga, Pondok Betung, Kemayoran, and Tanjung Priok stations (Fig. 1). The average rainfall of the basin for January and February of 2015–2020 were obtained from both GSMaP NRT and GSMaP Gauge data.
Flood inundation model
As mentioned earlier, we modeled the flood inundation in Jakarta based on rainfall-runoff (Kure and Yamada 2004; Kure et al. 2008) and flood inundation modeling (Moe et al. 2017). The flood inundation model comprised a rainfall-runoff module for each sub-basin, hydrodynamic module for the rivers and canal networks, and flood inundation module for the flood plains.
For the rainfall-runoff simulation, the distributed rainfall-runoff model used by Kure and Yamada (2004) and Kure et al. (2008) was adopted because this model can be used to simulate the Horton overland flow in urban areas, as well as subsurface and saturation overland flow in mountainous areas. These flows depend on the relationship between the soil and geological characteristics, and the intensity of rainfall on hillslopes.
Saint-Venant equations for the conservation of continuity and momentum were applied to the river flood routing and drainage systems. Unsteady two-dimensional flow equations, i.e., the continuity and momentum equations, were numerically solved for the flood inundation simulation of the flood plain.
The rainfall-runoff and flood inundation model were applied to the 2013 flood event based on the radar rainfall data and were validated against the observations (see Moe et al. 2016; 2017) for the calibrated parameters and details of the simulations.
In this study, the flood observation data and the map and flood inundation simulation modeled using the GSMaP rainfall input were compared.
Target flood events
Six yearly largest-flood events from 2015 to 2020 were selected as the target in this study because both GSMaP NRT and GSMaP Gauge data are available for these flood events. These events produced the highest water levels at the Chiliwung river stations during these years. The event periods lasted for approximately a week in January or February.
Evaluation index
We compared the accuracy of the GSMaP products and examined the rainfall data of the study area. Statistical validation methods, such as the root mean square error (RMSE), correlation coefficients (CCs), and volume bias, were used as evaluation indexes; these were employed to evaluate the relationship between the GSMaP and observed rainfall data. The RMSE was used to compare the magnitude of error between the GSMaP and observation data sets. The CC represented the correlation between the data sets; its value ranged between zero and one. The volume bias (%) is the difference in the percentages of the total rainfall volume between the GSMaP and ground rainfall observation. It is calculated using the following equation: (100 × ((GSMaP − Observation) / Observation)).
The best performance was observed for the 2015 event, as listed in Table 2. Figures 2 and 3 show the hourly and daily comparisons, respectively, between the basin-averaged GSMaP and rainfall observation data for the 2015 flood event. In this best case, we confirmed relatively strong correlations, particularly for the GSMaP gauge and observation data. Figures 4 and 5 show the hourly and daily comparisons, respectively, between the average basin observation and GSMaP data for the 2016 flood event. In this case, relatively weak correlations existed. Table 2 lists a summary of the evaluation index data. The accuracy of the GSMaP data was not very high (Table 2). Only weak correlations were found for the flood events from 2017 to 2020. Overestimation of the GSMaP was observed for the 2017 and 2018 events, whereas underestimations were observed for the 2019 and 2020 events. In Jakarta, heavy rainfall occurs mainly owing to convection cells, which represent typical atmospheric conditions around humid tropical regions. It may be challenging to use the satellite to capture this rainfall type for short durations and at limited regions.
Flood hydrograph
We performed rainfall-runoff and flood inundation simulations using the GSMaP rainfall data as the input and compared the observed and simulated results.
Figures 6–11 show the hydrographs for the observations at the Katulampa, Depok, and Manggarai stations and the corresponding simulations for the 2015–2020 flood events. The locations of the stations can be seen in Fig. 1. The simulated hydrographs showed relatively good agreement with the observations, but some underestimations and/or overestimations occurred.
For the 2015 flood event (Fig. 6), flood peak discharges were captured through GSMaP gauge simulations at the Katulanmpa and Depok stations, but apparent peak time differences were noticed. At the Manggarai station, the GSMaP gauge simulation was overestimated compared to the observation. For 2016, 2017, and 2019 flood events (Figs. 7, 8, and 10), several high flood-flow fluctuations were observed and simulated, but the simulated flood hydrograph occasionally overestimated and underestimated the observations. The simulation results of the GSMaP gauge simulations for the 2018 event showed a good correlation (Fig. 9). The flood peak timing and values of the 2018 flood event were accurately simulated, but the GSMaP NRT simulations did not show any floods in the event. For the 2020 flood event, GSMaP NRT and gauge simulations achieved relatively good performance. The simulation results are presented in Table 3. The peak bias (%), CCs, RMSE, and Nash–Sutcliffe efficiency index (NSE) were computed (Table 3). The NSE values ranged from minus infinity to 1; an efficiency index of 1 indicates a perfect much. From Table 3, it can be noticed that the Gauge simulations are better than the NRT simulation, especially for the 2018 event. Several NRT simulations yielded negative NSE values, which signified that these simulations were not useful for flood prediction.
Based on the comparison, GSMaP gauge-based simulations were found to be significantly better than GSMaP NRT-based simulations. Significant underestimation of the GSMaP NRT simulation occurred, compared to the observation. GSMaP NRT data were designed as input for the flood-forecasting simulations because these data sets provided near real-time rainfall data. However, in terms of accuracy, the GSMaP NRT data were unsuitable for the real-time forecasting of flooding in Jakarta, and significant bias corrections or modifications are required to obtain more accurate simulation results. Finally, it should be emphasized that GSMaP gauge-based simulations showed relatively good performance. These results encourage us to use satellite-driven rainfall data to reconstruct historical flood events in poorly gauged basins and developing countries, even when the target areas are highly urbanized.
Flood inundation
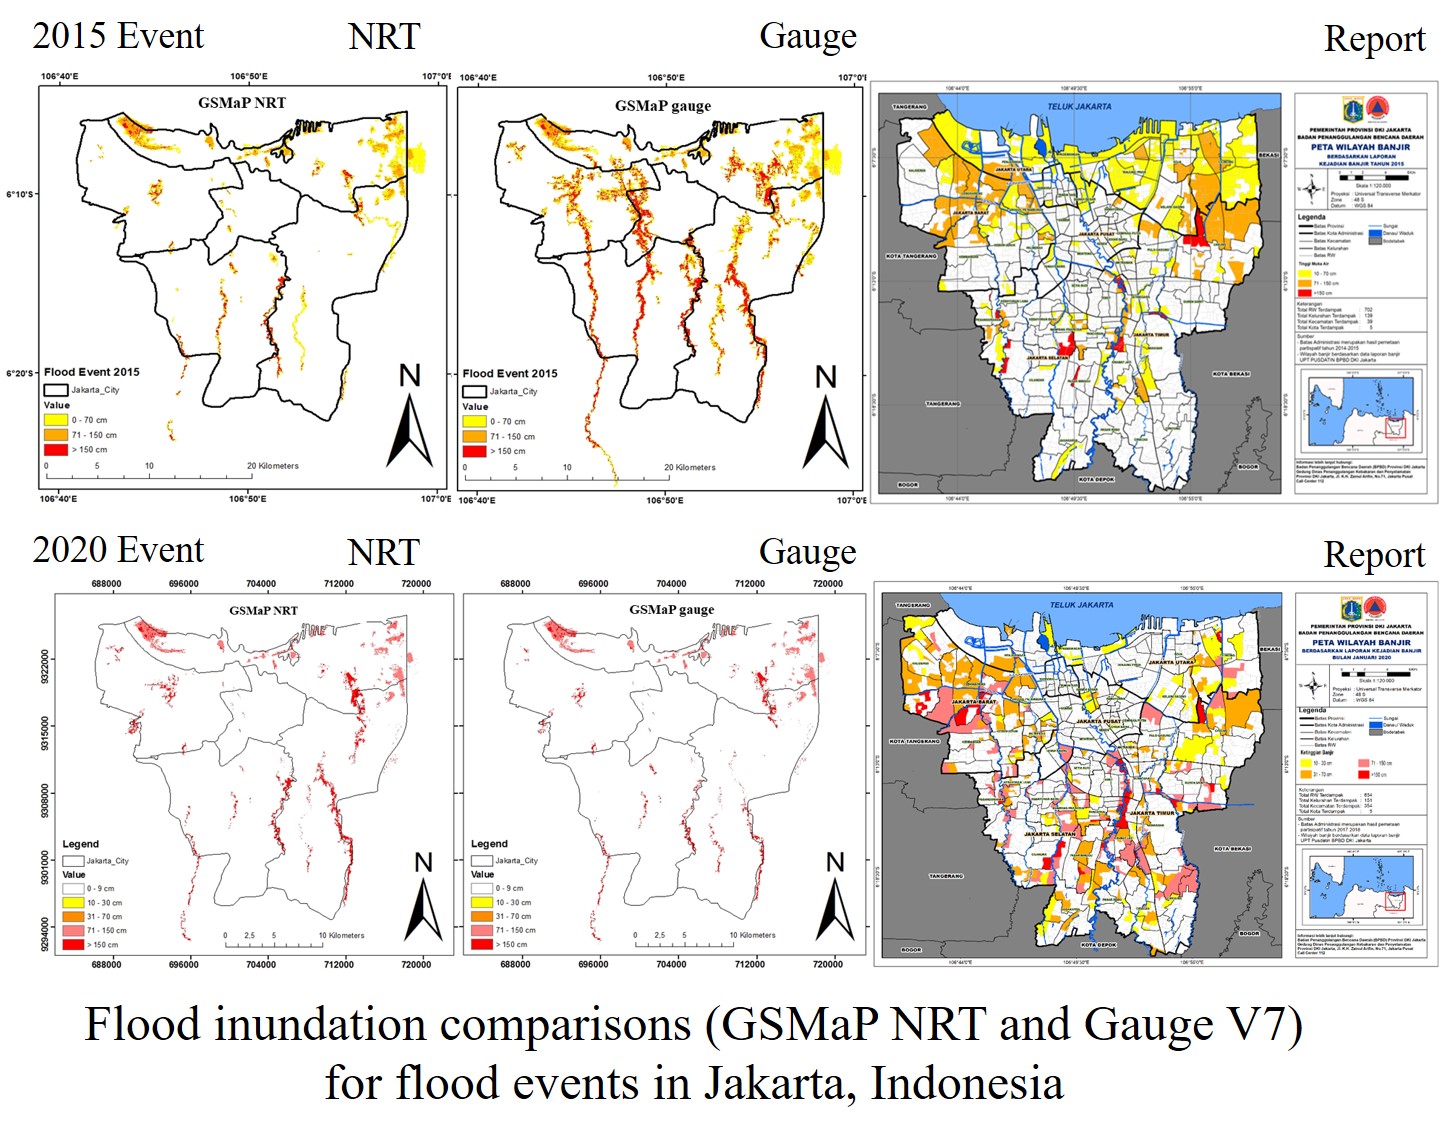
The flood inundation conditions were also compared. Figures 12–17 show flood inundation maps based on the simulation and observation data for 2015–2020 flood events. The observed flood inundation maps were provided by the National Disaster Management Agency. These observation maps were based on eyewitness reports of government officers during the flood events and interviews with residents after the event. Hence, the observation maps tended to overestimate data because a report for the flooding of a part of a district may suggest that the entire district in the map was inundated. The simulation of the flood inundation results using the GSMaP Gauge showed relatively good consistency with the observations, particularly for 2015, 2017, 2018, 2019, and 2020. The GSMaP NRT captured the flood inundation for 2015, 2016, and 2020 events but could not capture the inundation for 2018.
From these results, we concluded that the GSMaP Gauge data could be used to reproduce previous flood inundation events in Jakarta. However, it is challenging to use GSMaP NRT data as the input in a real-time flood-forecasting system owing to its low accuracy.
Several previous studies have shown that the GSMaP performs better than other satellite-based rainfall products, such as the GPM, TRMM, and 3B42RT, because of the high spatial and temporal resolutions of the GSMaP. However, based on the comparison between gauge-based observations and satellite-based GSMaP rainfall data, we found that the GSMaP NRT is not useful as the input of the real-time flood-forecasting system in Jakarta.
Many reasons are attributed to this difficulty in capturing heavy rainfall in Jakarta. First, the flood travel time in Jakarta is short. Jakarta and its surrounding areas are highly urbanized, and the flood travel time in rivers and canals is approximately 12–16 h. Local heavy rainfall should be captured hourly using the satellite to predict rapid floods. In previous studies, the GSMaP was evaluated at large-scale basins daily and monthly. This rapid-flood response to rainfall is a challenge for GSMaP prediction in Jakarta.
Second, Jakarta and its surroundings are highly urbanized areas, and convectional rainfall typically occurs in the urban areas of humid tropical regions. In addition, heat island phenomenon is significantly progressing in Jakarta, and local heavy rains regularly fall for short periods. The convectional rainfall, just like the topographical rainfall, is difficult to be predicted and captured using satellite information. This convection-type rainfall is another challenge for the accurate prediction of rainfall in Jakarta.
Some researchers applied a bias correction method for rainfall simulation using the GSMaP algorithm to reduce the underestimation of rainfall intensity and amount. However, for Jakarta, the difficulties mentioned above complicate the application of bias correction because GSMaP simulations occasionally overestimated and/or underestimated the flood-flow discharge of the 2016 and 2017 flood events. Moreover, GSMaP NRT simulations did not show any flood responses for the 2018 event. In these situations, it is difficult to apply bias correction for the GSMaP NRT data.
Multi-ensemble forecasting using several satellite rainfall products have been performed in previous studies. However, the temporal and spatial resolutions of other satellite products are inadequate for capturing local heavy rainfall in Jakarta. Therefore, it is currently challenging to use the GSMaP as the input for the real-time forecasting system. Radar information adjusted with ground gauge-based rainfall data is a more viable option for the forecasting system. It should be noted that the five rain gauge stations might be insufficient for capturing rainfall fields in Jakarta. Hence, the suitable rain gauge stations and the radar information system should be installed to predict rainfall and flood events in Jakarta accurately.
GSMaP gauge data might be useful for reconstructing and simulating historical flood events for evaluating and comparing floods that occurred in the past in poorly gauged basins. This is because the GSMaP gauge can be used to observe heavy rainfall that occurred in the past.
This study was conducted to examine the possibility of using GSMaP rainfall data as the input for real-time flood forecasting in Jakarta, Indonesia. The NRT and Gauge V7 products of the GSMaP were compared with ground observation rainfall data at several stations and basin averaged formed around Jakarta. The results indicated that the GSMaP Gauge data showed acceptable accuracy in simulating flood hydrograph and inundation of Jakarta. However, the gauge data were unavailable in real-time, and thus, could not be used for real-time forecasting. The gauge data is suitable for replicating historical flood events that occur even in highly urbanized areas.
The GSMaP NRT product, which provided near-real-time rainfall data, was suitable for real-time flood forecasting. However, it is necessary to develop a significant bias correction method or change the algorithm of the NRT data set adjusted for urban areas to improve the accuracy of the simulation results.
GSMaP: Global Satellite Mapping of Precipitation; RMSE: Root Mean Square Error; CCs: Correlation Coefficients; NSE: Nash–Sutcliffe Efficiency index;
Availability of data and material
The datasets supporting the conclusions of this article are currently not available in any repository. But the authors are willing to share the data based on the requests. Please contact the corresponding author for data requests.
Competing interests
The authors declare that they have no competing interest.
Funding
This research was performed by the Environment Research and Technology Development Fund (JPMEERF15S11415) of the Environmental Restoration and Conservation Agency of Japan.
Authors' contributions
BP analyzed the data and conducted numerical experiments. SK designed the study and leads the project. RY supported the numerical experiments. NJ supported the field work and data collections. All authors read and approved the final manuscript.
Acknowledgements
We appreciate S-14 project, particularly to Prof. So Kazama at Tohoku University, to guide the research project in Indonesia.
- Admojo DD, Tebakari T, Miyamoto M (2018) Evaluation of a satellite-based rainfall product for a runoff simulation of flood event: a case study. Journal of Japan Society of Civil Engineers Ser B1(4):I_73–I_78 74(
- Aonashi K, Liu G (2000) Passive microwave precipitation retrievals using TMI during the Baiu period of 1998. Part I: algorithm description and validation. J Appl Meteorol 39(12):2024–2037
- Bricker JD, Tsubaki R, Muhari A, Kure S (2014) Causes of the January 2013 canal embankment failure and urban flood in Jakarta, Indonesia. Journal of Japan Society of Civil Engineers Ser B1 (Hydraulic Engineering) 70:91–96
- Budiyono Y, Aerts JCJH, Tollenaar D, Ward PJ (2016) River flood risk in Jakarta under scenarios of future change. Nat Hazards Earth Syst Sci 16:757–774
- Firman T, Surbakti IM, Idroes IC, Simarmata HA (2011) Potential climate-change related vulnerabilities in Jakarta: Challenges and current status. Habitat International 35:372–378
- Fu Q, Ruan R, Liu Y (2011) Accuracy assessment of Global Satellite Mapping of Precipitation (GSMaP) product over Poyang Lake Basin, China. Procedia Environmental Sciences 10:2265–2271
- Januriyadi NF, Kazama S, Moe IR, Kure S (2018) Evaluation of future flood risk in Asian megacities: a case study of Jakarta. Hydrological Research Letters 12(3):14–22
- Jiang S, Ren L, Hong Y, Yang X, Ma M, Zhang Y, Yuan F (2014) Improvement of Multi-Satellite Real-Time Precipitation Products for Ensemble Streamflow Simulation in a Middle Latitude Basin in South China. Water Resource Manage 28:2259–2278
- Kure S, Watanabe A, Akabane Y, Yamada T (2008) Field observations of discharge and runoff characteristics in urban catchments area. Proceedings of the 11th International Conference on Urban Drainage, Edinburgh, Scotland, 1–5 Sept 2008
- https://www.academia.edu/23187664/Field_Observations_of_Discharge_and_Runoff_Characteristics_in_Urban_Catchments_Area Accessed 17 Sept 2020
- Kure S, Yamada T (2004) A study the nonlinearity of runoff phenomena and estimation of effective rainfall: Proceedings of the 2nd Asia Pacific Association of Hydrology and Water Resources Conference, 2:76–85, Singapore, 5–8 July 2004
- http://rwes.dpri.kyoto-u.ac.jp/~tanaka/APHW/APHW2004/proceedings/OHS/56-OHS-A701/56-OHS-A701.pdf Accessed 17 Sept 2020
- Moe IR, Kure S, Farid M, Udo K, Kazama S, Koshimura S (2016) Evaluation of flood inundation in Jakarta using flood inundation model calibrated by radar rainfall. Journal of Japan Society of Civil Engineers Ser B1 (Hydraulic Engineering) 72(4):I_1243–I_1248
- Moe IR, Kure S, Januriyadi NF, Farid M, Udo K, Kazama S, Koshimura S (2017) Future projection of flood inundation considering land use change and land subsidence in Jakarta, Indonesia. Hydrological Research Letters 11(2):99–105
- Pakoksung K, Takagi M (2016) Effect of satellite based rainfall products on river basin responses of runoff simulation on flood event. Model. Earth Syst. Environ., 2:143, 2016
- Sayama T, Ozawa G, Kawakami T, Nabesaka S, Fukami K (2012) Rainfall-runoff-inundation analysis of the 2010 Pakistan flood in the Kabul River basin. Hydrological Science Journal 57(2):298–312
- Setiawati MD, Miura F (2016) Evaluation of GSMaP daily rainfall satellite data for flood monitoring: Case study–Kyushu Japan. Journal of Geoscience Environment Protection 4(12):101–117
- Tian Y, Peters-Lidard CD, Adler RF, Kubota T, Ushio T (2010) Evaluation of GSMaP precipitation estimates over the contiguous United States. J Hydrometeorol 11(2):566–574
- Ushio T, Sasashige K, Kubota T, Shige S, Okamoto KI, Aonashi K, Inoue T, Takahashi N, Iguchi T, Kachi M, Oki R, Morimoto T, Kawasaki ZI (2009) A Kalman filter approach to the Global Satellite Mapping of Precipitation (GSMaP) from combined passive microwave and infrared radiometric data. Journal of the Meteorological Society of Japan Ser II 87A:137–151
Table 1. Summary of historical flood events.

Table 2. Evaluation index of rainfall comparisons

Table 3. Summary of discharge hydrograph comparisons
