Isolation and identification of sEVs from ADSCs
Human adipose tissue samples were obtained from consenting female donors. ADSCs were isolated according to a previously reported procedure and grown in Dulbecco’s modified Eagles medium/Nutrient Mixture F-12 (DMEM/F12; Thermo Fisher Scientific, USA) supplemented with 10% fetal bovine serum (FBS; Gibco, USA) [46]. The medium was changed every 3 days and cells were sub-cultured at a ratio of 1:3 after trypsinization. When the ADSCs reached 80–90% confluence, sEVs-depleted medium was used for cell culture. The medium on which ADSCs had been cultured was collected and centrifuged at 300 g for 10 min and at 2000 g for 10 min at 4 °C. The supernatant was sterilized by filtration through a 0.22 μm filter (Steritop, Millipore, USA) to eliminate dead cells and debris. The sterilized supernatant was transferred to an Amicon Ultra-15 Centrifuge Filter (Millipore) and centrifuged at 4000×g until the volume was reduced to approximately 200 µl. Then, the liquid was layered on a 30% sucrose/D2O cushion and subsequently centrifuged at 10,000×g for 60 min using an Optima L-100 XP Ultracentrifuge (Beckman Coulter). Partially purified sEVs were recovered using an 18 g needle, diluted in PBS, and centrifuged at 4000 × g until the final volume reached 200 µl. The isolated ADSC-sEVs were stored at −80°C for further experiments.
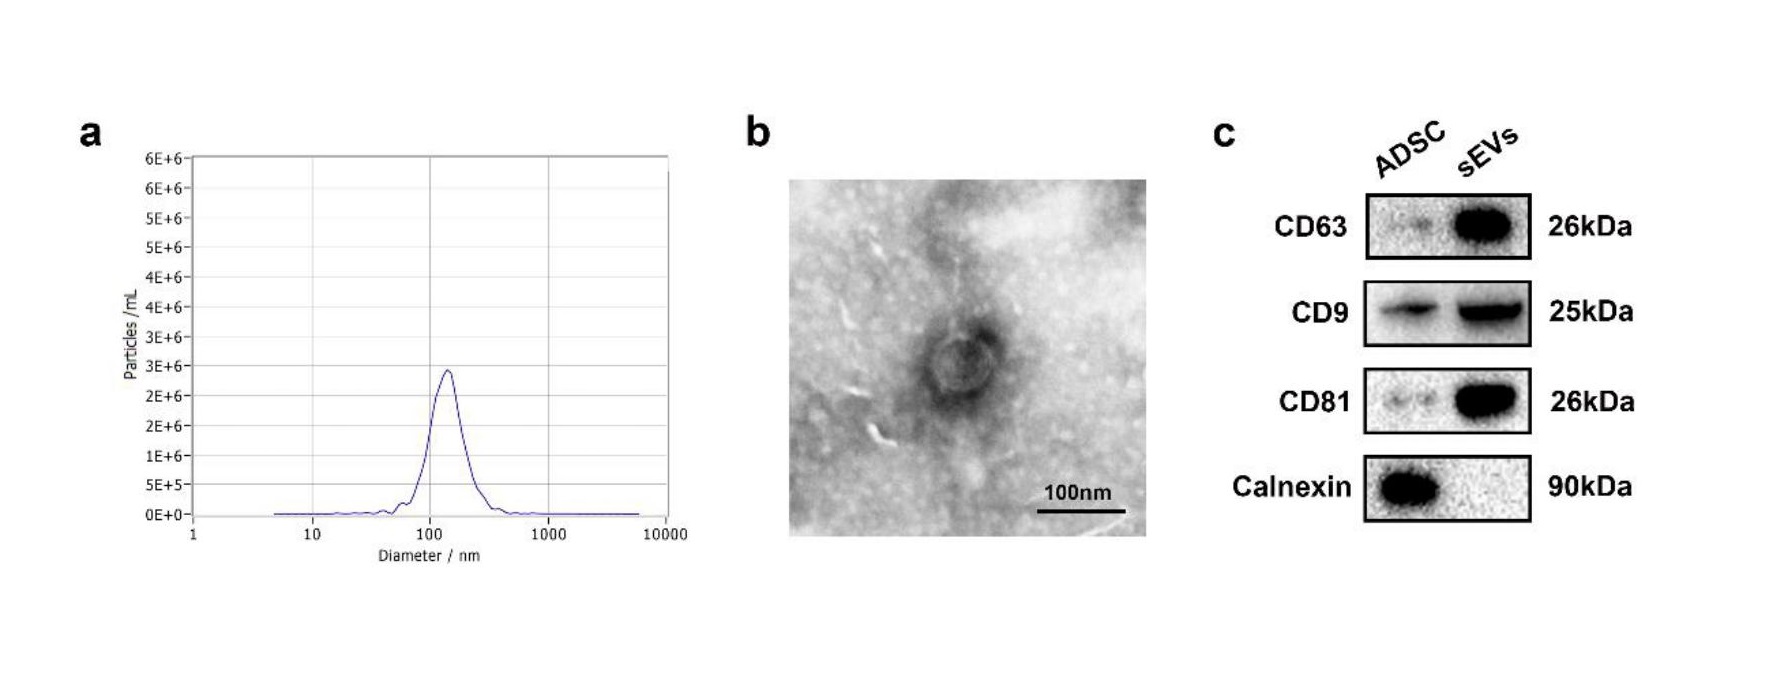
The morphology of sEVs was determined using a transmission electron microscope (TEM; Tecnai 12; Philips, Best, The Netherlands). Nanosight tracking analysis (NTA, Nanosight Ltd., Novato, CA) was used to analyze size distribution of sEVs. The specific surface markers of sEVs including CD9, CD63, and CD81 were detected by western blot.
Primary cortical neuron culture
Primary cultured cortical neurons were isolated from embryonic day-18 Sprague–Dawley (SD) rats as previously reported [47]. Briefly, after isolation of the cerebral cortex and gently removing the meninges, brain cortices were sliced into 1-mm3 sections, digested using 0.25% trypsin– EDTA solution (Thermo Fisher Scientific, MA, USA) for 20 min at 37℃ after which the reaction was stopped by adding horse serum (SigmaAldrich). Next, cells were collected by centrifugation for 5 min (1000 rmp/min) at 4°C and resuspended in DMEM/F-12 containing 10% horse serum, glutamine (0.5 mM; Gibco) and 1% penicillin–streptomycin (Thermo Fisher Scientific). After counting, the neurons were seeded on poly-D-lysine-coated plates and the medium was replaced with serum-free Neurobasal medium (Thermo Fisher Scientific, USA) supplemented with 2% B27 (Gibco Laboratory, Grand Island, NY), glutamine (0.5mM; Thermo Fisher Scientific) and 1% penicillin–streptomycin. The culture medium was half-replaced every other day.
ADSCs-sEVs uptake
Purified ADSC-sEVs were fluorescently labeled using Dil (Molecular Probes, Eugene, OR, USA) according to the manufacturer’s instructions. First, 4 mg/mL Dil solution was added to the PBS (1:200) and incubated for 15 min at 4 °C. The mixture was ultracentrifuged at 100,000×g for 1 h to remove excess dye from the labeled sEVs. These Dil-labeled sEVs were co-cultured with neurons and bEnd.3 cells for 24 h and the cells were subsequently washed three times using PBS and fixed in 4% paraformaldehyde. Afterwards, ADSC-sEVs uptake was visualized using a confocal microscope. To evaluate sEVs uptake in vivo, DiI-sEVs were intravenously injected into SCI model mice. Mice were anesthetized and frozen sections were prepared. Then, sections were stained using 4′,6-diamidino-2phenylindole (DAPI) and observed by fluorescence microscopy.
Overexpression of TSG-6 in ADSCs
To evaluate the functions of TSG-6, ADSCs were transduced with a TSG-6 overexpressed lentiviral vector while an empty vector construct was used as the negative control for TSG-6. The lentiviral-TSG-6 sequences were: forward, CGCGCTAGCATGATCATCTTAATTTAC, and reserve, CGCACCGGTTTATAAGTGGCTAAATCTT. To perform lentiviral transfection, ADSCs were cultured in lentivirus‐containing medium for 4-6 h at 37 ℃ according to the manufacturer's guidelines. Then, the lentivirus was removed and fresh medium was added to continue cultivating cells for 48 h.
Oxygen-Glucose Deprivation and Reperfusion (OGD/R) Model
The OGD/R model was established to mimic SCIRI in vitro as previously described [48]. Briefly, primary neurons were cultured in sugar-free medium and then placed in an airtight chamber that was flushed with a continuous flux of gas mixture (95% N2/5% CO2) for 15 min. Afterwards, the chamber was sealed and placed in a 37°C incubator for an additional thirty minutes of OGD. Neurons were then maintained in a normal medium under normoxic culture conditions for 12 h.
Apoptosis detection by TUNEL staining and flow cytometry, in vitro
To detect apoptosis following OGD/R injury, neurons or bEnd.3 cells were incubated with terminal deoxynucleotidyl transferase dUTP nick end labeling (TUNEL) solution (Roche, Basel, Switzerland) for 30 min according to the manufacturer’s protocols. After staining with DAPI for 5 minutes, cells were imaged using a fluorescent microscope. Apoptosis was analyzed using ImageJ (NIH, Bethesda, MD, USA) to calculate the proportion of TUNEL-positive cells.
Cell apoptosis was also detected using an Annexin V-FITC/PI apoptosis detection kit (BD Bioscience, CA, USA). Briefly, 1×10⁵ neurons were washed using PBS, stained with 10 μL of Annexin V-fluorescein isothiocyanate (FITC) and 5 μL of propidium iodide (PI) in the dark. Apoptotic cells were detected by flow cytometry (BD Biosciences, MA, USA).
Spinal cord ischemia-reperfusion injury model
The use of animals in this study was approved by the Ethics Committee of Nanjing Medical University and all procedures were in accordance with the Guidelines for the Care and Use of Laboratory Animals of the China National Institutes of Health. C57BL/6 mice (male, 20-30 g) were purchased from the Animal Center of Nanjing Medical University (Nanjing, Jiangsu). The SCIRI model was established as previously described [49]. Briefly, mice were anesthetized using pentobarbital through intraperitoneal injection and placed in a supine position. Occlusion was achieved by placing a 50 g aneurysm clip above the right renal artery near the heart for 60 min. Bladder emptying was manually performed twice daily during the experimental period. Then, mice were randomly assigned into five groups (n=8 per group); the Sham group, SCIRI group, sEVs group, Lenti-Ctrl-sEVs group, and Lenti-TSG-6-sEVs group. The SCIRI group and the other group were injected through the tail vein of PBS (200 µL), sEVs, Lenti-Ctrl-sEVs or Lenti-TSG-6-sEVs (1 × 10¹⁰ particles of sEVs, Lenti-Ctrl-sEVs or Lenti-TSG-6-sEVs per 200 µL) immediately after SCIRI.
Functional Locomotor Scores
From the first postoperative day, neurological functions of mice were analyzed at regular time points using the Basso mouse scale (BMS) as previously described [50]. The BMS ranged from 0 points, indicating complete paralysis to 9 points, indicating normal motor functions. The inclined plane test was also performed using a testing apparatus to evaluate locomotor functions in accordance with previous studies [51]. The maximum angle at which the mice could maintain its position for 5 seconds without falling was recorded. Behavioral assessments were performed by two trained observers who were blinded to the experiment.
Footprint Analysis
Footprint analysis was performed to evaluate gait and motor coordination of mice 4 weeks after reperfusion. Front and rear paws were coated with blue and red dyes, respectively. Then, mice were encouraged to walk in a straight line on white paper. The obtained footprint patterns were analyzed to assess the recovery of coordination ability.
Swimming test
Motor functions were also evaluated using the Louisville Swim Score (LSS) 4 weeks post injury. Louisville Swim Scale (LSS) was measured based on three swimming characteristics, including hind limb alternation, forelimb dependency and body position [52]. This trial was performed in duplicate.
Preparation of spinal cord slices
After euthanasia, mice were transcardially perfused with 0.9% normal saline and 4% paraformaldehyde. The spinal cord was dissected out, fixed in 4% paraformaldehyde for 24 h and sequentially dehydrated in 20 % and 30 % sucrose solutions. The tissue samples were embedded in optimal cutting temperature (OCT) and sliced into 10-μm longitudinal sections in a cryostat microtome (Leica, Germany).
Measurement of blood–spinal cord barrier permeability
The disruption of BSCB was evaluated with Evan’s Blue dye extravasation as described previously [3, 4]. Briefly, 1h after the intravenously injection of 2% EB dye (10mg/Kg), mice were perfused with saline. Spinal cord tissues were excised, immersed in methanamide for 24 h at 60 °C and centrifuged. Using a spectrophotometer (Bio-Rad, Hercules, USA), the optical density of supernatant was recorded. The concentration of EB was calculated as μg/g of spinal cord from a standard curve. Frozen sections were prepared and analyzed with a fluorescence microscope to determine the integrated optical density (IOD) of EB in spinal cord.
Determination of apoptosis in spinal cord sections with TUNEL assay
The TUNEL assay was conducted following the manufacturer’s protocols. After fixation with 4% PFA, the frozen spinal cord sections were co-stained with the TUNEL reaction solution and DAPI. The images of TUNEL-positive cells were acquired with a fluorescence microscope.
Immunofluorescence analysis
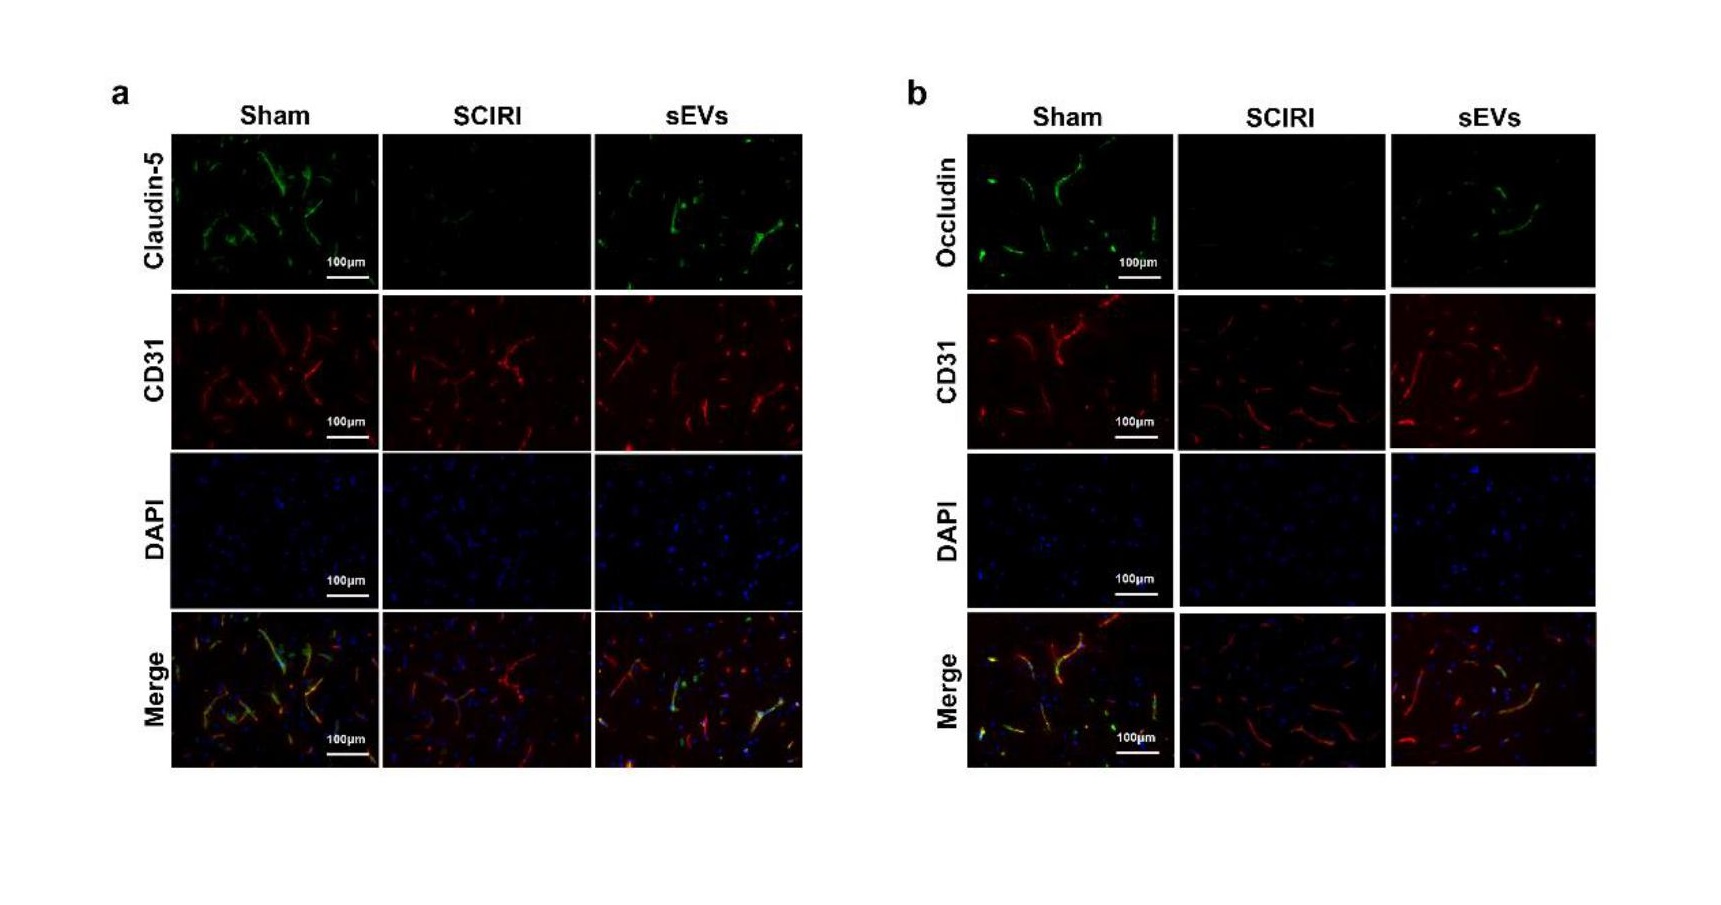
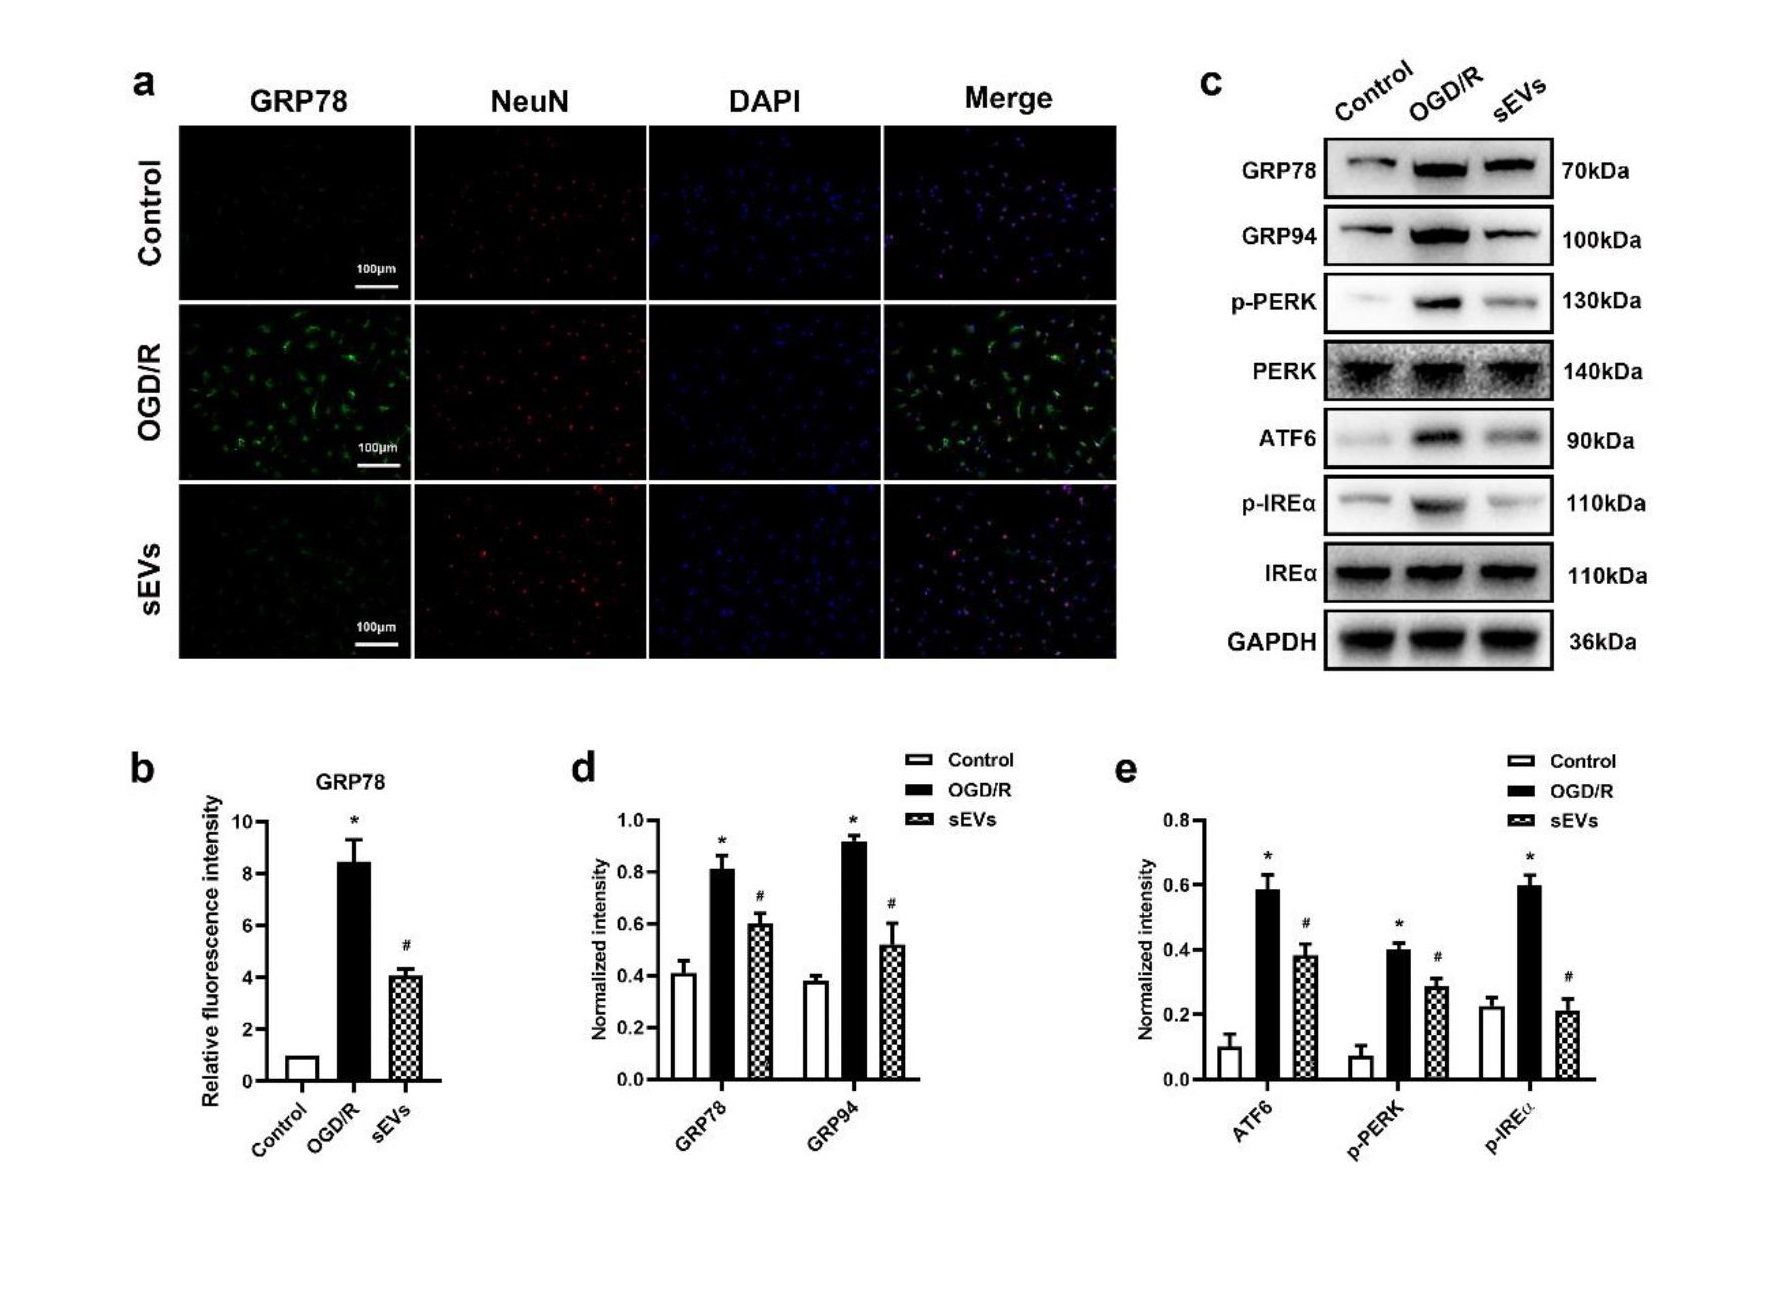
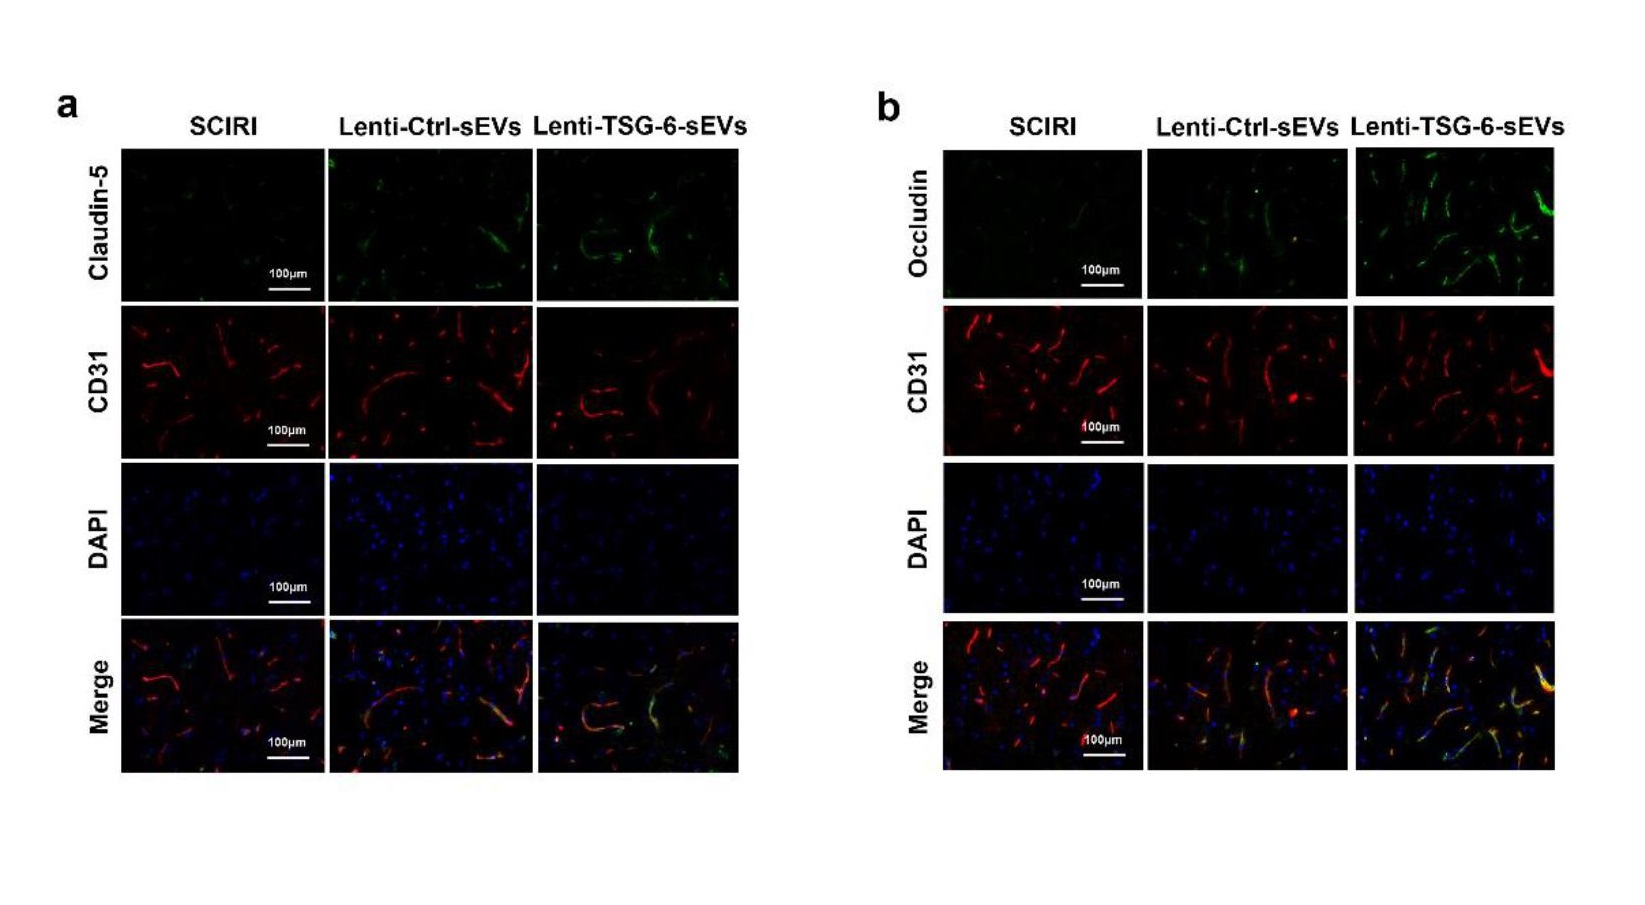
For immunofluorescence staining, cells or spinal cord sections were fixed in 4% PFA for 15 min and subsequently permeabilized in 0.2% Triton X-100/PBS for 20 min. The samples were treated with 5% bovine serum albumin (BSA) for 1h at room temperature to block nonspecific binding. The samples were incubated overnight at 4 °C with primary antibody specific for rabbit anti-ZO1 (1:50, Invitrogen), rabbit anti-claudin-5 (1:100; Invitrogen), rabbit anti-occludin (1:50; Abcam), mouse anti-CD31 (1:200, Invitrogen), mouse anti-NeuN (1:500, Abcam) and rabbit anti-GRP78 (1:200, Proteintech). Samples were washed thrice with PBS and incubated with Alexa 594- or Alexa 488-conjugated secondary antibodies (1:200, Jackson ImmunoResearch, USA) for 1 h in the dark. Finally, nuclei were labelled with DAPI and images were obtained under similar exposure time and conditions.
Western blot analysis
Proteins were isolated from cells and spinal cord tissues and quantified using the BCA assay. The protein samples were loaded on SDS–PAGE and transferred to a polyvinylidene difluoride (PVDF) membrane. Then the membranes were blocked in 5% BSA for 1h at room temperature and then treated with antibodies against cleaved caspase-3 (1:1000, Cell Signal Technology), Bcl-2 (1:1000, Abcam), Bax (1:1000, Abcam), ZO-1 (1:1000, Invitrogen), claudin-5 (1:1000; Invitrogen), occludin (1:1000; Abcam), GRP78 (1:1000, Proteintech), GRP94 (1:1000, Proteintech), p-PERK (1:1000, Abcam), PERK (1:1000, Abcam), ATF6 (1:1000, Abcam), p-IRE1α (1:1000, Abcam), IRE1α (1:1000, Abcam), AKT (1:1000, Cell Signal Technology), p-AKT (1:1000, Cell Signal Technology) and GAPDH (as a gel-loading control, 1:1000, Abcam, USA). After washing with Tris-buffered saline with Tween (TBST), the membranes were incubated with HRP-conjugated secondary antibodies (1:2000, Thermo Fisher Scientific) for 1 h at room temperature. The protein bands were visualized using Western blotting detection reagents (ECL, Beyotime Institute of Biotechnology) and normalized to the expression level of GAPDH.
Statistical analyses
Data are shown as mean ± standard deviation of at least three independent experiments. Differences between groups were compared with the Student’s t-test and one-way ANOVA. All analyses were conducted using GraphPad 8.0.2 software (La Jolla, CA, USA). P-values less than 0.05 (p<0.05) were considered statistically significant.