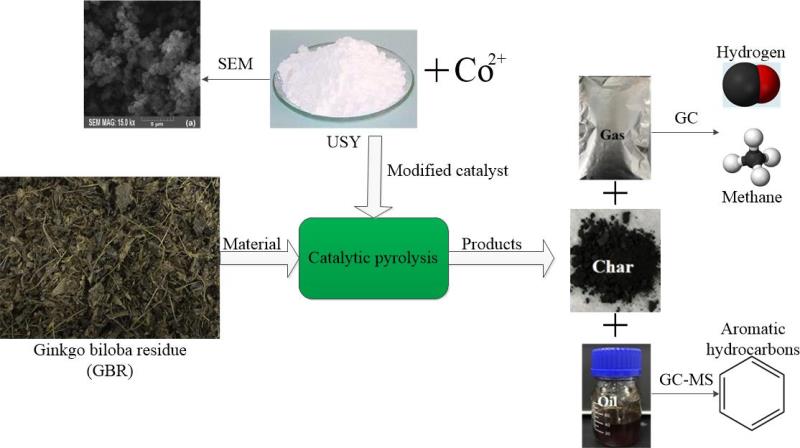
The current research studied the performance of novel and cheap catalysts, ultra-stable Y zeolites (USY) and cobalt-modified USY for the efficient production of aromatics from the ginkgo Biloba residue (GBR) using a pyrolysis reactor. Cobalt-modified USY improved the quality of the pyrolysis products e.g. removed unwanted impurities from bio-oil, increased the yield of gases, and overall boosted the GBR conversion. Under the action of USY modified with cobalt, the yield of CO, CH4, and CO2 in the gas production increased significantly, while the yield of H2 was dropped. The selectivity of naphthalene and 1-methylnaphthalene gradually decreased. The composition of aromatic hydrocarbons was reduced, while the content and selectivity ratios of toluene and xylene were increased. This study describes a high-value method using GBR, which could be used as a sustainable resource for the production of hydrocarbons, especially for the preparation of high-quality toluene and phenols.
Research Article
Aromatics Production With Cobalt-Modified Ultra-Stable Y Zeolites As Catalysts In Catalytic Pyrolysis of Ginkgo Biloba Residue
https://doi.org/10.21203/rs.3.rs-872478/v1
This work is licensed under a CC BY 4.0 License
Version 1
posted
You are reading this latest preprint version
Aromatics
Bio-oil
Catalytic pyrolysis
Co-modified USY
Ginkgo biloba residue
Wastewater treatment
The following research studies the upgrading of bio-oil from catalytic pyrolysis over Cobalt-modified USY. The Cobalt-modified USY increased the relative content of aromatic hydrocarbons. The content and selectivity ratios of toluene and xylene were increased. The yields of the bio-oil, gas products and biochar were 27.22, 40.53, and 32.25 %.
Chinese medicinal herbal residues (CMHR’s) are the rejected materials produced during the manufacturing of Chinese herbal medicine. CMHR is comprised of high calorific value, high volatile content, and low ash content (Yu et al., 2019) that make them perfect for the generation of energy and other useful products. The annual discharge of CMHR’s has the characteristics of large output and concentrated discharge. In addition, with an initial moisture content of more than 70%, Chinese medicinal residues are difficult to store and degrade, highly perishable, and unpleasant smell (Chen et al., 2017; Li et al., 2018). There is a great variety of CMHR’s. The main chemical compositions vary depending on the cellulose, hemicellulose, and lignin content of the different CMHR’s (Tripathy et al., 2015). Therefore, the heat treatment of drugs has become a research emphasis in recent reports. For example, Wang (Wang et al., 2016) used heat treatment technology to conduct experiments on CMHR's and successfully prepared bio-oil, which has the highest yields of 39%. These studies have shown that the chemical recovery of CMHR's to produce fuel is an interesting and promising option.
Biomass has been identified as an effective solution to produce renewable energy and reduce dependence on fossil fuels (Gao et al., 2020; Lee et al., 2016). Pyrolysis technology refers to the thermal decomposition of raw materials at high temperatures in an oxygen-free environment (Kim et al., 2017; Loy et al., 2018). During the process, the organic matter in the raw material undergoes thermal cracking and thermochemical conversion, which changes the original molecular structure. The products include biochar, bio oil and non-condensable gas. However, regardless of whether slow pyrolysis or rapid pyrolysis is used, the bio-oil obtained by direct pyrolysis of biomass has the disadvantages of high viscosity, strong causticity, a high water content, easy volatilization and poor stability (Rahman et al., 2018). The bio-oil also contains a large amount of highly oxygenated chemical components, thereby reducing the characteristics of bio-oil fuel.
To improve the quality and efficiency of pyrolysis products, catalysts have started to be used. During catalytic pyrolysis, the catalyst can help promote C-O bond cracking, decarboxylation and decarboxylation reactions to accelerate deoxygenation. The obtained bio-oil has fewer oxygen-containing compounds and more hydrocarbons with a higher calorific value. Therefore, the fuel quality of catalytically cracked bio-oil is superior to that of conventional pyrolysis oil.
The acidity and pore structure of the catalysts can determine the nature of the product. Furthermore, the amount of catalyst added also has a significant influence on the pyrolysis of biomass, the product distribution and the composition (Cui et al., 2020; Zhou et al., 2019b). Therefore, the selection of a suitable catalyst can not only optimize the reaction conditions but also improve the yield and quality of the bio-oil produced by pyrolysis and selectively yields chemical products with high added value. In recent years, in the study of biomass pyrolysis based on different material properties, many researchers have chosen various types of catalysts to investigate their effects on the distribution and composition of biomass pyrolysis products to improve the yield of the target products and the quality of the bio-oil(Jiang et al., 2019; Shafaghat et al., 2017; Xin et al., 2019).
Zhao (Muneer et al., 2019) investigated the effect of HZSM-5 catalyst contact mode and gas atmosphere in the catalytic conversion of corn Stalk and polystyrene using a fixed bed reactor, and it was found that mesoporous HZSM-5 catalyst applied in the in-situ and ex-situ modes led to decreased oil and increased gas yields. Munir (Munir & Usman, 2018) studied the hydropyrolysis of a model municipal waste plastic mixture using in-house composites of ultra-stable Y zeolites (USY) with mesoporous SBA-16. And the conversion and liquid yield over all the composite catalysts are found far better than the parent USY catalyst. Hence, adding catalysts in pyrolysis reactions is an important method for improving the biomass pyrolysis of bio-oil products, and catalytic pyrolysis is aimed to improve the pyrolysis oil and yield of bio-oil.
In this study, the catalytic pyrolysis performance of parent and cobalt-modified USY on GBR was evaluated using a fixed-bed reactor. The composition of the pyrolysis products was investigated by gas chromatography-mass spectrometry (GC-MS), gas chromatography (GC), and elemental analysis (EDX). Furthermore, the catalysts were characterized by specific surface area and pore size analysis, X-ray diffraction (XRD) and ammonia temperature-programmed desorption.
2.1 Materials
The GBR used in this study was obtained from SPH Xingling Technology Pharmaceutical Co., Ltd. (Shanghai, China). A common method for extracting the active ingredient in ginkgo biloba leaf is to add 7 times the amount of ethanol to ginkgo biloba leaf, extract it three times by refluxing for 2 h, combine the extracts and filter the result. The raw material was extruded to recover residual ethanol, after which an appropriate amount of water was added to the extruded raw material, and after standing for 1 h, it was filtered to obtain GBR. Then the GBR was dried in an oven at 80°C for 24 h. After cooling, the residue was pulverized to a diameter of less than 100 µm.
Proximate analyses of moisture, ash, volatiles and fixed carbon were performed according to ASTM standards E1756-08, E1755-01, E872-82 and E870-82, respectively. The ultimate analyses determine the elemental compositions of a sample. In this experiment, the C, H, N and S contents in the GBR were measured by an elemental analyzer (Elementar Vario EL III, Elementar Company, Germany), and the O content was measured by the combustion method. The GBR content in the extract was determined according to ASTM Standard E 1690. The hemicellulose, cellulose and lignin contents in the GBR were determined according to ASTM Standard E 1758-01. The structural composition plays an important role in the kinetic analysis of pyrolysis, because each compound has its own range of decomposition. Table 1 lists the results of the ultimate, proximate, and biochemical analyses.
|
Ultimate analysis |
Wt. % |
Proximate analysis |
Wt. % |
Biochemical analysis |
Wt. % |
|---|---|---|---|---|---|
|
Carbon |
53.72 |
Volatiles |
72.59 |
Cellulose |
42.4 |
|
Hydrogen |
7.74 |
Fixed carbon |
14.65 |
Hemicelluloses |
15.35 |
|
Oxygen |
33.68 |
Ash |
8.23 |
Lignin |
29.37 |
|
Nitrogen |
1.25 |
Moisture |
4.53 |
Extractives |
12.88 |
|
Sulfur |
0.36 |
- |
- |
- |
- |
2.2. Pyrolysis experiments
The sludge pyrolysis system was composed of a nitrogen control device, a pyrolysis reactor, a condensing device, a thermal gas mass flow meter, and a gas collecting bag. In the pyrolysis experiment, a 4g sample was placed in a quartz boat and placed in the unheated portion of the reactor tube. By adjusting the nitrogen control unit, nitrogen was passed to the pyrolysis system at a flow rate of 60 ml/min, and the system was always kept in an inert atmosphere. The pyrolysis reactor was heated to 600°C at a heating rate of 10°C/min. When the temperature reached the specified value, the quartz boat was quickly pushed into the reactor zone, which had a specified temperature. The pyrolysis process lasted for 30 min. During the pyrolysis process, the produced pyrolysis gases passed through a condensing unit to collect the condensed bio-oil. The non-condensable heat-dissipating gas was periodically collected using a gas collecting bag. The biochar was collected and weighed after pyrolysis when the temperature had been lowered to room temperature. After the experiment, the weight of the biochar and condensed bio-oil was obtained by direct weighing, and then the yield of the pyrolysis gas was calculated using the difference method. To ensure repeatability, three repeated tests were performed under each condition, and the average data from three experimental runs were used for analysis and discussion to eliminate experimental errors.
2.3. Pyrolysis products characterization
The bio-oil was analysed by gas chromatography-mass spectrometry (GC-MS, Agilent, 7890B-5975C). The specific chromatographic conditions were as follows: an HP-5 chromatographic column was used (30 m×0.25 mm×0.25 µm); the carrier gas was high -purity helium with a flow rate of 20 mL/min; and the GC was held at the initial temperature (50°C) for 3 min, after which the temperature was raised to 180°C at 5°C/min, increased to 300°C at 10°C/min, and finally held for 5 min. Mass spectrometry conditions: the ionization mode was EI; the electron energy was 70 eV; and the sweeping range was 20–500 amu. The mass spectra were compared with NIST14 library data, and the results were analysed by a semi-quantitative method using the relative peak area.
The gas products obtained by pyrolysis were subjected to micro gas chromatography (Micro GC 3000A, Agilent) for quantitative analysis. The gas chromatograph mainly consisted of a heat conduction detector (TCD) and a flame ionization detector (FID). The TCD was used to detect H2, CO, CO2 and CH4, and the FID was used to detect low-carbon olefins.
2.4. Catalyst preparation
In this study, the USY molecular sieve catalyst was obtained from the Catalyst Plant of Nankai University. Cobalt-modified USY catalyst was prepared by the wet impregnation method. The loading of Co was 10 wt.%. The USY catalyst was placed in a muffle furnace and roasted at 550°C for 6 h in an air atmosphere. This process removed the template and adsorbed water from the catalyst. The specific preparation method was as follows: 2.47 g of cobaltous nitrate (Co(NO3)2-6H2O, AR, Aladdinis) was weighed and dissolved in 20 ml of deionized water. It was completely dissolved using a magnetic stirrer, and then 10 g of USY catalyst was added and stirred well. The mixed liquor was continuously shaken for 5 h using a constant - temperature oscillator, and the temperature was set to 50°C. Subsequently, the material was dried at 105°C for 12 h to obtain the catalyst precursor. Finally, the catalyst precursor was placed in a muffle furnace for calcination, and the temperature was raised to 550°C at 10°C/min for 5 h. The catalyst powder obtained after cooling was ground and filtered to obtain a catalyst with a particle size of 50–212 µm for subsequent application.
2.5. Catalysts characterization
The pore structure characteristics of the catalysts were analysed using a specific surface area and pore size analyser (ASAP2460, Micromeritics, USA), and the specific surface area and pore volume of the catalysts were calculated by the Brunauer-Emmett-Teller (BET) equation and the Barrett-Joyner-Halenda (BJH) model, respectively. The desorption branch of the nitrogen sorption isotherm was plotted. The specific experimental parameters were as follows: the temperature was 77 K, the pore size ranged from 1.7 to 300 nm, and the relative pressure was from 0.01 to 0.995. The acidity of the catalyst was measured using a fully automatic temperature-programmed chemisorber (AutoChem II 2920, Micromeritics, USA). The specific test procedure was as follows: 0.1 g of sample was placed in a U-shaped quartz tube, and the temperature was raised from room temperature to 300°C in a helium atmosphere of 40 mL/min for 2 h. When the sample had cooled to 50°C, the adsorption experiment was carried out by blowing 40 mL/min of NH3 and then switching to 40 mL/min of helium sweeping for 1 h. Finally, desorption was carried out at a heating rate of 10°C/min to 600°C in a helium atmosphere. TCD was used to record signals and monitor data. The crystal phase characteristics of the catalyst were analysed by an X-ray powder diffractometer (XRD, smartlab 9kW, Rigaku, Japan). The parameters were as follows: the ray source was CuKa, the tube voltage was 40 kV, the tube current was 40 mA, the scanning range was 5–60°, the scanning speed was 5°/min, and the sampling width was 0.02°.
3.1. Catalysts characterization
Table 2 shows the N2 adsorption & desorption isotherms of parent and cobalt-modified USY and highlights the textural properties, respectively. Both of catalysts showed typical IV isotherms with hysteresis loops, indicating the existence of mesoporous (Zheng et al., 2019). In the low-pressure range, the adsorption amount increased approximately linearly with pressure because the nitrogen molecules underwent single-layer adsorption on the inner surface of mesopores. When the relative pressure was in the medium- pressure region, the adsorption amount jumped due to the capillary condensation of nitrogen molecules in mesopores. When the pressure continued to increase, multiple layers of adsorption occurred. As can be seen from Table 1, the specific surface areas of parent and cobalt-modified USY were 787.97 and 750.61 m2/g, respectively, and the pore volumes were 0.37 and 0.34 cm3/g, respectively. Compared to the parent USY, the cobalt-modified USY had a reduced specific surface area, pore volume, and pore diameter. This reduction was because Co ions were distributed on the surface and in the pores of the catalyst, covering part of the surface of the carrier pores; thus, the specific surface area was reduced. The Co covering the pores of the carrier blocked a portion of the pores, which narrowed the pores so that the average pore volume and average pore diameter of the molecular sieve were lowered (Gamliel et al., 2016; Lee et al., 2017). Moreover, Co ions covered the outer surface of the catalyst, expanding the external specific surface area of the molecular sieve carrier. The number of weak acid sites in the modified USY increased and shifted to a high temperature zone. The strong acid desorption peak disappeared, indicating that the modified catalyst had mild acidity and that the overall amount of acid was lowered. Cobalt ions were highly dispersed and oligomerized in the pores or on the outer surface of the USY molecular sieve. This support was a critical factor in increasing the catalytic activity of the catalyst.
|
Catalyst |
SBET (m2/g) |
Sext (m2/g) |
Smicro (m2/g) |
Vtotal (cm3/g) |
Vext (cm3/g) |
Vmicro (cm3/g) |
Dave (nm) |
|---|---|---|---|---|---|---|---|
|
USY |
787.97 |
53.55 |
734.42 |
0.37 |
0.11 |
0.26 |
1.88 |
|
Co-USY |
750.61 |
67.83 |
682.78 |
0.34 |
0.08 |
0.26 |
1.83 |
| SBET: Total pore area; Sext: External surface area; Smicro: Micropore surface area; Vtotal: Total pore volume; Vext: External pore volume; Vmicro: Micropore volume; Dave: Average pore size | |||||||
Fig. 1 and Table 3 show the NH3-TPD curve and acid site properties of the parent and cobalt-modified USY. The presence of certain solid acid sites in the molecular sieve was of great significance for the catalysis of organic matter. USY had two desorption peaks at temperatures of 132°C and 343°C. Compared with USY, the weak acid desorption peak in the modified USY was significantly enhanced, indicating that the number of weak acid sites in the modified USY increased and shifted to a high temperature zone, moving from 132°C to 153°C, which meant that the acidity of weak acids was also enhanced. The strong acid desorption peak disappeared, indicating that the modified catalyst had mild acidity and that the overall amount of acid was lowered. This decrease occurred because Co caused a slight dealumination of the backbone of the catalyst during the impregnation process, promoting a decrease in the acidity of strong acid sites (Zhao et al., 2019). The addition of cobalt reduced the number of acid sites in USY, and the effect on the strong acid sites was greater than that on the weak acid sites. This effect was the result of the interaction of cobalt with Al (OH) Si, and some Al-OH was replaced by Co-OH (Che et al., 2019; Zhang et al., 2007); thus, the number of strongly acidic sites was significantly reduced.
|
Catalyst |
Weak acid site (mmol/g) |
Strong acid site (mmol/g) |
Total acid site (mmol/g) |
|---|---|---|---|
|
USY |
1.118 |
0.533 |
1.651 |
|
Co-USY |
1.518 |
- |
1.518 |
X-ray diffraction (XRD) was used to study the patterns of the parent and cobalt-modified USY. The USY molecular sieve had distinct characteristic diffraction peaks at 2θ = 10.18, 11.94, 15.72, 18.78, 20.46, 23.76, 27.18, and 31.56. The characteristic diffraction peaks of the cobalt-modified USY catalyst did not change significantly in position, which indicated that the loading of Co did not destroy the phase structure of the USY catalyst (Li et al., 2016; Zhang et al., 2018). From the results of catalyst activity and X-ray diffraction, the intensity of the characteristic diffraction peaks was significantly weakened, but the characteristic diffraction peak of cobalt ions did not appear, which indicated that the cobalt ions were highly dispersed and oligomerized in the pores or on the outer surface of the USY molecular sieve (Zhao et al., 2019; Zhang et al., 2018).
3.2. Products yields
Products distribution over without or with the parent and cobalt-modified USY during GBR pyrolysis are shown in Fig.2.The results showed that the yields of the bio-oil, gas products and biochar obtained by pyrolysis without using a catalyst were 36.27%, 28.88%, and 34.85%, respectively. In contrast, catalysts caused a significant change in the distribution of pyrolysis products. The yield of gaseous products in the products obtained by catalytic pyrolysis using the parent and cobalt-modified USY catalysts increased by 8.5% and 11.65%, respectively; the yield of bio-oil decreased by 6.26% and 9.05%, respectively; and catalytic pyrolysis did not have a significant effect on the yield of biochar. These changes were mainly due to the large pore size and specific surface area of the catalyst.These enhanced parameters increase the residence time of the pyrolysis gas in the pyrolysis furnace, increase the mass transfer and heat transfer effects, and affect the heating rate and precipitation rate of volatile materials (Zhou et al., 2019a). At the same time, macromolecules in the pyrolysis gas can enter the pores of the catalyst and undergo cracking to form small molecular substances.Acids can be converted to hydrocarbon compounds by a decarboxylation reaction with the aid of a catalyst. Oxygenates can be converted into small molecules, such as CO2, CO and H2O, which reduce the molecular size of the bio-oil and make the bio-oil more stable (Skoblik et al., 2012). As a result, the amount of gaseous product in the catalytic pyrolysis product increases, and the corresponding amount of bio-oil decreases.
3.3. Gas compositions
Figure 3 shows the composition of the gaseous product of GBR pyrolysis under different pyrolysis conditions. Under the action of catalysts, the yield of CO, CH4 and CO2 in the gas product increased significantly. The yield of H2 was lowered. The yield of C2 − 4 was slightly increased. During the pyrolysis process, large amounts of hydroxyl groups in GBR underwent dehydration, which provided conditions for the formation of carbonyl groups. Then, the unstable carbonyl groups were broken at a higher temperature to form CO by reforming and isomerization reactions. Less CO was formed in the initial stage of pyrolysis, while a large amount of CO was generated by the secondary cracking of primary products(Ren et al., 2018). The carboxyl groups formed by the isomerization of ketene and olefin aldehydes were further decomposed to obtain CO2. Under the action of catalysts, the yields of CO and CO2 increased to different degrees, and the yield of CO2 was higher than that of CO, which also proved that the increased secondary reactions had a more obvious effect on the increase in CO2 production (Liu et al., 2017). Compared with USY, USY modified with cobalt not only contained the acid active sites of the parent but also added the active sites of some cobalt ions. This active site distribution facilitated the intermediate release and disconnection reactions of large molecules, as well as the condensation reactions of ketones, aldehydes, etc., thereby increasing the deoxidation effect in the form of CO and CO2 gases. CH4 was mainly derived from the cleavage and reforming of functional groups such as methyl and methylene, while C2 − 4 was mainly derived from the secondary cleavage of volatiles. Therefore, USY modified with cobalt had a certain promoting effect on these reactions, so the yields of CH4 and C2 − 4 increased.
3.4. The selectivity of catalyst to aromatics
Gaining knowledge toward the quantitative chemical characterization of bio-oils is crucial in the evaluation of its applications as an extended resource of advantageous bio-fuels and bio-chemicals (Hassan et al., 2016; Pirbazari et al., 2019). To determine the chemical compositions of the catalytic and non-catalytic bio-oils, GC-MS analysis was carried out as appropriate. The results of the GC-MS analysis are summarized in Table 4. Due to the complex structure of biomass and the various reactions that may occur during thermochemical processes, the composition of bio-oil obtained from the pyrolysis of GBR is complex. To figure out the selectivity of the products, they have divided into acids, ketones, esters, alcohols, furans, aldehydes, phenols and aromatics, based on their main organic functional groups (Lazaridis et al., 2018).
|
Types |
Library/ID |
Peak area percentage (%) |
||
|
Non- Cat. |
USY |
Co-USY |
||
|
Acids |
Acetic acid |
5.01 |
2.15 |
0.98 |
|
Propanoic acid |
3.15 |
2.16 |
0.27 |
|
|
Octadecanoic acid |
- |
- |
0.37 |
|
|
Tetradecanoic acid |
1.21 |
0.48 |
- |
|
|
7,8,12-Tri-O-acetyl ingol |
1.89 |
0.81 |
0.51 |
|
|
Oleic Acid |
- |
0.71 |
- |
|
|
Ketonesz |
1-Hydroxy-2-propanone |
1.57 |
0.76 |
- |
|
1-Hydroxy-2-butanone |
0.82 |
- |
- |
|
|
2-Methyl-2-cyclopenten-1-one |
0.53 |
0.28 |
0.11 |
|
|
1,2-Cyclopentanedione |
2.43 |
2.17 |
2.05 |
|
|
2-Hydroxy-2-cyclopentanon |
2.68 |
1.27 |
1.04 |
|
|
1-Indanone |
1.24 |
- |
- |
|
|
Esters |
Propanoic acid, 2-oxo-,methyl ester |
0.68 |
- |
- |
|
Pentanoic acid, 1-methylpropyl ester |
1.22 |
0.87 |
- |
|
|
D-Glucuronicacid. gamma.-lactone |
5.79 |
1.94 |
2.19 |
|
|
Oleic acid, eicosyl ester |
0.26 |
- |
- |
|
|
Propanoic acid, 2-oxo-, methyl ester |
0.48 |
- |
- |
|
|
Valtrate |
0.15 |
- |
- |
|
|
Alcohols |
2-Propanone, 1-hydroxy- |
- |
1.39 |
1.2 |
|
Methylazoxy methanol acetate |
- |
1.48 |
0.55 |
|
|
Maltol |
- |
1.32 |
||
|
Furans |
2,3-Dihydrofuran |
1.19 |
0.64 |
0.75 |
|
5-Hydroxymethylfurfural |
1.04 |
0.52 |
1.26 |
|
|
2-Methyl-furan |
2.41 |
1.07 |
1.86 |
|
|
Aldehydes |
Cyclooctanecarboxaldehyde |
- |
2.22 |
4.33 |
|
Furfural |
2.52 |
- |
- |
|
|
Pentanal |
1.33 |
0.77 |
0.23 |
|
|
2-Methyl-valeraldehyde |
3.53 |
1.87 |
0.19 |
|
|
Phenols |
Phenol |
4.29 |
3.36 |
3.31 |
|
Phenol, 2-methyl- |
2.93 |
- |
- |
|
|
Phenol, 3-methyl- |
3.94 |
|||
|
Phenol, 4-methyl- |
5.25 |
4.57 |
3.85 |
|
|
Phenol, 2-methoxy- |
2.78 |
|||
|
Phenol, 4-ethyl- |
0.73 |
|||
|
1,2-Benzenediol |
11.69 |
11.15 |
9.34 |
|
|
Hydroquinone |
- |
- |
||
|
1,4-Benzenediol |
5.97 |
4.12 |
5.37 |
|
|
Phenol, 3,5-dimethoxy- |
- |
0.16 |
- |
|
|
Aromatics |
Benzene |
- |
1.81 |
- |
|
Toluene |
1.26 |
6.13 |
7.55 |
|
|
p-Xylene |
2.32 |
4.92 |
6.37 |
|
|
Indene |
- |
- |
0.63 |
|
|
Naphthalene |
- |
5.64 |
3.19 |
|
|
1-Methyl-naphthalene |
- |
3.04 |
2.25 |
|
|
2,7-Dimethyl-naphthalene |
- |
2.09 |
- |
|
|
Anthracene |
- |
0.75 |
0.96 |
|
|
2-Methyl-anthracene |
- |
1.46 |
0.94 |
|
|
2-Methyl-phenanthrene |
- |
1.65 |
- |
|
As shown in Fig. 4, the acids in the catalytic pyrolysis products of USY modified with Co were significantly reduced compared with the pyrolysis products of USY. This result indicated that Co facilitated the removal of acid species during pyrolysis. However, under the action of co-modified USY, the content of aldehydes and sugars in the pyrolysis products changed little, while the content of alcohols increased slightly, indicating that the modified catalyst could reduce the viscosity of the bio-oil. The levels of esters and ketones were slowly reduced to 2.19% and 3.2%, respectively. Compared with pyrolysis without a catalyst, the content of phenols in the bio-oil obtained by pyrolysis under catalysis with the parent and cobalt-modified USY catalysts was reduced by 4.72% and 5.05%, respectively, indicating that the stability of the bio-oil had been improved. Under the USY catalysis of the parent, the aromatic hydrocarbon content was 27.49%.eventually the aromatic hydrocarbon content was reaching to 21.89% under the catalysis of Co-USY. Co loading was unfavourable for increasing the content of aromatic hydrocarbons in the bio-oil. The content of aromatic hydrocarbons in the bio-oil obtained by pyrolysis under catalysis by the parent and cobalt-modified USY was 27.49% and 21.89%, respectively, indicating that the use of the modified catalyst hindered the formation of aromatic hydrocarbons.
Compared with the pyrolysis products of USY, the content of acetic acid remained basically unchanged under cobalt-modified USY catalysis, and the content of propanoic acid decreased slightly. The content of 2-methyl-furan and 5-hydroxymethylfurfural increased; however, the content of 2, 3-dihydrofuran was not affected by the modification of the catalyst. The contents of 2-methyl-2-cyclopenten-1-one and 2-hydroxy-2-cyclopentanone slightly decreased, which was consistent with the trend of the total content of ketones. The pentanal and 2-methyl-valeraldehyde quantities were also reduced by similar amounts. It could be speculated that the increased content of aldehydes in the bio-oil may come from the conversion of furfural.
The study found that Co-modified USY had no promoting effect on increasing the total content of aromatic hydrocarbons. Therefore, it was necessary to study the effect of this catalyst on the relative content and selectivity of four typical aromatic hydrocarbons. From Fig. 5(a), it was found that the contents of toluene and xylene increased, whereas the contents of naphthalene and 1-methylnaphthalene slightly decreased, which indicated that Co ions were not conducive to the formation of aromatic hydrocarbons; Co ions hindered the addition or polymerization of benzene rings, thereby reducing the formation of naphthalene and its derivatives (Chen et al., 2019a). Conversely, Co ions could promote the formation of monocyclic or small-molecular-chain hydrocarbons. The calculation of product selectivity is shown in Eq. (1).
 (1)
(1)Figure 5(b) shows that the selectivity and content of the four aromatic hydrocarbons are almost identical. The selectivity of toluene and xylene increased, and the selectivity of naphthalene and 1-methylnaphthalene was gradually reduced. The composition of aromatic hydrocarbons was simplified under the action of Co-modified USY. The selectivity ratios of toluene and xylene were 34.35% and 28.96%, respectively, which were much higher than those of the other two aromatic hydrocarbons.
Herein, the pyrolysis of GBR was carried out at 600°C in a fixed-bed tubular reactor. Under the action of catalysts, the content of bio-oil in the pyrolysis product decreased slightly, and the gas product yield and the conversion rate of the raw material significantly increased. The yield of CO, CH4 and CO2 in the gas product increased significantly. The yield of H2 was lowered. The yield of C2 − 4 was slightly increased. The selectivity of naphthalene and 1-methylnaphthalene was gradually reduced. The composition of aromatic hydrocarbons was simplified, while the content and selectivity ratio of toluene and xylene were increased.
Data availability statement
My manuscript has no associated data.
Acknowledgements
The authors wish to acknowledge the financial support from SPH Xing Ling Sci. & Tech . Pharmaceutical Co., Ltd. China.
- Che, Q., Yang, M., Wang, X., Yang, Q., Chen, Y., Chen, X., Chen, W., Hu, J., Zeng, K., Yang, H., Chen, H.: Preparation of mesoporous ZSM-5 catalysts using green templates and their performance in biomass catalytic pyrolysis. Biores. Technol. 289, 121729 (2019)
- Chen, S.J., Zhang, J.S., Zhang, H.W., Wang, X.K.: 2017. Removal of Hexavalent Chromium from Contaminated Water by Chinese Herb-Extraction Residues. Water Air and Soil Pollution, 228(4)
- Chen, X., Chen, Y., Yang, H., Wang, X., Che, Q., Chen, W., Chen, H.: Catalytic fast pyrolysis of biomass: Selective deoxygenation to balance the quality and yield of bio-oil. Biores. Technol. 273, 153–158 (2019a)
- Cui, X., Wang, J., Cao, J.-P., Zhao, P.-T., Wang, Y.-X., Yan, H., Huang, N.: Effect of A-site disubstituted of lanthanide perovskite on catalytic activity and reaction kinetics analysis of coal combustion. Fuel 260, 116380 (2020)
- Gamliel, D.P., Cho, H.J., Fan, W., Valla, J.A.: On the effectiveness of tailored mesoporous MFI zeolites for biomass catalytic fast pyrolysis. Appl. Catal. A 522, 109–119 (2016)
- Gao, P., Guo, D.Z., Liang, C., Liu, G.Y., Yang, S.X.: 2020. Nitrogen conversion during the rapid pyrolysis of raw/torrefied wheat straw. Fuel, 259
- Hassan, H., Lim, J.K., Hameed, B.H.: Recent progress on biomass co-pyrolysis conversion into high-quality bio-oil. Biores. Technol. 221, 645–655 (2016)
- Jiang, D., Xia, Z., Wang, S., Li, H., Gong, X., Yuan, C., El-Fatah Abomohra, A., Cao, B., Hu, X., He, Z., Wang, Q.: Mechanism research on catalytic pyrolysis of sulfated polysaccharide using ZSM-5 catalysts by Py-GC/MS and density functional theory studies. J. Anal. Appl. Pyrol. 143, 104680 (2019)
- Kim, Y.-M., Jae, J., Kim, B.-S., Hong, Y., Jung, S.-C., Park, Y.-K.: Catalytic co-pyrolysis of torrefied yellow poplar and high-density polyethylene using microporous HZSM-5 and mesoporous Al-MCM-41 catalysts. Energy Convers. Manag. 149, 966–973 (2017)
- Lazaridis, P.A., Fotopoulos, A.P., Karakoulia, S.A., Triantafyllidis, K.S.: 2018. Catalytic Fast Pyrolysis of Kraft Lignin with Conventional, Mesoporous and Nanosized ZSM-5 Zeolite for the Production of Alkyl-Phenols and Aromatics. Frontiers in Chemistry, 6
- Lee, H.W., Kim, Y.-M., Jae, J., Jeon, J.-K., Jung, S.-C., Kim, S.C., Park, Y.-K.: Production of aromatic hydrocarbons via catalytic co-pyrolysis of torrefied cellulose and polypropylene. Energy Convers. Manag. 129, 81–88 (2016)
- Lee, K., Lee, S., Jun, Y., Choi, M.: Cooperative effects of zeolite mesoporosity and defect sites on the amount and location of coke formation and its consequence in deactivation. J. Catal. 347, 222–230 (2017)
- Li, P., Li, D., Yang, H., Wang, X., Chen, H.: Effects of Fe-, Zr-, and Co-Modified Zeolites and Pretreatments on Catalytic Upgrading of Biomass Fast Pyrolysis Vapors. Energy Fuels 30(4), 3004–3013 (2016)
- Li, T., Guo, F., Li, X., Liu, Y., Peng, K., Jiang, X., Guo, C.: Characterization of herb residue and high ash-containing paper sludge blends from fixed bed pyrolysis. Waste Manag 76, 544–554 (2018)
- Liu, T.-L., Cao, J.-P., Zhao, X.-Y., Wang, J.-X., Ren, X.-Y., Fan, X., Zhao, Y.-P., Wei, X.-Y.: In situ upgrading of Shengli lignite pyrolysis vapors over metal-loaded HZSM-5 catalyst. Fuel Process. Technol. 160, 19–26 (2017)
- Loy, A.C.M., Gan, D.K.W., Yusup, S., Chin, B.L.F., Lam, M.K., Shahbaz, M., Unrean, P., Acda, M.N., Rianawati, E.: Thermogravimetric kinetic modelling of in-situ catalytic pyrolytic conversion of rice husk to bioenergy using rice hull ash catalyst. Bioresour. Technol. 261, 213–222 (2018)
- Muneer, B., Zeeshan, M., Qaisar, S., Razzaq, M., Iftikhar, H.: 2019. Influence of in-situ and ex-situ HZSM-5 catalyst on co-pyrolysis of corn stalk and polystyrene with a focus on liquid yield and quality. Journal of Cleaner Production, 237
- Munir, D., Usman, M.R.: Catalytic hydropyrolysis of a model municipal waste plastic mixture over composite USY/SBA-16 catalysts. J. Anal. Appl. Pyrol. 135, 44–53 (2018)
- Pirbazari, S.M., Norouzi, O., Kohansal, K., Tavasoli, A.: Experimental studies on high-quality bio-oil production via pyrolysis of Azolla by the use of a three metallic/modified pyrochar catalyst. Bioresour. Technol. 291, 121802 (2019)
- Rahman, M.M., Liu, R., Cai, J.: Catalytic fast pyrolysis of biomass over zeolites for high quality bio-oil – A review. Fuel Process. Technol. 180, 32–46 (2018)
- Ren, X.-Y., Cao, J.-P., Zhao, X.-Y., Shen, W.-Z., Wei, X.-Y.: Increasing light aromatic products during upgrading of lignite pyrolysis vapor over Co-modified HZSM-5. J. Anal. Appl. Pyrol. 130, 190–197 (2018)
- Shafaghat, H., Rezaei, P.S., Ro, D., Jae, J., Kim, B.-S., Jung, S.-C., Sung, B.H., Park, Y.-K.: In-situ catalytic pyrolysis of lignin in a bench-scale fixed bed pyrolyzer. J. Ind. Eng. Chem. 54, 447–453 (2017)
- Skoblik, A.P., Shanina, B.D., Kolesnik, V.N., Konchits, A.A., Gavriljuk, V.G.: A modeling for effect of iron compounds on methane formation in the coal. Fuel 98, 124–130 (2012)
- Tripathy, V., Basak, B.B., Varghese, T.S., Saha, A.: Residues and contaminants in medicinal herbs-A review. Phytochem. Lett. 14, 67–78 (2015)
- Wang, X., Deng, S., Tan, H., Adeosun, A., Vujanović, M., Yang, F., Duić, N.: Synergetic effect of sewage sludge and biomass co-pyrolysis: A combined study in thermogravimetric analyzer and a fixed bed reactor. Energy Convers. Manag. 118, 399–405 (2016)
- Xin, X., Pang, S., de Miguel Mercader, F., Torr, K.M.: The effect of biomass pretreatment on catalytic pyrolysis products of pine wood by Py-GC/MS and principal component analysis. J. Anal. Appl. Pyrol. 138, 145–153 (2019)
- Yu, Z.W., Gao, Q., Zhang, Y., Wang, D.D., Nyalala, I., Chen, K.J.: Production of Activated Carbon from Sludge and Herb Residue of Traditional Chinese Medicine Industry and Its Application for Methylene Blue Removal. Bioresources 14(1), 1333–1346 (2019)
- Zhang, S., Zhang, H., Liu, X., Zhu, S., Hu, L., Zhang, Q.: Upgrading of bio-oil from catalytic pyrolysis of pretreated rice husk over Fe-modified ZSM-5 zeolite catalyst. Fuel Process. Technol. 175, 17–25 (2018)
- Zhang, Y., Zhou, Y., YianLi, Wang, Y., Xu, Y., Wu, P.: Effect of calcination temperature on catalytic properties of PtSnNa/ZSM-5 catalyst for propane dehydrogenation. Catal. Commun. 8(7), 1009–1016 (2007)
- Zhao, J.-P., Cao, J.-P., Wei, F., Zhao, X.-Y., Feng, X.-B., Huang, X., Zhao, M., Wei, X.-Y.: 2019. Sulfation-acidified HZSM-5 catalyst for in-situ catalytic conversion of lignite pyrolysis volatiles to light aromatics. Fuel, 255
- Zheng, Y., Tao, L., Huang, Y., Liu, C., Wang, Z., Zheng, Z.: Improving aromatic hydrocarbon content from catalytic pyrolysis upgrading of biomass on a CaO/HZSM-5 dual-catalyst. J. Anal. Appl. Pyrol. 140, 355–366 (2019)
- Zhou, J., Wu, L., Zhou, J., Liang, K., Song, Y., Tian, Y., Zhang, Q., Lan, X.: 2019a. Products optimization by FeS2 catalyst for low-rank coal microwave pyrolysis. Fuel, 255
- Zhou, Z., Chen, X., Wang, Y., Liu, C., Ma, H., Zhou, C., Qi, F., Yang, J.: Online photoionization mass spectrometric evaluation of catalytic co-pyrolysis of cellulose and polyethylene over HZSM-5. Biores. Technol. 275, 130–137 (2019b)