The overall Mutation characteristics
The somatic single nucleotide mutation frequencies of C>A, C>G, C>T, T>A, T>C and T>G appear very similar among the three age groups (Young: <=40, Medium: 40-70 and Elder: >=70) (Figure 1A) and among patients with/without tumor metastasis (Figure 1B). These results suggested that the proposed etiologies are similar among the groups and hence some external factors are unlikely to contribute to EOGC risks or metastasis risks. Patients with tumor metastasis were significantly younger than those without metastasis (average 48 vs. 59 years old, respectively, Figure 1C). The observed somatic mutation frequency for TP53, PTEN, PIK3CA were 37%, 15% and 12% respectively and other genes CTNNA1, CTNNB1, ARID1A, CDH1 and RhoA (Figure 1D). According to the somatic mutation patterns, the samples could be clustered into three groups (Figure 2A). In cluster 1, the patients have higher numbers of somatic mutations and the diagnosis ages are the highest (Figure 2B). In contrast, in cluster 2 and 3, the patients have lower numbers of somatic mutations and diagnosis ages, but the percentage of peritoneal implantation and mixture type of Laurence classification and are much higher (Figure 2C). The observations suggest that different mutation characteristics are associated with diverse clinical features.
Germline variations
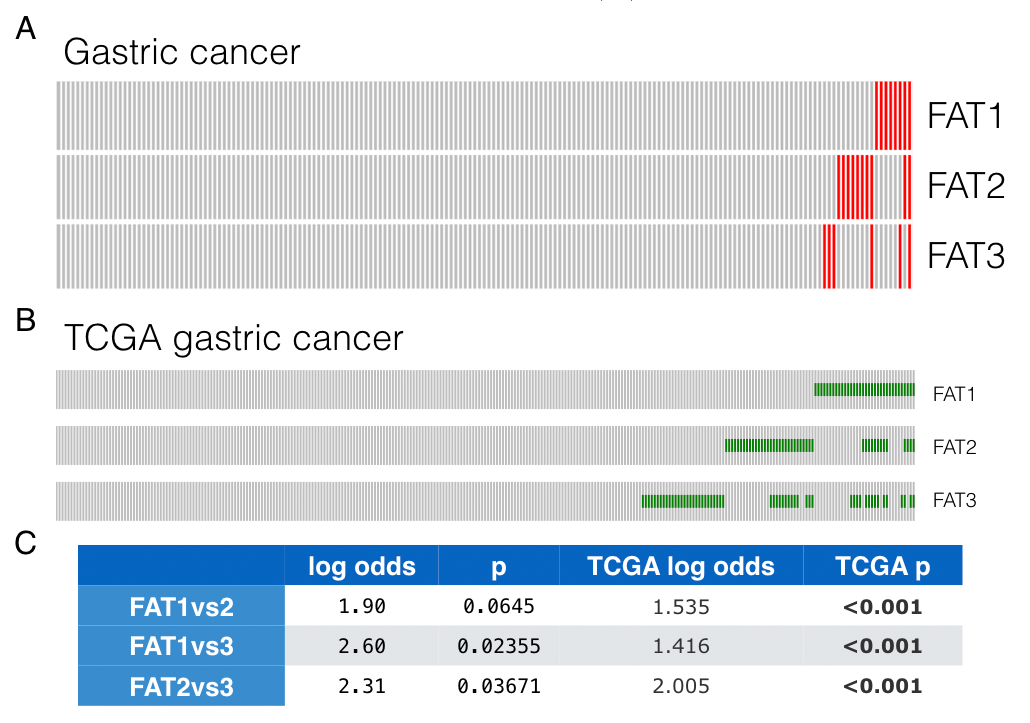
Germline variations were compared between early and late-onset GCs. SNPs at loci rs3733415, rs2304024, rs80293525, rs150453320, located in the coding regions of FAT1, FAT2, FAT3, and FAT3 respectively. In younger patients, both allele frequencies and proportions of patients carrying such SNPs are higher than those in the older groups (Figure 3A,B). Interestingly, number of cooccurrence of the 4 SNPs inversely correlated to the age of GC diagnosis (correlation=-0.5, p=0.0001). For patients carried none, one, two, three of the 4 SNPs, the mean ages of diagnosis are 60, 50, 40 and 35 respectively ( figure 3C). Therefore, the FAT deleterious SNPs additively contributed to cancer risks.
Since the “concurrent deleteriousness” to FAT proteins implicated higher cancer risks, we then asked whether such concurrent effects could be inferred by somatic mutations. To answer this question and further confirm the influence of FAT deleterious variants, somatic mutation profiles of FAT were specially analyzed. As expected, FAT genes were frequently and concurrently mutated in GCs (figure S2). Moreover, the co-occurrence trend was reproducible in TCGA STAD dataset. Hence, it could be inferred that FAT1-3 probably worked as tumor suppressors rather than passengers in GC and the co-occurrence of deleterious both germline and somatic variants in FAT1-3 may synergistically contribute to oncogenesis.
In addition, another SNPs in ALDH is negatively correlated with diagnosis ages. the relations between ALDH SNPs and esophageal cancer has already been observed from other genomic studies and our data indicated ALDH2 SNPs were also associated with early carcinogenesis (Figure 3D). On the other hand, BCLAF1 appears to be an oncogene since BCLAF1 SNPs were associated with cancer diagnosis at older age (Figure 3D).
Somatic mutation associated with earlier onset of GC
On the basis of germline analysis, some germline SNPs in FAT genes are correlated with earlier age of cancer onset. These SNPs probably damage FAT genes’ functions and then cause WNT pathway aberration. Next, to identify whether there exist somatic mutations triggering tumorigenesis at early ages, the characteristics of somatic mutation profiles in younger, medium, and older groups were further explored. As expected, the mutation counts of the patients are positively correlated with diagnosis ages (Figure 4A). The higher the age is, the fewer counts the patient has. The correlations reveal an accumulation of somatic mutations in the transformation of a normal cell into a tumor cell (Figure 4B).
Linear regression was then conducted to identify the relevance between diagnosis ages and mutations of individual genes. To identify the key drivers in the biological network among the top candidates related to younger GC, we queried STRING protein-protein interactions (PPI) database for core genes and involved biological connections. According to the PPI analysis, top 20 genes showed enriched pairwise protein-protein interactions (Figure 4C, enrichment significance, p=0.00731). Such significant interactions indicated tight cooperative or regulatory relationships with each other instead of random or isolated relationship among the top candidates. Other over-represented pathways are related to invasion and metastasis, such as cell adhesion (fdr= 0.00471), catenin complex (fdr= 0.0207) and plasma membrane part (fdr=0.0454) (Figure 4D). Of note, CTNNB1 was the top-ranked protein frequently mutated in younger group. In addition, it was also the hub of the PPI network, which suggested a dominate role in this network. There were four patients harboring CTNNB1 mutations in our data. The average diagnosis age is around 34.5 years old (from 25 to 41, whole cohort average is 52.6 years old).
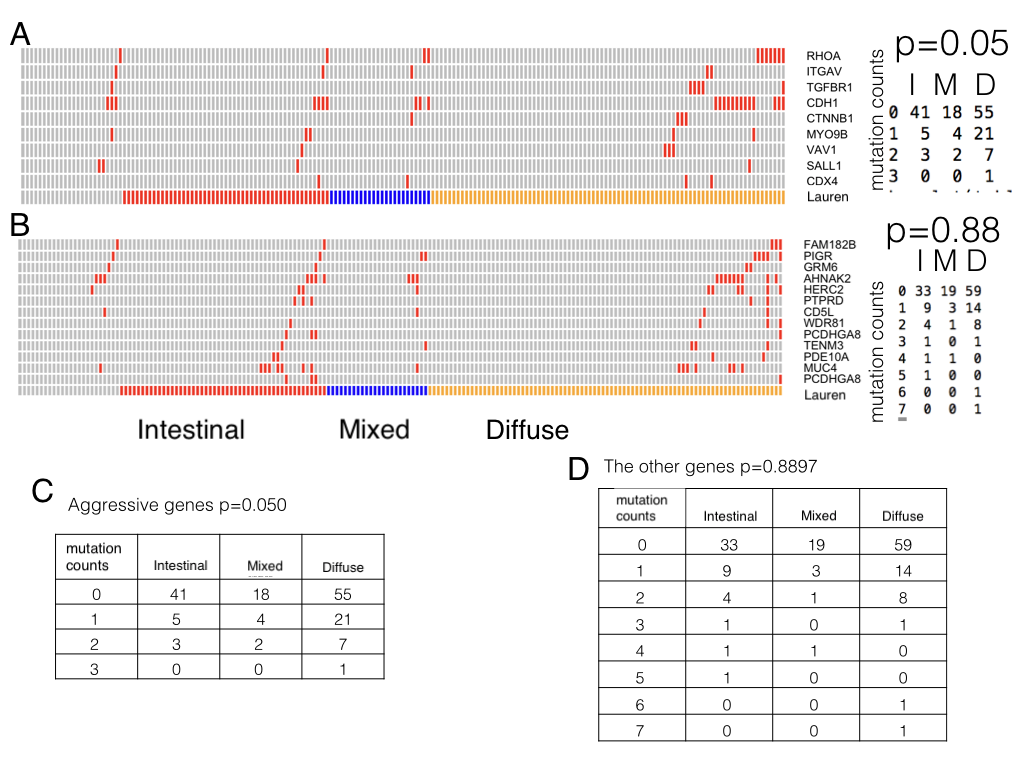
In addition such aggressive genes are associated with diffuse type but the association doesn’t exist in the other genes (Figure S3).Taken together, the risks of carcinogenesis at younger ages were linked to aberration of some aggressive pathways that accelerate cancer progression and metastasis through both inherited (germline SNPs) and postnatal ways (somatic mutations).
Somatic mutations associated with metastasis
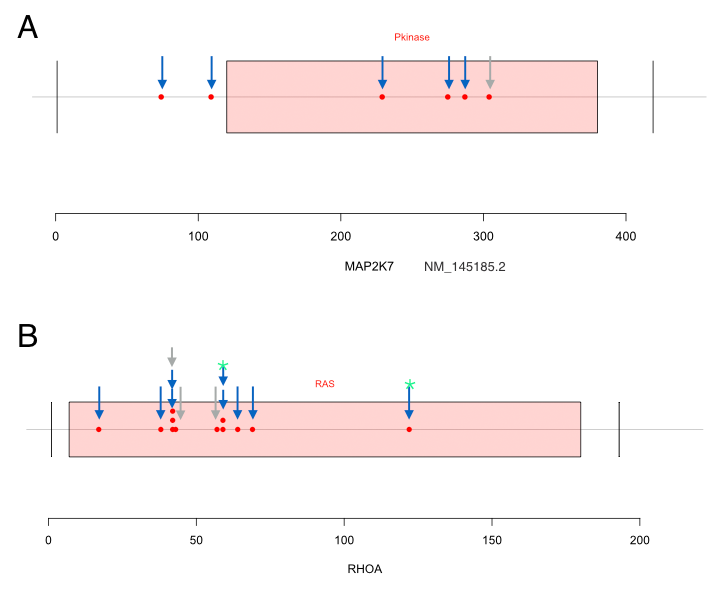
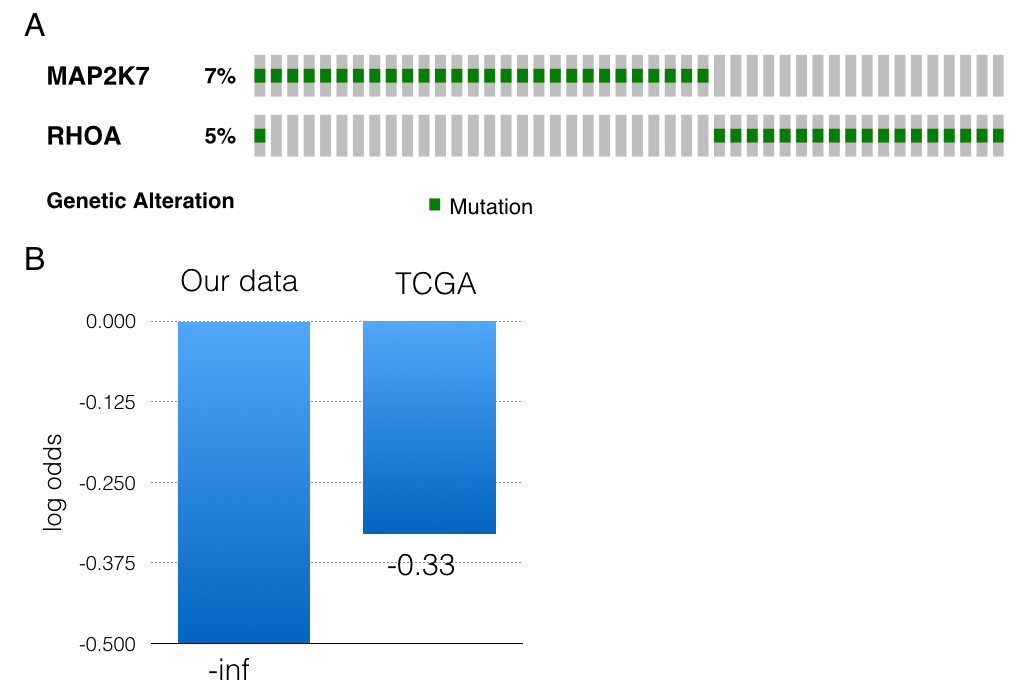
Driver alterations involved in aggressive pathways were identified to correlate with early-onset of tumorigenesis. However, driver mutations responsible for GC progression and metastases need further investigating. The patients with peritoneal implants were assigned to the metastasis group. Gene mutation features specific to metastatic tumors were then explored. Top 40 genes whose mutations are enriched in metastasis group were illustrated by STRING protein interaction network (Figure 5A). Individual genes without any interactions with other candidates were eliminated from the figures. MAP2K7 mutations were observed in six cases and five have metastatic cancers. Among the six mutations, 4 of them were locating within the kinase domain of MAP2K7 proteins. Similarly, we identified 12 RhoA mutations in 11 cases and these were over-represented in metastasis groups (Figure 5C). RhoA mutations occurred in three (3/74, 4.05%) versus eight patients (8/99, 8.08%) in non-metastasis and metastasis groups respectively (odds ratio= 2.072, p=0.2). The most common mutants, Y42C, L57V, G17E and D59G were seen in two, one, one and two cases, respectively. A notable and unreported mutant Y42H, lying in the effector-binding region of RhoA, was discovered in one metastatic case. Other mutations in RhoA were closed to such hotspot sites (Figure S4). In addition, RhoA and CDH1 somatic mutations had a tendency towards Co-occurrence (log odds= 1.93, p=0.006), especially in metastasis group (log odds=2.1 p=0.013). The Co-occurrence in TCGA dataset was highly reproducible16 (log odds =1.90, p=0.002, Figure 5B). Besides, mutations of RhoA and MAP2K7 also showed a slight tendency towards mutual exclusive both in our GC data and TCGA datasets (log odds= -inf and -0.33, respectively, Figure S4).
A proposed model
Our analysis on SNPs has demonstrated that some germlines SNPs in aggressive pathways associated with WNT signaling are remarkably correlated with EOGC, which is corresponding to our findings on somatic mutations. Indeed, Emergency Medical Technicians(EMT) genes and RhoA pathway can cooperatively induce cancer aggressiveness and metastasis through crosstalk with WNT signaling. According to our results and TCGA molecular classifications9, we, therefore, raised the hypothesis that EOGCs are caused by the aberration of highly aggressive tumors with metastatic preference (especially WNT over-activation) which progresses rapidly instead of keeping latent for years. The schematic illustration of GC development we proposed (Figure 6) may explain the heterogeneity in age at onset: 1) cancer mutations usually initiate at young ages. 2) If mutations occur and locate in some aggressive markers related to WNT pathways, they will drive the tumors more aggressive and progress rapidly. Carcinogenesis process of this type is explicit and doesn’t last long, which matches to genomically stable(GS) group in TCGA9. 3) If mutations only located in TP53 loci, they will cause the genomics instability and accelerate alteration accumulation to reach the advanced level during the carcinogenesis process9, 17, which matches to Chromosomal instability (CIN) group in TCGA. 4) Otherwise, mutations only prefer to occur in microsatellite/simple repeat regions or vulnerable regions without dramatically stimulating or promoting. This process requires longer time and thus diagnosis ages of this Microsatellite instability(MSI) group are oldest in TCGA cohorts9. EBV groups could not be characterized in detail due to data limitation.
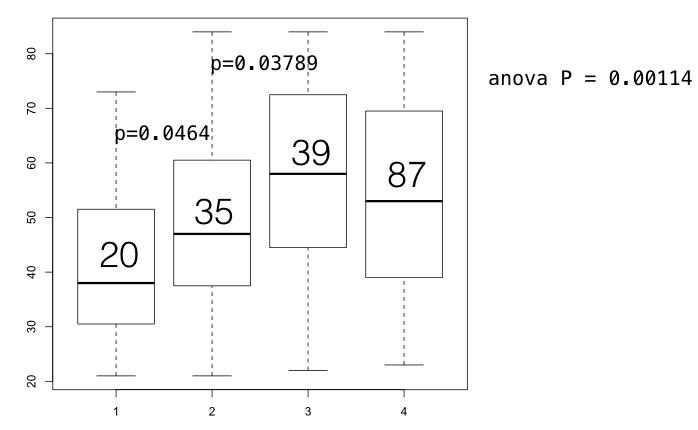
To validate this hypothesis, we divided the patients into several groups: 1) patients with TP53 mutations and aggressive mutations (patients carrying RhoA, ITGAV, TGFBR1, CDH1, CTNNB1, MYO9B, VAV1, SALL1, CDX4 somatic mutations or simultaneously carrying three FAT germline SNPs), 2) only aggressive mutations without TP53 mutations; 3) TP53 mutations alone without aggressive mutations 4) The rest (Figure S6). There were marked differences between these three groups. As the boxplots shown, aggressive markers are the primary factors affect diagnosis age. Patients carrying aggressive mutations (group 1 & group 2) have been diagnosed at younger age than those have only TP53 mutations. The average ages of group 1 and group 2 are 38.9 and 47.4 while average ages of group 3 are 57.9 (group 2 vs group 3, p= 0.03789; group 1 vs group 3, p= 0.0001159, figure S6). Furthermore, the coordination between TP53 mutations and aggressive mutations make the diagnosis ages nearly 9 years earlier than group 2 (group 1 vs group 2, p= 0.0464). Therefore, these results enhanced our hypothesis that aggressive mutations primarily shorten the duration of carcinogenesis process while TP53 mutations accompanying with the aggressive mutations dramatically accelerate the oncogenesis. However, TP53 alone has fewer effect on diagnosis age than aggressive mutations.