Composition of the intestinal flora of the healthy subjects and CRC patients.
Fecal samples were collected from 44 patients (T group) having CRC of different stages and 61 samples from healthy individuals (N group). The relevant demographic and clinical details are presented in Table 1. The fecal samples were used for high-throughput sequencing and sequence extraction, splicing, and optimization. All samples were selected with the smallest number of sequences in the sample. By default, a 16S rRNA sequence similarity higher than 97% can be defined as an operational taxonomic unit (OTU). According to the results of OTU clustering, a Venn diagram was drawn and the numbers of common and unique OTUs between different groups were compared. As shown in Fig. 1A, there were 1569 OTUs in the N group, 1109 OTUs in the T group, and 4688 OTUs in both groups. According to the TNM stage of CRC patients, there were 1666, 223, 97, 167, 107 unique OTUs in the N, stage I, II, III, and IV groups, respectively (Fig. 1B). The rank abundance curve showed that the abundance in the N group was higher than that in the T group, and the difference in abundance between the OTUs was smaller in the N group than that in the T group (Fig. 1C). Also, the abundance of fecal flora in patients with stage II and IV CRC was similar and the smallest among those of patients with different stages of CRC, but the difference in the abundance between OTUs was the largest (Fig. 1D).
Table 1
Clinical characteristic of all individuals
| | Healthy volunteers | CRC patients |
| n | 61 | 48 |
| Age (median, range) | 52,40–62 | 60.5, 40–76 |
| Male/female | 32/29 | 31/17 |
| CRC stage | | |
| Stage Ⅰ | | 14 |
| Stage Ⅱ | | 10 |
| Stage Ⅲ | | 14 |
| Stage Ⅳ | | 10 |
Using the unweighted Unifrac distance to perform PCoA analysis, differences between groups were found (Fig. 1E-G). ANOSIM indicated that the difference between groups was significantly greater than the difference within groups (R = 0.385 > 0 and P = 0.001; Fig. 1H). The Chao1 index showed that the richness of the communities in the sample was different between the N and T groups, and between N and the patient groups for each stage (Fig. 1I-J). However, the Shannon and Simpson indexes reflecting the diversity of the community did not differ significantly (data not shown).
The structural analysis results for the intestinal flora in the T group and N group at the phylum level are shown in Fig. 1K and 1L. In the T group, the top six phyla were Firmicutes, Bacteroidetes, Proteobacteria, Actinobacteria, Verrucobacteria and Fusobacteria, and their proportions were 46.68%, 29.07%, 14.29%, 7.99%, 1.18% and 0.47%, respectively, accounting for 99.69% of the total quantity of microorganisms in the sample. In the N group, the top 6 phyla were Bacteroidetes, Firmicutes, Proteobacteria, Actinobacteria, Fusobacteria and Verrucomicrobia, and their proportions were 53.84%, 40.41%, 4.97%, 0.56%, 0.13% and 0.03%, respectively, accounting for 99.94% of the total microorganisms in the sample. At the phylum level, the relative abundances of Bacteroidetes, Proteobacteria, and Actinobacteria were significantly different between healthy subjects and CRC patients (P < 0.05).
Intestinal flora regulates cell apoptosis by affecting metabolism.
The abundance of bacteria involved in the metabolism of amino acids such as tyrosine metabolism, lysine, valine, leucine, and isoleucine was increased in the T group (Fig. 3A-D). Based on the PICRUSt function prediction of the 16S rDNA sequence, differences in the abundances in functional genes of KEGG pathways at different levels (1 ~ 3) were observed between the T group and N group. Based on this, a heat map was made at the genus level to examine the role of the genera in the different KEGG pathways. Among them, Prevotella and [Ruminococcus] were found to be involved in amino acid and tyrosine metabolism (Fig. 2). Additionally, Prevotella played an important role in lysine, valine, leucine, and isoleucine degradation (Fig. 2). In the stool sequencing of the T group, we found that the content of Prevotella was decreased and that of [Ruminococcus] was increased compared with the contents for the N group (Fig. 3E, F). In addition, Bacteroides and Sutterel were found to play roles in the biosynthesis of unsaturated fatty acids, fatty acid metabolism, glutathione metabolism, and lysine, valine, leucine and isoleucine degradation (Fig. 2). Notably, Bacteroides, Sutterel and Lactobacillus were all related to the apoptotic pathway. Also, the abundances of Bacteroides and Sutterel were decreased in the T group, while the abundance of Lactobacillus was increased in the T group (Fig. 2,3G-I).
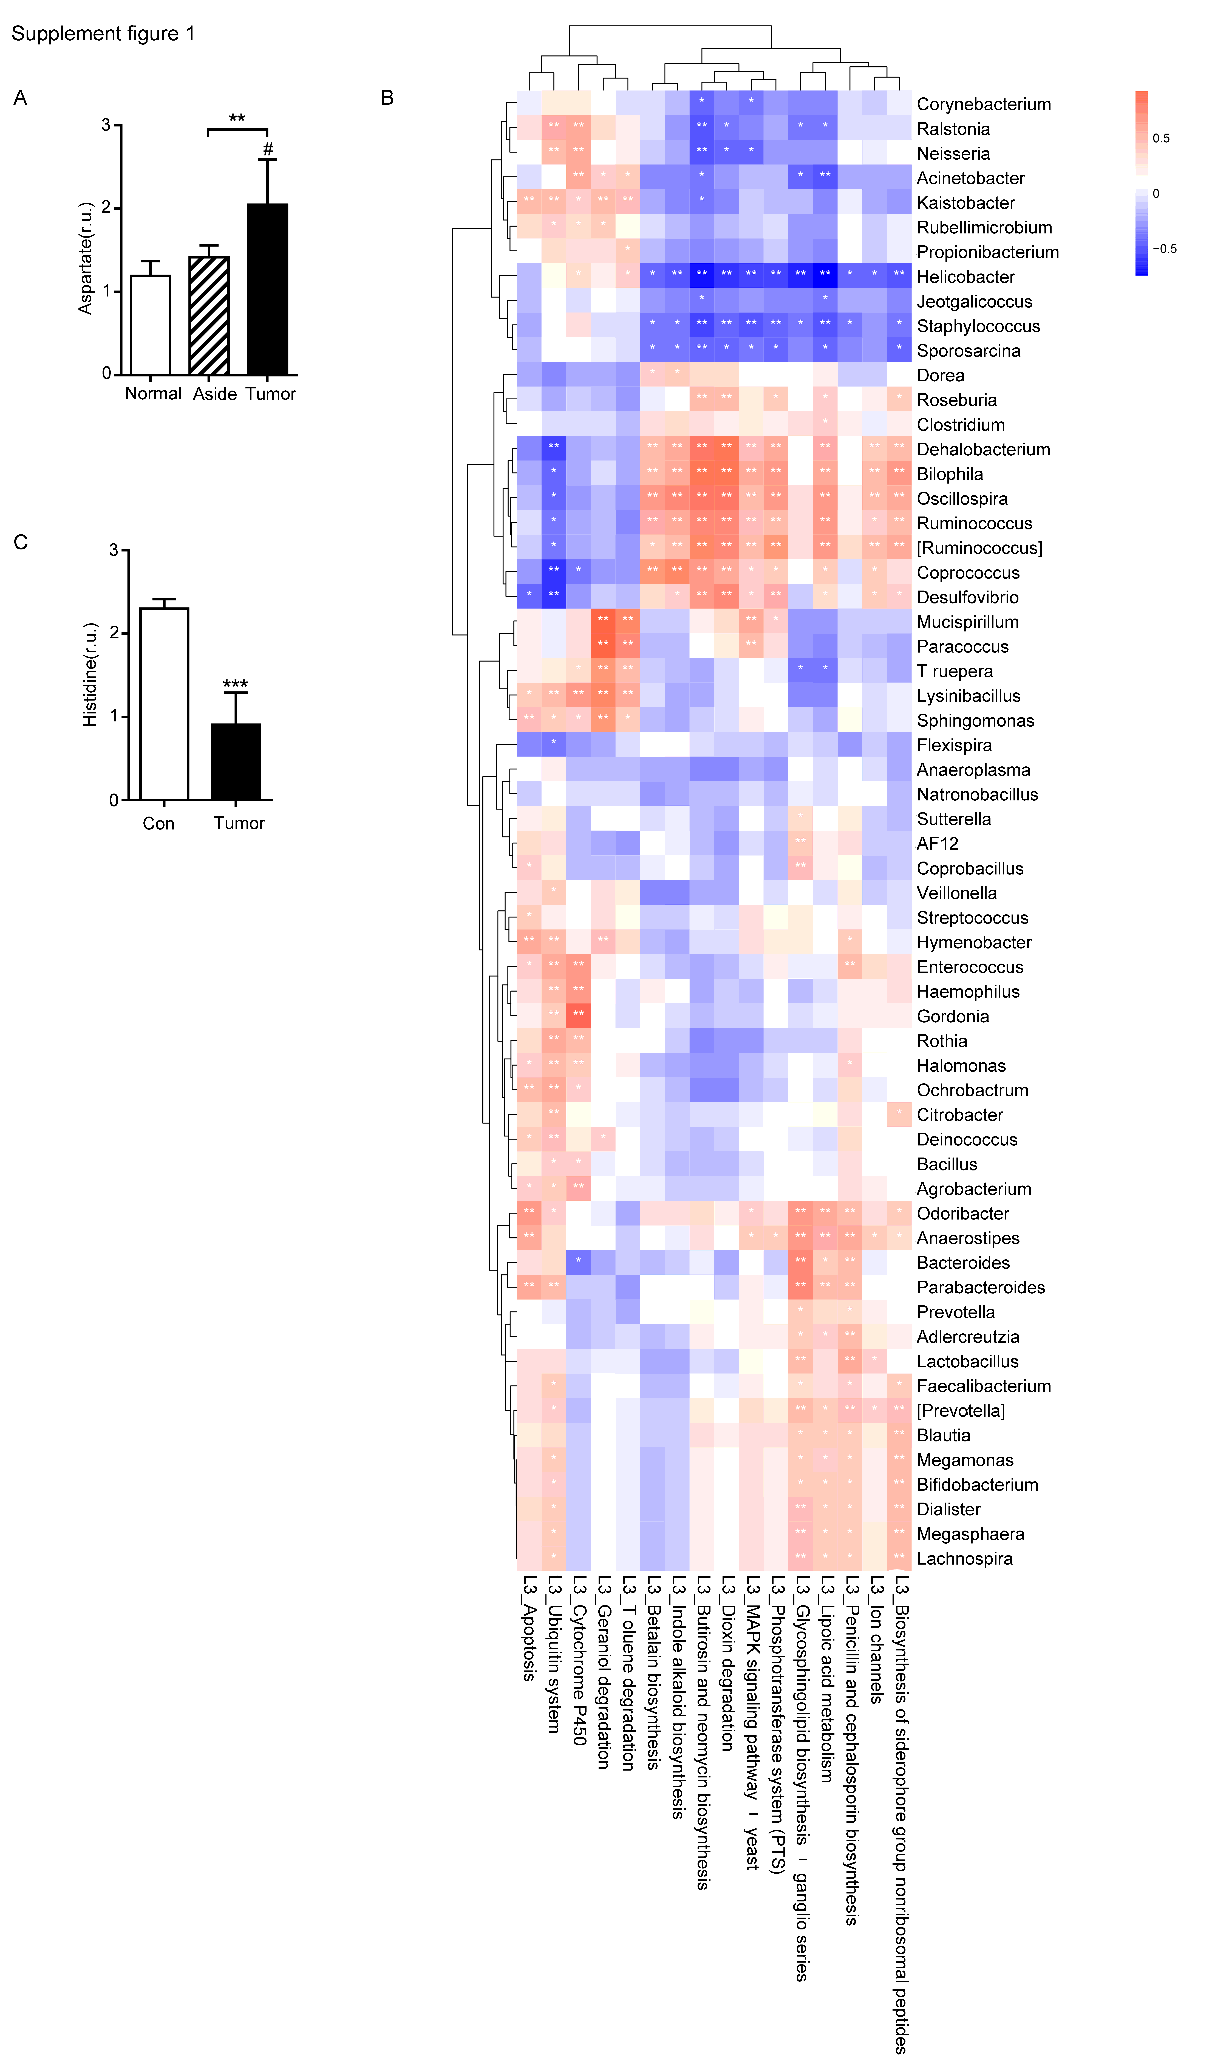
We also collected cancer tissues and adjacent normal colonic tissues from 5 CRC patients, and serum samples from 4 CRC patients and 4 healthy subjects for NMR detection. In the principal component analysis scoring chart (PCOA), we saw a separation trend between the serum of T and N groups, as well as a separation trend between the cancer tissues, the adjacent colonic tissues, and the normal tissues of the CRC patients (Fig. 4A,B). Lactic acid as the main metabolite of Lactobacillus was found to be increased in both the serum and tumor tissues (Fig. 4C,D). The results of mass spectrometry of tumor tissues from CRC patients showed that the content of propionic acid, the main metabolite of Bacteroides, was also increased (Fig. 4E). Interestingly, Lactobacillus and Bacteroides had increased abundances in the feces of CRC patients relative to controls (Fig. 4G,I). In addition, the levels of leucine and isoleucine in tumor tissues were significantly lower than those in the adjacent colonic tissues. Correspondingly, the levels of leucine and isoleucine in the serum of CRC patients were lower than those in healthy subjects (Fig. 4F,G,K,L). Also, the level of lysine in CRC tissues was decreased (Fig. 4H), while the serum levels of valine, histidine, alanine and tyrosine in the CRC patients were significantly decreased (Fig. 4N-P, Supplementary Fig. 1C). Notably, the glutamine content in the serum of CRC patients was decreased, while that in the tumor tissues was increased (Fig. 4J,M). In addition, the results showed that the levels of aspartic acid and glutathione in CRC tissues were increased (Fig. 4I, Supplementary Fig. 1A).
Based on the above results, we believe that the intestinal flora plays an important role in the regulation of cell apoptosis by affecting amino acid and lactic acid metabolism.
Fn affects cell apoptosis by regulating intestinal flora and associated metabolites .
To explore the effect of oral gavage with Fn on the intestinal flora and the intestinal metabolites of mice, we collected feces of a control (Con) group and a Fn group of mice for 16S rDNA sequencing and mass spectrometry detection. The correlation analysis of the microbes at the phylum level showed that the abundance of Fusobacteria was positively correlated with the abundance of Gemmatimonadetes and negatively correlated with the abundance of Euryarchaeota and Tenericutes (Fig. 5A). Firmicutes and Bacteroidetes were more abundant in the feces. Firmicutes was positively correlated with Planctomycetes and Gemmatimonadetes, but negatively correlated with Verrucomicrobia. Additionally, Bacteroidetes was positively correlated with Actinobacteria and Armatimonadetes (Fig. 5A). We used GraPhlan combined with OTU tables to display the results of OTU species annotations of all samples (Fig. 5B). Bacteria were mainly distributed in Firmicutes, Bacteroidetes, and Proteobacteria. For Firmicutes, the flora of Ruminococcaceae and Lactobacillaceae were mainly distributed in the Fn group. The flora of Lachnospiraceae, Dehalobacteriaceae and Staphylococcaceae were mainly distributed in the Con group. For Bacteroidetes, the flora of Odoribacteraceae, Bacteroidaceae, Prevotellaceae, Paraprevotellaceae, and Porphyromonadaceae were mainly distributed in the Fn group, and Rikenellaceae was mainly distributed in the Con group. The random forest algorithm was used to draw a point map of species importance, and the results showed that Odoribacter, Anaerostipes, Lactobacillus, Dorea, Proteus, Prevotella, Roseburia and Ruminococcus played major roles in the grouping effect (Fig. 5C). The comparison of phenotypic classification based on BugBase showed that the Fn + AOM group had the least anaerobic bacteria, and the Fn + AOM group and Fn group had higher facultative bacteria contents than the Con group (Fig. 6A,B). At the same time, in the Fn + AOM group and Fn group, the abundance of potentially pathogenic bacteria was increased (Fig. 6C). In addition, the ability for biofilm formation improved gradually in the Con, Fn + AOM, and Fn groups (Fig. 6D).
The results of KEGG pathway analysis showed that the abundance of the flora associated with the apoptosis pathway was increased in the Fn group (Fig. 6E). Compared with the Con group, the flora related to the MAPK signaling pathway was enriched in the Fn group, but decreased in the Fn + AOM group, which was similar to the distribution of the cytochrome p450-related flora (Fig. 6F,G). These series of results seem to point to an apoptotic pathway related to mitochondria. The analysis of the abundance of fecal flora showed that compared with the Con group, the abundance of Odoribacter, Dorea, and Rummococcus were increased in the Fn group but decreased in the Fn + AOM group. Prevotella increased significantly in the Fn group compared to the other two groups (Fig. 6I,L). In addition, the comparative analysis of Fn group and Con group showed that the abundance of Lactobacillus was increased significantly in the Fn group, but no difference was found in the three-group comparative analysis of the Fn group, Con group and Fn + AOM group (data not shown; Fig. 6H). At the same time, the correlation heat map of KEGG pathways and flora showed that Lactobacillus, Odoribacter and Bacteroides were related to the apoptosis pathway in the two-group comparative analysis of the Fn group and Con group (Fig. 7A). The above results showed that Lactobacillus and Bacteroides play an important role in the composition of the intestinal flora of mice given Fn gavage. OPLS-DA indicated that the model was stable (Fig. 7B). VIP > 1 and P value < 0.05 obtained using the OPLS-DA model were the screening criteria used to label the difference in the metabolites as significant. As shown in Fig. 7C, in the Fn group, 3-phenylpropanoic acid, 5-hydroxyindoleacetic acid and deoxyguanosine were decreased. However, alpha-tocopherol (vitamin E) was increased (Fig. 7C). D-lactic acid, the main metabolite of Lactobacillus, was significantly increased in the Fn group (Fig. 7C). In addition, propionic acid showed a downtrend in the Fn group compared to the Con group (Fig. 7D).
Based on the above results, we believe that in mice given Fn gavage, Bacteroides and Lactobacillus in the intestinal flora can affect cell apoptosis by regulating lactic acid and propionic acid metabolism.
Effects of lactic acid and propionic acid on the apoptosis of SW480 CRC cells.
To confirm the influence of propionic acid on the apoptosis pathway at the cellular level, we treated SW480 CRC cells with propionic acid to detect the expression of related proteins in the apoptosis pathway. We cultured SW480 cells with 15,25 mM lactic acid in a sugar-free environment for 48 hours. Western Blot analysis showed that the expression of anti-apoptotic protein Bcl-2 was increased (Fig. 8A). After treating SW480 cells with different concentrations of propionic acid, western blot analysis showed that Bax, cleaved-Parp and cleaved-caspase 3 expression increased significantly after treating the cells with 25 mM propionic acid for 48 hours. There was an upward trend in protein expression after treatment with 5 mM propionic acid, but the difference was not statistically significant (Fig. 8B). Based on these findings, we concluded that lactic acid, a metabolite of Lactobacillus, inhibited the apoptosis of SW480 cells, while propionic acid, a metabolite of Bacteroides, promoted apoptosis among SW480 cells.