3.1 Rheological properties
The rheological behavior of the neat polymers and polymer blends was analyzed by capillary rheometry. Figure 1 shows the viscosity (η) vs. shear rate (\(\dot{\gamma }\)) curves of all blends.
It can be observed that the neat polymers and the TPS/PCL blends showed pseudoplastic behavior, with a reduction in viscosity and an increase in shear rate. It was not possible to measure viscosity for the neat TPS at shear rates > 2,000 s− 1 due to equipment overload caused by the high TPS viscosity. This behavior indicates that TPS injection is not possible, which was also verified in processing, and justifies the need to manufacture blends that allow TPS fluidity.
Addition of PCL to TPS caused a decrease in the viscosity of the blends, resulting in blends less viscous than the neat TPS and with a behavior intermediate to that of neat polymers. This fact provides an improvement in TPS processability, facilitating its fluidity.
Corradini et al. [19] studied the rheological behavior of TPS obtained from regular starch and waxy starch in an internal mixer and found that the torque for regular starch remained constant at 12 Nm after 2 min of processing, while the torque for waxy starch remained constant at 5 Nm after that period. The native starch, with lower amylopectin content, presented higher viscosity during processing, which was attributed to linear amylose chains. Similar behavior has also been observed in starch pastes solubilized in water, where waxy starch showed a smaller viscosity value than that of regular starch, and resisted mechanical agitation 56% less than regular corn starch gel [24].
Although waxy starch has a higher molar mass, its viscosity is lower than that of regular starch, since amylopectin, its major constituent, is a highly branched macromolecule formed by short chains that reduces its ability to form tangles [19]. In addition, the amylose content present in regular starches results in higher viscosity and greater elastic flow behavior in the melted state [25].
Understanding the differences in the structure of the types of starches and their influence on the rheological behavior of TPS is important to ensure better fluidity of starch in the TPS extrusion and injection processes. The use of waxy starch results in better performance of the TPS blends.
3.2 Mechanical properties
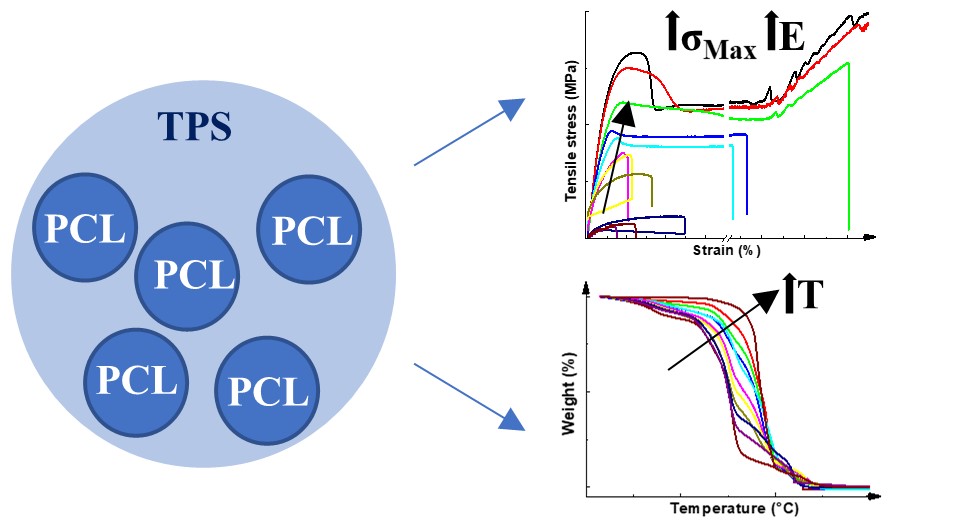
Mechanical properties of the neat polymers and their blends were evaluated by tensile tests. Typical stress–strain curves are shown in Fig. 2.
The values for maximum tensile strength (σmax), fracture strain (ε), Young’s modulus (E) are presented in Table 1.
Table 1
Mechanical properties of neat TPS and PCL and their polymer blends in ascending order of PCL content: tensile strength (σmax), fracture strain (ε) and Young’s modulus (E)
| Samples | σmax (MPa) | ε (%) | E (MPa) |
| TPS | (1.3 ± 0.1)a | (11.9 ± 1.8)a | (81 ± 1)a |
| TPS/PCL 90/10 | (1.2 ± 0.2)a | (7.6 ± 1.9)a | (81 ± 3)a |
| TPS/PCL 80/20 | (2.0 ± 0.1)a | (22.7 ± 4.0)a | (90 ± 2)a |
| TPS/PCL 70/30 | (3.6 ± 0.2)a,b | (13.3 ± 1.6)a | (146 ± 1)b |
| TPS/PCL 60/40 | (5.3 ± 0.2)b,c | (9.5 ± 0.9)a | (175 ± 8)c |
| TPS/PCL 50/50 | (6.4 ± 0.2)c | (9.0 ± 0.7)a | (207 ± 9)d |
| TPS/PCL 40/60 | (7.5 ± 0.1)c,d | (57.6 ± 16.7)b | (241 ± 13)e |
| TPS/PCL 30/70 | (8.8 ± 0.1)d | (113.5 ± 15.6)c | (311 ± 22)f |
| TPS/PCL 20/80 | (14.5 ± 1.4)e | (517.3 ± 17.5)d | (309 ± 19)f |
| TPS/PCL 10/90 | (17.5 ± 1.3)f | > 550 | (384 ± 12)g |
| PCL | (19.7 ± 1.3)g | > 550 | (374 ± 12)g |
| Difference letter on the same column means the difference of mean values is statistically significant by Tukey’s test (p < 0.05). |
Neat PCL exhibited a tensile strength of approximately 20 MPa and a very ductile behavior with great fracture strain (ɛ = > 500 %), as described in the literature [11, 26]. In contrast, neat TPS presented poor mechanical properties, reaching 1.3 MPa. When TPS and PCL were blended, there was a pronounced increase in mechanical properties compared with those of neat TPS. In general, the gain on mechanical properties of the blends over neat TPS was attributed to neat PCL. In this case, TPS acted simply as a filler that does not possess desirable mechanical properties in itself [3].
A study that compared native and waxy starches showed that the TPS from waxy starch exhibited fracture strain 3 times greater than that of native starch, while E and σmax were higher for the native starch [19], justifying the results obtained for TPS in this study. Furthermore, all the blends analyzed here presented strength resistance comparable to that of low-density polyethylene [3, 27], which suggests that these TPS/PCL blends can be applied to packaging.
For the TPS/PCL blends, there was an increase in E with increasing PCL content, and a behavior similar to maximum strength was found, in which the samples presented Young’s modulus values intermediate to that of neat polymers. In this case, E values of TPS and PCL were 80 and 370 MPa, respectively. This fact indicates that it is possible to increase the mechanical properties of TPS with addition of small amounts of PCL. These results for E were superior to those reported in a previous study that obtained TPS from regular starch [3]. Therefore, TPS/PCL blends obtained from waxy starch tend to present a higher E value than those of blends obtained from regular starch.
Neat TPS showed ɛ = 12%, while neat PCL and the TPS/PCL 90/10 blend endured rupture strain above the equipment limit of 650%. As expected, due the very ductile behavior of PCL, the specimens endured higher deformation rates with increasing PCL concentration. A contrary behavior was observed for the TPS/PCL blends obtained from regular starch plasticized with 35% glycerol, where the fracture strain decreased inversely with increasing the PCL content. This was attributed to phase separation between PCL and TPS, resulting from the non-miscibility between the polymers [13].
Figure 3 presents the E, ε, and σmax values by tensile tests as a function of TPS content in the TPS/PCL blends.
Variation in the values of E showed a linear trend according to TPS mass fraction variation (Fig. 3a). In this case, a synergistic behavior was observed only for the TPS/PCL 10/90 blend, whereas the blends containing 20 and 30% TPS presented additivity behavior and the other blends showed incompatibility behavior [28, 29]. According to the photomicrographs for the sample containing 10% TPS, in which synergism occurs, the starch phases are distributed more evenly and are well dispersed throughout the PCL matrix. For the other samples from 30% TPS, the starch phases are no longer homogeneous with each other and do not present a regular dispersion throughout the PCL matrix.
For all blends, there was an incompatibility behavior, since the fracture strain (Fig. 3b) and maximum resistance (Fig. 3c) values were lower than those of neat PCL [28, 29]. According to the photomicrographs, blends with up to 20% TPS presented the most homogeneous and dispersed starch phases compared with those of samples starting at 30% TPS, resulting in a drop in fracture strain and maximum strength between samples with 20 and 30% TPS. The highest crystallinity index for the PCL phase in the TPS/PCL 30/70 blend may have prevented a further drop in mechanical properties.
3.3 Morphological analysis
Considering that TPS and PCL were melt blended in a higher shear twin-screw extruder varying the amount of PCL in a range of 10 wt% in increasing order of addition, Fig. 4 shows the SEM photomicrographs of the cryogenic fracture surfaces of starch granules, neat polymers, and TPS/PCL blends in ascending order of PCL addition.
The starch granules presented polyhedral form and dimensions < 10 µm (Fig. 4a). Neat TPS showed a continuous matrix of plasticized starch (Fig. 4b). The plasticization process involves the loss of the crystalline character as a result of the disruption of starch granular structure [1]. It is possible to observe the presence of some pores and lumps, which can be attributed to the presence of water and air bubbles or starch granules that did not have the original granule structures completely ruptured. Normally, in plasticization of starch in an extruder using glycerol, the plasticizer breaks the hydrogen bonds and disrupts the granular crystalline organization [3]. Neat PCL (Fig. 4l) showed a continuous morphology characteristic of typical cryogenic fracture for a low glass temperature (Tg) polymer [11].
The photomicrographs evidence a homogeneous PCL/TPS distribution in the blends, which resulted in an immiscible blend leading to phase separation [8]. In the blend containing 90% TPS, it was not possible to perform the acid chemical treatment to remove the TPS phase (Fig. 4c). The high concentration of TPS and the thin thickness of the sample made the treatment unfeasible, causing most of the sample to solubilize. Note that the morphology obtained was in the form of drops, showing the PCL phase dispersed in the TPS matrix.
In blends with 80 to 60% TPS, co-continuous morphology was formed (Fig. 4d-f). The coalescence between its particles occurred more intensely as the TPS concentration was increased. The high degree of co-continuity in these blends may be explained by the lower viscosity of the PCL phase compared with that of the TPS phase. Therefore, even if PCL is a minor component, it tends to form a continuous phase [25]. For these blends, there was also a tendency for the TPS phase be concentrated in the middle of the specimens because of the probably higher viscosity of TPS. This TPS encapsulation can make the blend more resistant to any type of degradation [1].
With the decrease in TPS content, there was a phase change that allowed the formation of droplet-shape morphology, showing a decrease in the particle size of the TPS dispersed in the continuous PCL matrix (Fig. 4g-k). Regarding PCL concentration, it is important to note that with increasing its concentration, the blends showed a very dispersed morphology with the PCL matrix and finer TPS domains guaranteed by the higher shear extrusion [25].
The viscosity ratio beetwen the polymers in immiscible blends is an important parameter in the morphological formation and, consequently, in their physical properties [11]. The TPS/PCL viscosity ratio at 1000 s− 1 calculated when PCL was in the rich phase in the blend was 4.94, whereas the PCL/TPS viscosity ratio calculated at same shear rate when TPS was in the rich phase of the blend was 0.20. These values indicate that only the PCL droplets break in the TPS matrix, but the opposite does not occur, which means that the TPS droplets do not break in the PCL matrix, as observed in the SEM photomicrographs.
3.4 Thermal Analysis
Thermal stability was determined by TGA. Figure 5 presents the thermal degradation profile and derivative thermogravimetric (DTG) curves of the neat polymers and their respective TPS/PCL blends.
The Tonset values measured from the TGA curves are summarized in Table 2.
Table 2
Tonset of neat TPS and PCL polymers and TPS/PCL blends
| Samples | Tonset (°C) |
| Neat TPS | 281 |
| TPS/PCL 90/10 | 272 |
| TPS/PCL 80/20 | 274 |
| TPS/PCL 70/30 | 268 |
| TPS/PCL 60/40 | 281 |
| TPS/PCL 50/50 | 280 |
| TPS/PCL 40/60 | 291 |
| TPS/PCL 30/70 | 276 |
| TPS/PCL 20/80 | 276 |
| TPS/PCL 10/90 | 322 |
| Neat PCL | 350 |
The degradation temperatures for neat TPS and neat PCL were 280 and 350°C, respectively. Therefore, PCL has greater thermal stability than TPS, as illustrated in Fig. 5a. The TPS weight loss up to 140°C is due to water and other volatile compounds. The shoulder between 200 and 250°C on the DTG curve of neat TPS refers to the evaporation of glycerol. The thermal degradation of TPS and glycerol started at around 250–350°C, mainly due to dehydration of the hydroxyl groups and the subsequent formation of unsaturated and aliphatic low molecular weight carbon species [2, 11, 30]. The peaks above 400°C on the DTG curve for all samples are due to the carbonization in oxidative atmosphere (Fig. 5b) [31].
Most of the blends showed intermediate thermal stability behaviors compared with those of the neat polymers. With increasing the TPS amount, the blends presented a behavior similar to that of neat TPS because of its lower thermal stability. On the DTG curves, the peak that refers to TPS decomposition decreases with increasing the PCL content in the blend. Consequently, the peak that refers to PCL decomposition increases its intensity with increasing the PCL amount in blend, approaching the behavior of neat PCL. An increase of 10°C in the thermal stability of the TPS/PCL 40/60 blend was observed in relation to the other blends. This behavior can be explained by the coalescence exhibited by this blend in the SEM photomicrographs.
Differential scanning calorimetry was used to identify the main transition temperatures correlated to the mechanical properties of the blends. The glass (Tg), melting (Tm) and crystallization (Tc) temperatures, enthalpies of fusion (ΔHm), and crystallinity indexes (Ci) related to PCL were measured for each blend Fig. 6 shows the DSC curves for the first heating and cooling flows of the neat TPS and PCL polymers and the TPS/PCL blends.
Table 3 presents the data for transition temperatures and Ci calculated from ΔHm.
Table 3
Glass transition temperature (Tg), melting temperature (Tm), enthalpy of fusion (ΔHm), crystallinity index (Ci), and crystallization temperature (Tc) values for the neat TPS and PCL polymers and their blends
| Samples | Tg (°C) | Tc (°C) | Tm (°C) | ΔHm (J/g) | Ci (%) |
| TPS/PCL 90/10 | -60.2 | 31.6 | 59.6 | 7.0 | 52 |
| TPS/PCL 80/20 | -60.2 | 28.8 | 61.8 | 15.1 | 56 |
| TPS/PCL 70/30 | -59.5 | 29.7 | 61.4 | 20.8 | 51 |
| TPS/PCL 60/40 | -60.8 | 28.5 | 62.1 | 30.3 | 56 |
| TPS/PCL 50/50 | -62.6 | 31.1 | 62.9 | 39.4 | 58 |
| TPS/PCL 40/60 | -61.9 | 30.1 | 63.5 | 46.9 | 58 |
| TPS/PCL 30/70 | -60.1 | 30.0 | 63.0 | 60.1 | 63 |
| TPS/PCL 20/80 | -60.0 | 29.3 | 64.7 | 64.1 | 59 |
| TPS/PCL 10/90 | -59.8 | 30.0 | 61.0 | 71.0 | 58 |
| Neat PCL | -59.4 | 31.0 | 58.4 | 72.6 | 53 |
The neat TPS curve did not show any thermal event because TPS is an amorphous material due to the plasticization process that destroys the starch grains and disrupts the crystalline orders [15]. In contrast, neat PCL presented higher crystallinity index (53%), showing the Tm around 58°C, corresponding to crystals fusion (Fig. 6a) [3, 8, 11, 26].
Blending of TPS with PCL caused a slight increase of up to 5°C on the Tm of the TPS/PCL 40/60 blend, as observed in the dotted lines of the DSC diagrams. These results are in accordance with the coalescence TPS phases in the PCL matrix observed in the SEM photomicrographs, suggesting that there is higher molecular interaction in this blend that affects the thermal stability and Tm of the blend. The peak corresponding to Tm is attenuated with increasing the TPS content in the blend as a result of the increased concentration of amorphous material, being the peak area also in accordance with PCL content [1].
It should be noted that the Tg values of these materials were not evident. This fact is possibly related to the domain of the crystalline phase over the amorphous phase [8]. The Tg of the neat PCL was obtained with a subtle inflection of the curve around 60°C, providing PCL-based materials with high flexibility at room temperature [1, 26]. Wide variations in Tg did not occur with addition of TPS to the TPS/PCL blends. In this way, TPS and PCL can be blended without affecting this parameter.
The Tc related to PCL crystallization is observed at around 30°C, as reported in the literature (Fig. 6b) [11]. The blends presented Tc close to that of the neat PCL and did not interfere with PCL crystallization when a controlled cooling rate was applied. The crystallization peak was also attenuated by increasing the TPS fraction in blends.
The CI related to PCL was calculated according to the Eq. 1 presented in the DSC assay methodology. The CI of PCL represents the crystalline fraction of the material related to the thermal processing history. Neat PCL presented 53% crystallinity, as reported in the literature [11, 26]. PCL is a semi-crystalline polymer, and the presence of other substances and processing can induce or restrict their crystallinity [2]. When PCL was blended with TPS, it became slightly more crystalline in most of the blends. Incorporation of TPS into the PCL matrix induced its crystallization, reaching the maximum of 63% for the TPS/PCL 30/70 blend, suggesting that TPS acted as a nucleating agent. At the other concentrations, the PCL crystallinity remained similar to that of the neat PCL. Higher ΔHm values have been correlated with the crystalline fraction of polymers. Although there was a decrease in the ΔHm of the blends with the increase in TPS content, proportionally, there was also a decrease in the PCL content, which was responsible for the crystalline portion of the blends [11].