Preparation and Characterizations of L@MNP
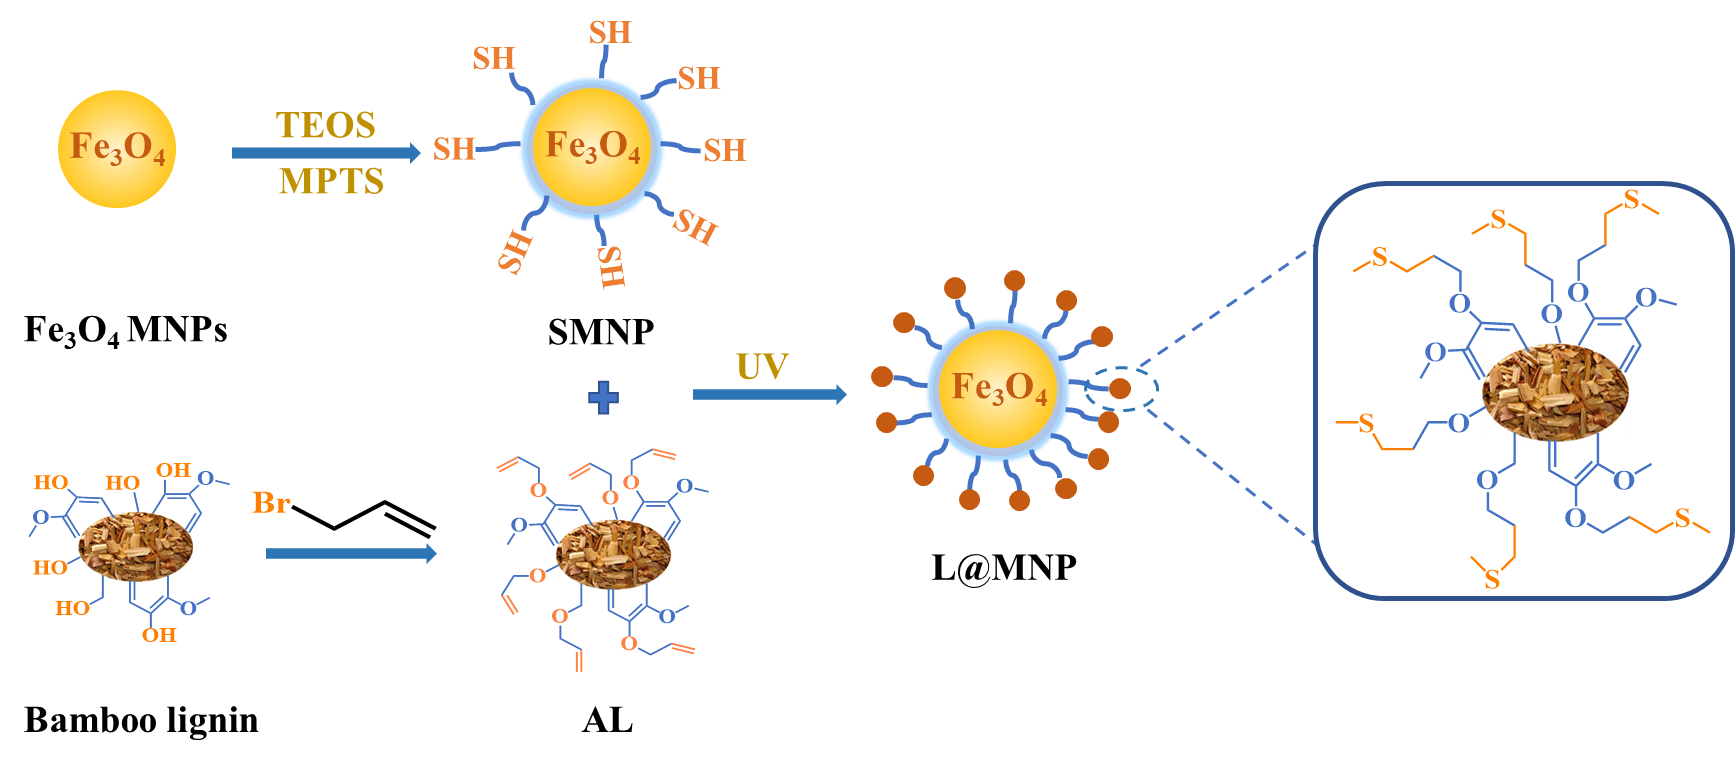
As presented in Scheme 1, lignin-based magnetic adsorbent (L@MNP) was fabricated from sulfhydryl-functionalized SMNP and alkenyl lignin via thiol-ene click reaction under UV light (365 nm) irradiation [28]. It was expected that the lignin layer coated on L@MNP surface would enhance the dispersibility and stability of magnetic core, and simultaneously facilitate its adsorption performance due to the generated thioether bonds (C-S) as adsorbing sites [29].
Fourier transform infrared (FT-IR) spectroscopy was conducted to verify the successful synthesis of L@MNP, as illustrated in Fig. 1a. Two bands at 3381 and 538 cm− 1 were corresponded to O-H and Fe-O groups of Fe3O4 MNPs sample, respectively [30]. For SMNP sample, a new peak at 985 cm− 1 assigned to Si-O asymmetric vibration could be observed, implying the silicon layer had been successfully coated on Fe3O4 surface [31]. The characteristic peaks of L@MNP at 1597, 1503 and 1227 cm− 1 were ascribed to aromatic ring′s skeletal vibration, demonstrating the presence of lignin layer [32]. Meanwhile, the appearance of thioether bond (C-S) at 1128 cm− 1 further confirmed the successful crosslinking between lignin and magnetic nanoparticles [33]. In addition, the reaction process was monitored by FT-IR spectra (Fig. S1). At different UV light irradiation intervals (0–90 min), the peak intensity of C-S bond at 1128 cm− 1 gradually increased and tended to be stable over 60 min, which revealed a complete transformation of alkenyl group into thioether bond. The elemental analysis was investigated to study the changing contents of C, H and S elements in Fe3O4 MNPs, SMNP and L@MNP during the reaction process (Table S1). After modification with sulfhydryl groups, the sulfur content of SMNP significantly increased to 0.973%. Meanwhile, the carbon content of L@MNP (4.96%) was higher than that of SMNP (1.67%) after the incorporation of lignin, confirming the successful introduction of lignin component. Moreover, the XRD patterns (Fig. 1b) appearing at 30.0° (220), 35.6° (311), 43.2° (400), 53.9° (422), 57.1° (511) and 62.8° (440) corresponding to typical crystalline Fe3O4 [34] were observed for Fe3O4 MNPs, SMNP and L@MNP samples, respectively, indicating the magnetic cores remained unchanged regardless any modification process.
More features of morphology were further characterized by TEM and SEM (Fig. 2). Upon comparison of the SEM images of SMNP (Fig. 2a) and L@MNP (Fig. 2b), a high similarity in their morphologies was discovered, which confirmed that both SMNP and L@MNP showed the uniform spherical morphology. Due to the coating of SiO2 and lignin layers, L@MNP owned a bigger particle size (about 37 nm) than the unmodified MNPs (about 30 nm). The TEM image (Fig. 2c) of SMNP demonstrated that the magnetic nanoparticles exhibited a core-shell structure. Additionally, such core-shell structure was maintained for L@MNP (Fig. 2d) with the lignin layer modification onto SMNP surface [35]. The difference caused by lignin distribution between SMNP and L@MNP were also supported by the XPS analysis. As displayed in Table S2, the carbon distribution on SMNP (25.60%) and L@MNP (44.63%) measured by XPS study were obviously higher than that of SMNP (1.67%) and L@MNP (4.96%) from elemental analysis, indicating the lignin component mainly distributed as shell layer on the surface of magnetic Fe3O4 core [22].
The magnetic measurement results of Fe3O4 MNPs, SMNP and L@MNP were displayed in Fig. S2. There was no hysteresis loop in magnetization curves of SMNP and L@MNP as well as both of the remanence and coercivity closed to zero, which indicated SMNP and L@MNP were superparamagnetic in nature. The magnetization curves showed that the saturation magnetization of both SMNP (54.46 emu/g) and L@MNP (51.00 emu/g) sharply decreased compared to Fe3O4 MNPs (84.13 emu/g), due to the modification of non-magnetic silicon and lignin layers. It is worth mentioning that the saturation magnetization of L@MNP is superior than many reported magnetic adsorbents [29, 36], which enables it a quick recovery (within 15 s) from the aqueous system using an external magnet.
Adsorption studies
Effect of pH
Effect of solution pH on adsorption performance of L@MNP was studied, and the results were shown in Fig. 3a. As the pH value rising from 2.0 to 6.0, the adsorption capacity of L@MNP for Pb(II) increased from 7.25 to 66.25 mg/g. In the L@MNP structure, both sulphur- and oxygen-containing groups could serve as active sites for chelating Pb(II) ions. When pH < 5.0, H3O+ species was dominant in solution, and thus only a small amount of cationic Pb(II) ions could be adsorbed since the mutually exclusive force between the protonated surface of L@MNP and Pb(II) cations. On the other hand, as pH > 5.0, the H3O+ concentration reduced and Pb(II) ions were easily coordinated by adsorbent, which resulted in the rising adsorption capacity of L@MNP [37]. In the case of lead, Pb(OH)2 precipitation began to form at pH > 6.0 [38]. Therefore, the solution pH value was set at 5.0 for further adsorption experiments.
Effect of adsorption time
To assess the adsorption process of Pb(II) on L@MNP, effect of contact time was investigated with the initial Pb(II) concentration set as 200 mg/L at 25 ℃. As illustrated in Fig. 3b, the Pb(II) adsorption capacity of L@MNP sharply increased at the initial stage and reached equilibrium (qe = 64.25 mg/g) within 30 min. This rapid adsorption of Pb(II) by L@MNP could be mainly attributed to its well dispersion property within the crosslinked core-shell structure, which was beneficial for ions transportation and provided sufficient binding sites to capture Pb(II).
The obtained kinetics data was fitted by the pseudo-first-order model (Eq. 3), pseudo-second-order model (Eq. 4) and intraparticle diffusion model (Eq. 5) to evaluate the relationship between adsorption rate and capturing mechanism, respectively [39], and the fitting results were presented in Fig. 3c-d:
|
\(\text{log}\left({\text{q}}_{\text{e}}\text{-}{\text{q}}_{\text{t}}\right)\text{=}\text{log}{\text{q}}_{\text{e}}\text{-}\frac{{\text{k}}_{\text{1}}}{\text{2.303}}\text{t}\)
|
(3)
|
|
\(\frac{\text{t}}{{\text{q}}_{\text{t}}}\text{=}\frac{\text{1}}{{\text{k}}_{\text{2}}{\text{q}}_{\text{e}}^{\text{2}}}\text{+}\frac{\text{t}}{{\text{q}}_{\text{e}}}\)
|
(4)
|
|
\({\text{q}}_{\text{t}}\text{=}{\text{k}}_{\text{p}}{\text{t}}^{\text{0.5}}\text{+C}\)
|
(5)
|
where qe (mg/g) and qt (mg/g) are the Pb(II) adsorption capacity at equilibrium time and time t, respectively, k1 (1/min) the pseudo-first-order adsorption kinetic constant, k2 [g/(mg·min)] the pseudo-second-order adsorption kinetic constant, kp [g/(mg·min0.5)] the intraparticle diffusion rate constant, and C a constant.
Table 1
Kinetic adsorption parameters for Pb(II) adsorption on L@MNP
|
Pseudo-first-order model
|
|
qe (mg/g)
|
k1 (1/min)
|
R2
|
|
25.87
|
0.02871
|
0.7805
|
|
Pseudo-second-order model
|
|
qe (mg/g)
|
k2 [g/(mg·min)]
|
R2
|
|
63.13
|
0.00414
|
0.9987
|
|
Intraparticle diffusion model
|
|
kp1 [g/(mg·min0.5)]
|
R12
|
kp2
[g/(mg·min0.5)]
|
R22
|
kp3
[g/(mg·min0.5)]
|
R32
|
|
15.8078
|
0.9518
|
9.0273
|
0.9877
|
0.4351
|
0.9794
|
As displayed in Table 1, the fitting results exhibited that the coefficient (R2 = 0.9987) of pseudo-second-order kinetic model was higher than that of pseudo-first-order kinetic model (R2 = 0.7805). In addition, the theoretical adsorption capacity (63.13 mg/g) derived by the pseudo-second-order kinetic model was much closer to the experimental value (62.25 mg/g), which indicated that the pseudo-second-order kinetic model could well describe the adsorption process. These observations verified that the chemical adsorption played a major role during the adsorption process [40].
The fitting results of intraparticle diffusion model showed that there were three stages in the diffusion of Pb(II) onto adsorbent. Thus, three intraparticle constants (kp1, kp2 and kp3) were used to express the diffusion rates of these three stages. It could be found from the fitting data in Table 1 that the order of diffusion rate followed an order as kp1>kp2>kp3. Evidently, the first stage was dominated by rapid surface diffusion in initial adsorption process (kp1 = 15.8078), where a large number of Pb(II) ions were rapidly chelated onto L@MNP surface [41]. When the surface sites of adsorbent reached saturation, Pb(II) ions began to diffuse into the pores of adsorbent and attached to inner surface during the second stage. At the same time, there existed resistance when Pb(II) diffused into adsorbent pores, which led to the decrease of diffusion rate constant (kp2 = 9.0273) [42]. Subsequently, the third stage presented the adsorption equilibrium stage. As diffusion continued, active sites on the inner surface of adsorbent for the most part had reached adsorption equilibrium, which led to the minimum diffusion rate constant (kp3 = 0.4351) in three stages [43]. In addition, since the fitting line did not pass through zero point, it seemed that boundary diffusion and external diffusion would also effect the Pb(II) adsorption process on L@MNP.
Adsorption isotherms
Adsorption isotherm of L@MNP for Pb(II) was studied at various initial Pb(II) concentrations (25–750 mg/L), pH 5.0, and at 25 ℃. As displayed in Fig. 4a, adsorption capacity of L@MNP increased along with the ascending initial Pb(II) concentration, which illustrated that high solution concentration was beneficial for the adsorption performance of L@MNP. Adsorption behavior of L@MNP was analyzed using the Langmuir model (Eq. 6) [44] and Freundlich model (Eq. 7) [45], respectively:
|
\({\text{q}}_{\text{e}}\text{=}\frac{{\text{K}}_{\text{L}}{q}_{\text{max}}{\text{C}}_{\text{e}}}{\text{1}\text{+}{\text{K}}_{\text{L}}{\text{C}}_{\text{e}}}\)
|
(6)
|
|
\({\text{q}}_{\text{e}}\text{=}{\text{K}}_{\text{F}}{\text{C}}_{\text{e}}^{\text{1}\text{/n}}\)
|
(7)
|
where qe (mg/g) is the adsorption capacity at equilibrium, qmax (mg/g) the maximum adsorption capacity of L@MNP, Ce (mg/L) the solution concentration at adsorption equilibrium, KL (L/mg) the Langmuir model constant, KF (mg/g) the Freundlich model constant, and 1/n the Freundlich adsorption coefficient.
The fitting curves and parameters of the Langmuir and Freundlich models were shown in Fig. 4a and Table 2, respectively. These fitting findings indicated that the Pb(II) adsorption by L@MNP well followed the Langmuir model with a high fitting coefficient (R2 = 0.9928), demonstrating a monolayer adsorption process [46]. In addition, qmax was calculated to be 97.38 mg/g, which was not only obviously higher than that of the raw lignin (qmax = 12.00 mg/g), but also surpassed many reported adsorbents (Table 3).
Table 2
Fitting parameters of the Langmuir and Freundlich models for Pb(II)
|
Langmuir isotherm model
|
|
Qmax (mg/g)
|
KL (1/min)
|
R2
|
|
97.38
|
0.00678
|
0.9928
|
|
Freundlich isotherm model
|
|
KF
|
1/n
|
R2
|
|
5.6791
|
0.4130
|
0.9244
|
Table 3
Adsorption capacities of different adsorbents reported for Pb(II)
|
Adsorbents
|
Condition
|
qmax (mg/g)
|
Ref
|
|
pH
|
Temperature
(K)
|
|
lignin
|
-a
|
330
|
9.00
|
[47]
|
|
1-Aza-18-crown-6 functionalized lignin-based adsorbent (AFL)
|
6.0
|
298
|
91.4
|
[48]
|
|
Lignin xanthate resin
|
5.0
|
303
|
63.90
|
[49]
|
|
N-Acetyl-L-cysteine-functionalized lignin (CFL)
|
6.0
|
288
|
58.80
|
[26]
|
|
Hiol-functionalized cellulose nanofiber membrane
|
4.0
|
rtb
|
22.00
|
[50]
|
|
Magnetized activated carbons (MAC)
|
5.0
|
298
|
253.20
|
[51]
|
|
Lignin derivate magnetic
hydrogel microspheres
|
5.0
|
298
|
33.00
|
[52]
|
|
Magnesium oxide cores with silica coated nano-magnetite (MTM)
|
-a
|
298
|
85.10
|
[53]
|
|
L@MNP
|
5.0
|
298
|
97.38
|
this study
|
|
raw lignin
|
5.0
|
298
|
12.00
|
this study
|
| a Not available. b Room temperature. |
Adsorption thermodynamics.
Adsorption thermodynamics were further investigated to explore the energy changes and feasibility of Pb(II) adsorption on L@MNP, as temperatures ranging from 25 to 45 ℃. Correspondingly, the thermodynamic parameters including Gibbs free energy change (ΔG0, kJ/mol), enthalpy change (ΔH0, kJ/mol), and entropy change [ΔS0, J/(mol·K)] could be calculated based on Eq. 8–10 [54]:
|
\(\text{∆}{\text{G}}^{\text{0}}\text{=-}\text{RT}\text{ln}{\text{k}}_{\text{d}}\)
|
(8)
|
|
\(\text{ln}{\text{k}}_{\text{d}}\text{=-}\frac{\text{∆}{\text{H}}^{\text{0}}}{\text{RT}}\text{+}\frac{\text{∆}{\text{S}}^{\text{0}}}{\text{R}}\)
|
(9)
|
|
\({\text{k}}_{\text{d}}\text{=}\frac{{\text{q}}_{\text{e}}}{{\text{C}}_{\text{e}}}\)
|
(10)
|
where R [8.314 J/(mol·K)] stands for the universal gas constant, and kd the distribution coefficient.
The linear function of lnkd versus 1/T was fitted based on the equilibrium adsorption data at different adsorption temperatures (Fig. 4b), and the thermodynamic parameters were shown in Table 4. Negative values of ΔG0 at all tested temperatures implied that the adsorption process occurred spontaneously [55]. Meanwhile, the ΔG0 values decreased gradually with the increase of temperature, indicating that the force in adsorption driving was positively correlated with the spontaneous degree range [56]. Positive value of ΔH0 proved that adsorption was endothermic in nature. Additionally, the positive value of ΔS0 suggested an increasing freedom degree at solid-liquid interface [57].
Table 4
Parameters of thermodynamic about adsorption for Pb(II) on L@MNP
|
Adsorbent
|
ΔH0 (kJ/mol)
|
ΔS0 [J/(K·mol)]
|
ΔG0 (kJ/mol)
|
|
298 K
|
308 K
|
318 K
|
328 K
|
|
L@MNP
|
6.36
|
46.80
|
-7.12
|
-7.58
|
-8.05
|
-8.52
|
Adsorption selectivity
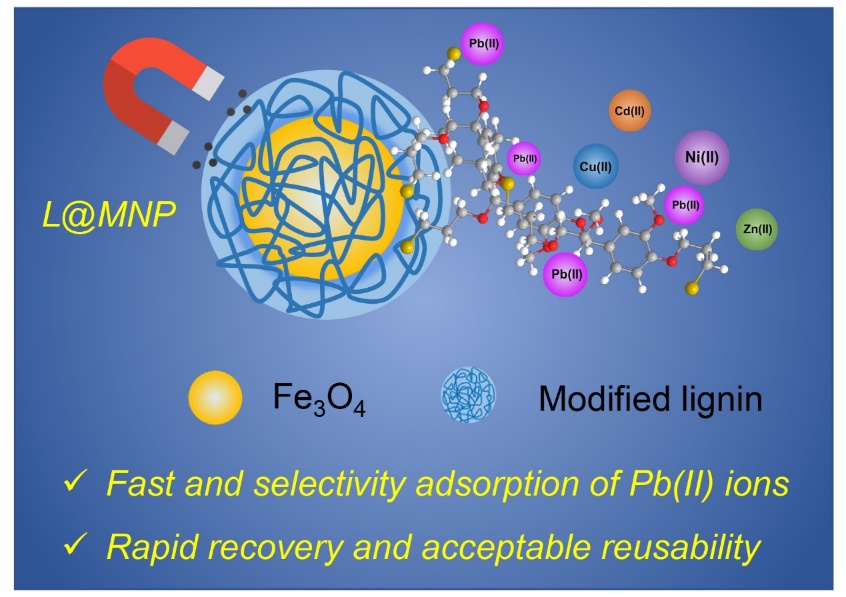
It is impossible to have only a single heavy metal in actual sewage. Thus, different co-existing substances including Cu(II), Cd(II), Ni(II) and Zn(II) ions were tested herein for possible competitive effect on the adsorption of Pb(II) by L@MNP with pH 5.0 at 25 ℃. As presented in Fig. 4c, adsorption capacities of L@MNP toward various heavy metal ions were found to follow the order of Pb(II) > Cu(II) > Cd(II) > Zn(II) > Ni(II). Despite suffering electrostatic repulsion among various cations [58], L@MNP still showed an excellent selectivity toward Pb(II) over other competitive metal ions. Convectively, the affinity and selectivity of L@MNP to various metal cations could be distinguished via comparing the distribution coefficient (k). As listed in Table 5, the high-relative k (0.903) for Pb(II) encourages L@MNP to be an excellent selective adsorbent for Pb(II) adsorption. On the basis of the Pearson’s hard/soft acid/base (HSAB) theory, Pb(II) has been classified as a more softer acid than other metal ions due to its higher water binding energy and larger radius of hydrated ions. Thus, the S/O containing functional groups serving as soft bases in L@MNP could feasibly chelate the soft metal Pb(II) [59], which resulted in a remarkable selectivity for Pb(II) capture.
Table 5
Adsorption selectivity paraments of L@MNP for metal ions
|
Adsorbent
|
Selective coefficient k
|
|
k (Pb)
|
k (Cd)
|
k (Cu)
|
k (Ni)
|
k (Zn)
|
|
L@MNP
|
0.903
|
0.381
|
0.135
|
0.061
|
0.080
|
Adsorption recyclability
The recyclability characteristics of an adsorbent are critical in practical application. Under the suitable adsorption conditions (pH 5.0, T = 25 ℃ and contact time 3 h), the Pb(II) loaded L@MNP could be desorbed by rinsing with 0.1 M HCl solvent to evaluate its reusability performance. As shown in Fig. 4d, the adsorption efficiency remained 62.86% after 5 adsorption-desorption cycles. Besides, the desorption efficiency of L@MNP was found over 95.27%. Thus, the acceptable regeneration performance of L@MNP would favor a recyclable utilization in wastewater treatment.
Adsorption mechanism
For the purpose of proving the adsorption mechanism between adsorbent and metal ion pollutants, the L@MNP sample before and after Pb(II) adsorption was detected by XPS spectra (Fig. 5a-c). In Fig. 5a, the high-resolution XPS spectrum showed three characteristic peaks of Pb 4f3/2, Pb 4f5/2 Pb 4f7/2 at 436.3, 414.4 and 139.5 eV, respectively, which indicated that Pb(II) was adsorbed onto L@MNP surface in an ionic state [60]. Figure 5b-c presented the obvious shifts of the O 1s and S 2p peaks, which proved that both O and S containing groups contributed to the adsorption process. Particularly, three O 1s peaks at 532.8, 530.8, and 529.7 eV attributed to Si-O, C-O and Fe-O groups moved to 532.9, 531.5 and 530.1 eV after Pb(II) adsorbed onto L@MNP surface, respectively [61]. Meanwhile, two S 2p peaks at 164.8 and 162.9 eV ascribed to C-S and -SH groups of L@MNP shifted to 167.9 and 163.5 eV for L@MNP-Pb(II), confirming the coordination behavior also occurred between sulfur containing groups and Pb(II) [62]. These observations could be explained as follows: after Pb(II) adsorption, O and S atoms shared lone pair electrons with the adsorbed Pb(II), which made them shifted to higher binding energy with the decreased electron density [34]. Based on the above findings, the Pb(II) complexation with functional groups involved in the primary interaction mechanism between L@MNP and Pb(II) ions.