2.1 DPSCs isolation and culture
Disease-free impacted third molars at the stage of root development (6 patients aged 12 to 18 years, males and females) were extracted from patients at the Stomatological Hospital of the Fourth Military Medical University according to a protocol approved by the Institutional Review Board of the Fourth Military Medical University. We confirmed that all methods were performed in accordance with the relevant guidelines, and informed consent was obtained from all patients. DPSCs were isolated and cultured using the method described by our previous research[9, 22]. Cells were seeded in 12-well plates at a density of 2×10⁴ cells/mL, grown to 70% confluence, and incubated in odonto/osteogenic differentiation medium containing 10% FBS, 1% penicillin-streptomycin, 10 nmol/L dexamethasone, 50 mg/L ascorbic acid and 10 nmol/L β-glycerophosphate (all purchased from Sigma-Aldrich) for 2 weeks. Cultures were fixed in 4% paraformaldehyde for 30 min, washed, and stained with 1% Alizarin Red S (pH = 4.2, Sigma-Aldrich) for 15 min. Then, flow cytometric examination was applied to determine the cell phenotype for CD29/PE, CD34/PE, CD45/PE, CD90/PE, CD105/PE and CD146/PE (BioLegend, San Diego, CA, USA). Cells from these clones were obtained, and passage 0 (P0) cells were cultured and expanded for subsequent experiments.
In order to verify whether the effect of SDF-1α on the odontogenic differentiation of DPSCs is consistent with our previous studies. DPSCs were cultured in mineralization-inducing medium with 100ng/mL SDF-1α for 7 days. Then Real-time RT-PCR and Westernblot analysis were used To detect the expression levels of osteo/odontogenic marker genes.
2.2 Expression microarray analysis
2.2.1 RNA isolation and quality control
Total RNA was isolated with TRIzol reagent (Invitrogen) and purified with a TaKaRa Kit (TaKaRa, Dalian, China) according to the manufacturer’s protocol. RNA quantity and quality were measured by a NanoDrop ND-1000. RNA integrity was assessed by standard denaturing agarose gel electrophoresis or an Agilent 2100 Bioanalyzer.
2.2.2 Microarray analysis
RNA quantity and quality were measured by a NanoDrop ND-10000 (Thermo Scientific, Waltham, MA, USA), and RNA integrity was assessed by standard denaturing agarose gel electrophoresis. An Arraystar Human LncRNA Microarray V5.0 was designed for the global profiling of human lncRNAs and protein-coding transcripts. Approximately 39,317 lncRNAs and 21,174 coding transcripts were detected by the third-generation lncRNA microarray. After quantile normalization of the raw data, lncRNAs showing significant differences in expression between the two groups were identified through P-value/FDR filtering.
2.2.3 RNA labelling and array hybridization
Sample labelling and array hybridization were performed according to the Agilent One-Color Microarray-Based Gene Expression Analysis protocol (Agilent Technology) with minor modifications. Briefly, each RNA sample was amplified and transcribed into fluorescent cRNA along the entire length of the transcripts without 3' bias utilizing a random priming method (Arraystar Flash RNA Labeling Kit, Arraystar). The labelled cRNAs were purified by an RNeasy Mini Kit (Qiagen). The concentration and specific activity of the labelled cRNAs (pmol Cy3/μg cRNA) were measured by a NanoDrop ND-1000. One microgram of each labelled cRNA was fragmented by adding 5 μL of 10× Blocking Agent and 1 μL of 25× Fragmentation Buffer and then heating the mixture at 60°C for 30 min. Finally, 25 μL of 2× GE Hybridization buffer was added to dilute the labelled cRNA. Fifty microlitres of hybridization solution was dispensed into the gasket slide and assembled in the lncRNA expression microarray slide. The slides were incubated for 17 h at 65°C in an Agilent Hybridization Oven. The hybridized arrays were washed, fixed and scanned using the Agilent DNA Microarray Scanner (part number G2505C). Agilent Feature Extraction software (version 11.0.1.1) was used to analyse the acquired array images. Quantile normalization and subsequent data processing were performed using the GeneSpring GX v12.1 software package (Agilent Technologies). Differentially expressed lncRNAs with statistical significance between the two groups were identified through P-value/FDR filtering. Differentially expressed lncRNAs between the two samples were identified through fold change filtering.
2.2.4 Quantitative real‑time PCR (qRT‑PCR)
Total RNA was isolated using TRIzol reagent (Invitrogen) and then reverse transcribed using SuperScriptTM III Reverse Transcriptase (Invitrogen) according to the manufacturer's instructions. The levels of five lncRNAs with upregulated and five with downregulated expression included in the microarray study were measured by qRT-PCR using 2X PCR master mix (Arraystar). The primer sequences are shown in Table 1.
2.2.5 Bioinformatics analysis
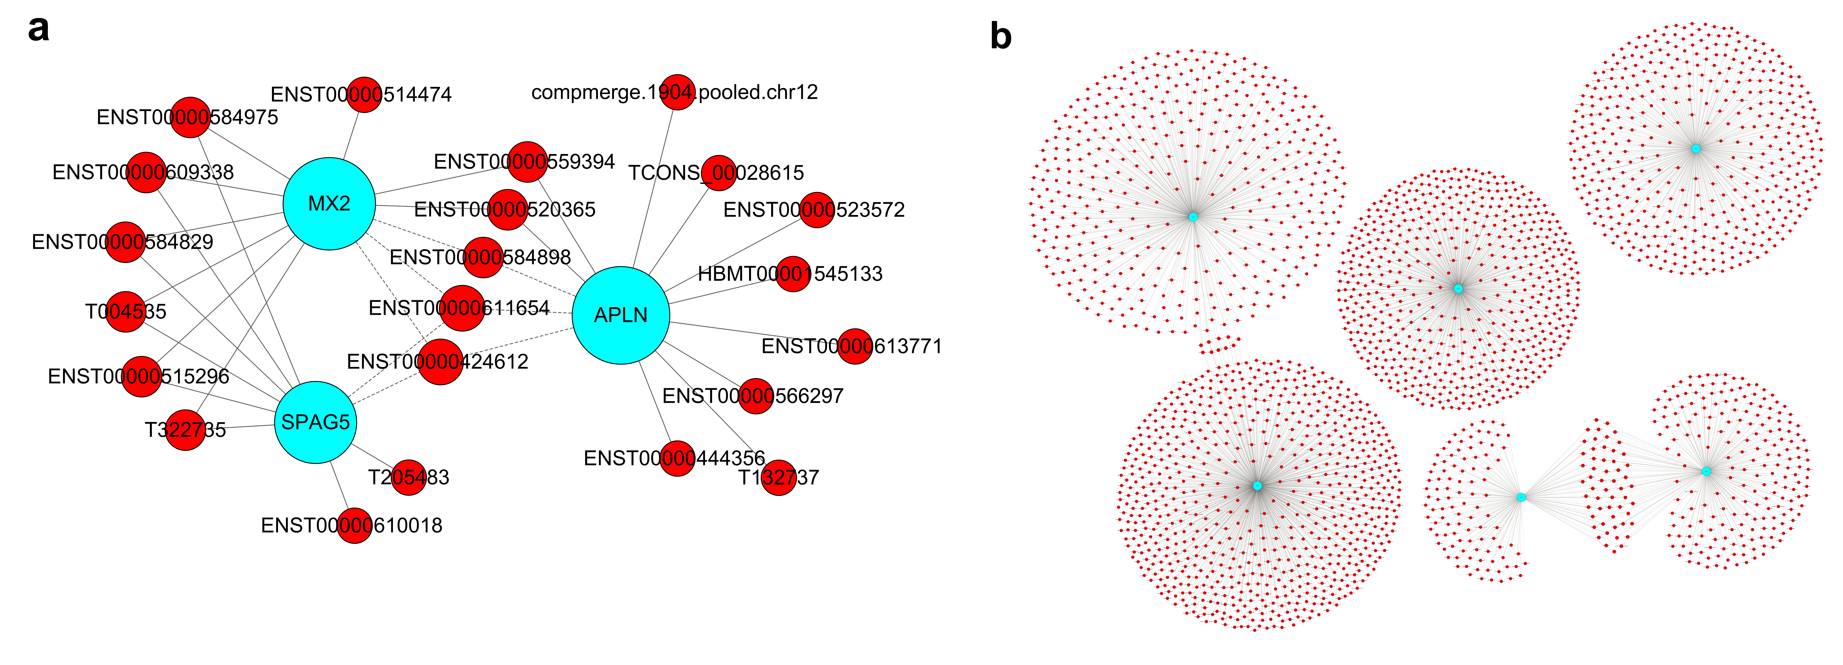
The GO project provides a controlled vocabulary to describe gene and gene product attributes in any organism (http://www.geneontology.org). The categories cover three domains: biological process, cellular component and molecular function. Fisher’s exact test in Bioconductor’s topGO was used to determine if there was more overlap between the DE list and the GO annotation list than would be expected by chance. The P-value produced by topGO denotes the significance of GO term enrichment in the DE genes. The lower the P-value, the more significant the GO term is (P-value ≤ 0.05 is recommended). A CNC network and mRNA target gene network were constructed to identify the interactions among genes and to locate core regulatory factors that played an important role in these networks.
2.3 Small interfering RNA (siRNA) knockdown of gene expression
DPSCs were transfected with an siRNA targeting lncRNA AC080037.1 and a nontargeting control (NC) siRNA (Dharmacon, Chicago, IL, USA). LncRNA AC080037.1 siRNA was diluted to the working concentration in RNase-free water. DPSCs were transfected with 25 nM siRNA using DharmaFECT Transfection Reagent (Dharmacon) according to the manufacturer’s siRNA transfection protocol. Briefly, cells were transfected with siRNA upon reaching 70–80% confluence. The effectiveness of siRNA knockdown was determined by quantifying the level of lncRNA AC080037.1 gene expression via real-time RT-PCR after 48 h. In addition, the cells were pretreated with lncRNA AC080037.1 siRNA at 25 nM for 48 h at 37°C prior to SDF-1α or BMP-2 stimulation to block lncRNA AC080037.1 expression in subsequent experiments.
2.4 RT‑qPCR
Total RNA was extracted using TRIzol reagent (TaKaRa, Bio, Inc., Shiga, Japan), and 1 μg of total RNA per sample was reverse transcribed into cDNA using a Prime Script RT reagent kit (TaKaRa). The expression levels of target genes were quantified through real-time RT-PCR using the SYBR Premix Ex Taq II kit (TaKaRa) and tested in an ABI 7500 Real-time RT-PCR System (Biosystems 7500 System, Foster City, CA, USA). The primers are shown in Table 2, and GAPDH was used as the housekeeping gene. All reactions were run in triplicate.
2.5 Cell transmigration assay
DPSCs (p3) were loaded in the upper chambers of 24-well 8-µm pore Transwell inserts (Corning, NY, USA) at 5×10³ cells/well. The following 4 groups were included: a control A group, in which the lower chamber contained only normal culture medium; a control B+SDF-1α group, in which the lower chamber medium was supplemented with 100 ng/mL SDF-1α; and NC siRNA and lncRNA AC080037.1 siRNA groups, in which DPSCs were preincubated with siRNA (100 ng/mL) (Sigma-Aldrich) for 24 h and then used in Transwell assays with 100 ng/mL SDF-1α in the lower chamber. After incubation for 24 h at 37°C, nonmigrated cells on the upper side of the Transwell chamber were removed, and cells that had transmigrated to the lower side were fixed with 4% paraformaldehyde and stained with 0.1% crystal violet for evaluation under a microscope. Five fields were randomly selected from each chamber and subjected to cell counting.
2.6 Alizarin Red staining and quantification
DPSCs were seeded in 12-well plates at a density of 1×10⁵ cells/well. These samples were divided into three groups. After growing to 80% confluence, the cells were transfected with siRNA according to the manufacturer’s protocol. The transfection medium was replaced with mineralizing medium after 48 h. The cells were pretreated with SDF-1α at 100 ng/mL for 2 h at 37°C before BMP-2 (100 ng/mL, PeproTech, Inc.) stimulation. Each group included 5 wells, and the medium was changed every 3 days. After 2 weeks, the cells were observed under a light microscope. For mineralization analysis, cultures were washed 3 times with PBS, fixed in 4% polyoxymethylene for 1 h, washed with distilled water 3 times, and then stained with Alizarin Red S (Sigma-Aldrich) (pH = 4.2) for 15 min at room temperature. The excess dye was removed by washing 5 times with distilled water; 0.5 mL of PBS was then added to each well, and images were acquired. To quantify Alizarin Red staining, we used 10% cetylpyridinium chloride (Sigma-Aldrich) to elute the stain and incubated it for 15 min. The stain was dissolved, and the concentration was determined by the absorbance at 562 nm as measured by a microplate reader (Power Wave 340, Bio-TEK, VT, USA).
2.7 Western blot analysis
DPSCs (p4) were seeded in 6-well plates and grown to 80% confluence at 37°C in a 5% CO2 incubator. The cells were transfected with siRNA as described above. At 3 and 7 days, the samples were lysed with RIPA buffer supplemented with protease inhibitors and subjected to ultrasonication at a low frequency. The supernatant containing the total protein was harvested after centrifugation, and the protein concentration was measured using a BCA protein assay reagent (Beyotime). Primary antibodies against CDC42, RhoA, RAC1/2/3, Runx-2 (1:1000, Cell Signaling Technology, MA, USA), DMP-1 (1:1000, Abcam), DSPP (1:1000, Santa Cruz Biotechnology) and GAPDH (1:3000, Cell Signaling Technology) were used according to the manufacturer’s instructions. Proteins were extracted, subjected to SDS-polyacrylamide gels and then transferred to 0.22 μm polyvinylidene difluoride (PVDF) membranes. The membranes were blocked in QuickBlock™ Blocking Buffer (Beyotime) for 1 h and incubated with primary antibodies at 4°C overnight. After being washed in TBST 3 times, the membranes were incubated with dilutions of the appropriate secondary antibodies for 1 h at room temperature, followed by incubation with an enhanced chemiluminescence kit (Bio-Rad, Hercules, CA, USA) for a few seconds. The resulting signals were captured using a ChemiDoc MP system (Bio-Rad) and Image Lab software (Bio-Rad). GAPDH was used as an internal control. The quantities of the phosphorylated proteins were calculated by normalizing the p-form to the total amount.
2.8 Statistical analyses
The lncRNA expression differences between different groups of cells were analysed using a two-sample t-test. Differences were considered significant at P<0.05. The data reported in this study are expressed as the mean ± standard deviation (SD) from at least three independent experiments. Statistical analysis was performed using SPSS Statistics 20.0 software. The statistical significance of the differences between two groups was analysed via one-way ANOVA at a significance level of P<0.05.