3.1 AgNPs Characterization
As can be seen from IR of PVP in Fig.1(a), the absorption peak at 3526 cm-1 corresponds to the -OH stretching vibration peak at the end of the polymerization chain in the dispersant PVP, which is attributed to the strong hydrophilicity of PVP[25]. The absorption peak at 2952 cm-1 represents the -CH2- stretching vibration peak of PVP, the absorption peak at 1655 cm-1 corresponds to the absorption vibration peak of C=O carbonyl group, the absorption peak at 1287 cm-1 is related to the antisymmetric and symmetric stretching vibration peak of C-N bond. It can be seen a significant change from Fig.1(a) compared the IR of the AgNPs modified by the dispersant PVP with the IR of the PVP. After modification, the absorption peak at 1655 cm-1 decreased obviously and has shifted to a lower wavenumber at 1603 cm-1, which ascribed to the establishment of Ag-O coordination bonds by arc pair electrons on oxygen atoms of PVP carbonyl and outer electron orbitals of Ag particles. The decrease and shift of the absorption peaks at 1655 cm-1 indicate that PVP has been successfully modified on the surface of AgNPs[26]. Obviously, the absorption peak of AgNPs modified by the PVP at 2952 cm-1 disappeared and the intensity of other absorption peaks decreased to some extent, which may be due to the black color of the prepared AgNPs. Because the intensity of the absorption peak was weakened attributed the black color during IR test and KBr powder compression[27].
It can be seen from the UV-vis of AgNPs in Fig.1(b) that the sample has an obvious characteristic absorption peak at 409.5 nm, which is the characteristic absorption peak of AgNPs[28]. The XRD spectra of as-prepared AgNPs is shown in Fig.1(c). Multiple diffraction peaks at 2θ = 38 °, 44 °, 64 °, 77 °, 81 °correspond to the faces of (111), (200), (220), (310), (222) (JCPDS No.87-0720) of face-centered cubic (fcc) type silver (zero valence state), respectively. It shows that silver is successfully prepared[29-30]. As can be seen from TEM in Fig.1(d), AgNPs are nearly spherical and uniformly dispersed without agglomeration. The average particle size was 14.07±2.93 nm, which is conducive to improve the effective contact area between AgNPs and cells, and make it play a strong antibacterial performance[31]. The XPS typical absorption peak of silver can be seen in Fig.1(e). The results of XPS show that the absorption peaks of 368.2 eV and 374.3 eV correspond to Ag0 of Ag3d3/2 and Ag0 of Ag3d5/2, respectively, with a difference of 6.0 eV. This proves that nano silver exists as silver with zero valence state instead of other silver compounds[32].
In conclusion, the results of Fig.1 suggest that AgNPs has been successfully prepared and dispersed uniformly.
3.2 Structural Analysis
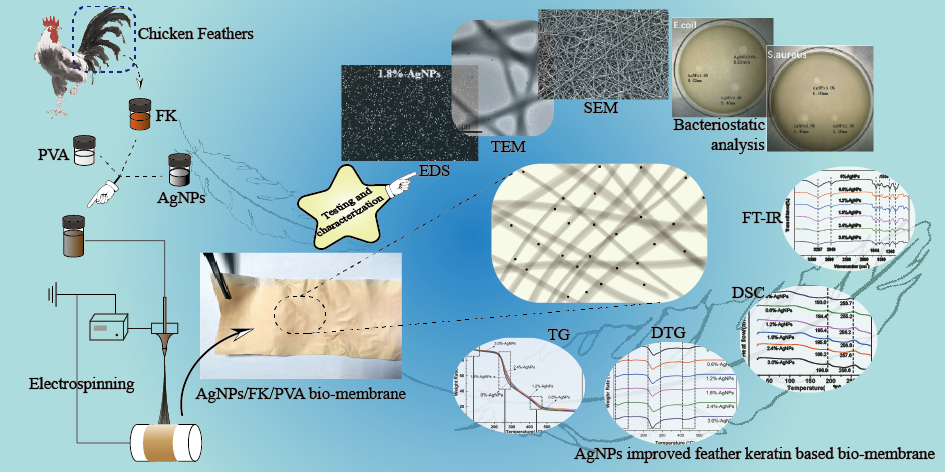
Fig.2 presents the TEM images of FK/PVA nanofibers membrane before and after AgNPs modification. Fig.2 (A) showed that the microstructure of FK/PVA nanofibers before AgNPs modification is uniform without any granular impurity, which indicated that FK and PVA had good compatibility. Compared with Fig.2 (A), small black Ag spots can be seen in the FK/PVA nanofibers membrane modified by AgNPs from Fig.2 (B). Because AgNPs is different from FK/PVA nanofibers membrane in composition, structure, and so on, which result to present different images under TEM. As can be seen from Fig.2, AgNPs particles were successfully modified in the FK/PVA nanofibers membrane.
Tab. 1 Average diameter of FK/PVA nanofibers membrane with different AgNPs contents
|
Samples
|
Average diameter(nm)
|
|
0 % -AgNPs
|
245.00±29.72
|
|
0.6%-AgNPs
|
148.35±37.16
|
|
1.2%-AgNPs
|
112.27±28.89
|
|
1.8%-AgNPs
|
100.11±16.39
|
|
2.4%-AgNPs
|
129.74±33.62
|
|
3.0%-AgNPs
|
150.34±41.46
|
Fig. 3 suggests the microstructure and the diameter distribution of FK/PVA nanofibers membrane with different AgNPs content. SEM images show that the integral morphology of nanofibers does not change significantly with the addition of AgNPs. It can be clearly seen from Tab. 1 that the diameter of nanofiber decreased gradually with the increase of the content of AgNPs. With the content of AgNPs upto 1.8 wt%, diameter of nanofiber was the smallest approaching to 100 nm. Whereas the diameter of nanofiber increased by raising the content of AgNPs continually. The conductivity of electrospinning solution can be improved by adding AgNPs. Lee Previous study[33] have shown that the increase of the conductivity of the spinning solution will bring more charges to the jet, and the fiber diameter will be smaller under the action of the electric field force. Therefore, with the addition of AgNPs, the average diameter of nanofibers gradually decreases.
But, when the amount of AgNPs is too much, the concentration of electrospinning solution decreases and the electrospinning solution spray out faster under high voltage, which cause solvent to evaporate slowly and the uniform nanofibers to be formed difficultly. As a result, the diameter of nanofibers becomes larger and the microstructure of nanofibers appears beads.
Fig. 4 shows the EDS of FK / PVA nanofiber membranes with different AgNPs contents. As can be seen from Fig. 4 (a) and (b), the EDS spectra are very similar, showing the expected C and O peaks. The Na peak and Au peak may come from the contamination of NaOH solution after dissolving FK powder and the gold spraying process of pretreatment in SEM test, respectively. It is obvious that there are Ag peaks of FK/PVA nanofibers membrane with adding AgNPs from Fig.4(b), showing that a clear evidence of Ag in nanofibers membrane and the weight fraction of silver is 0.23%. Many obvious bright spots can be observed from Fig. 4(c), indicating the existence of Ag element, and the silver nanoparticles are relatively evenly distributed in the nanofibers. These results are consistent with the TEM shown in Fig. 2.
In Fig. 5, the FT-IR spectra of FK, PVA and FK/PVA nanofibers membrane treated with different AgNPs content were collected. As can be seen from Fig.5 (a), typical adsorption bands of FK was detected[21]. The wide and broad adsorption band at 3418 cm-1 is known as amide A. The amide I band due to C=O stretching vibration were observed in the range of ~1700-1600 cm-1 and the sharp peak appears at 1648 cm-1. The amide II occur at 1549 cm-1 is related to N-H bending vibration. A peak falls at 1240 cm-1 is the characteristic adsorption peak of the amide III (1220-1300 cm-1) [34].
The absorption peak at 3418 cm-1 of FK/PVA nanofibers membrane slightly shifted to low wavenumber of 3297 cm-1 compared Fig.5 (a) with Fig.5 (b). This result indicated that the strong intermolecular hydrogen bond enhances the compatibility between FK and PVA and improves the spinnability of keratin. While the FT-IR spectra of FK/PVA nanofibers membrane with different AgNPs content are similar and the typical characteristic diffraction peaks does not change significantly in Fig. 5 (b). The results show that the addition of AgNPs does not react with the composition of the nanofibers membrane, but it is loaded or embedded in the nanofibers membrane.
3. 4 Thermal Analysis
Tab. 2 Thermogravimetric analysis data of FK/PVA nanofiber with different AgNPs contents
|
sample
|
Td(℃)
|
Tmax1(℃)
|
Tmax2(℃)
|
|
0%-AgNPs
|
194
|
249
|
433
|
|
0.6%-AgNPs
|
206
|
251
|
436
|
|
1.2%-AgNPs
|
210
|
253
|
438
|
|
1.8%-AgNPs
|
211
|
257
|
439
|
|
2.4%-AgNPs
|
213
|
260
|
442
|
|
3.0%-AgNPs
|
215
|
261
|
443
|
As can be seen from Fig. 6, the weight loss process of nanofibers membrane is mainly divided into three stages. The first stage with decomposition temperature of <100°C was ascribed to evaporation of water and the good hydrophilicity of PVA. The second stage with decomposition temperature of ~250°C may be caused by the decomposition of amino acid residues and the cleavage of peptide bonds in FK[35]. The third stage with decomposition temperature of ~430°C was owed to the thermal decomposition of nanofibers membrane. The thermal stability of nanofibers membrane was investigated by using the temperature of 10% mass loss of sample (Td) and the temperature of the fastest rate of thermal degradation (Tmax), which corresponding to Tmax1 and Tmax2 of two degradation stage in this study, respectively. The results are shown more clearly in Tab. 2. It can be seen that Td, Tmax1 and Tmax2 of FK/PVA nanofibers membrane with AgNPs were improved to a certain extent and gradually increased with the increase of AgNPs content. The results show that the addition of AgNPs increases the initial decomposition temperature of FK/PVA nanofiber membrane and improves the thermal stability of the nanofiber membrane to a certain extent, which is closely related to the good thermal stability of AgNPs.
Fig. 7 is the DSC analysis of FK/PVA nanofibers membrane with different AgNPs content. As can be seen from Fig. 7, the peak near 100 oC is caused by the evaporation of water[36], the peaks obtained at about 200 oC and 250 oC is the melting peak of PVA and endothermic peak of FK, respectively[37]. It can be seen that both the melting peak of PVA and endothermic peak of FK moved toward high temperatures after adding AgNPs to FK/PVA nanofibers membrane. And the temperature corresponding to the endothermic peak gradually increased with the increase of AgNPs content. The results suggest that the thermal stability of FK/PVA nanofibers membrane is enhanced after AgNPs modification, which can be attributed to the effect of AgNPs on the strength of hydrogen bond between FK and PVA, and then affects the thermal properties of nanofiber membranes. This result is agreed with TG/TGA analysis results shown in Fig. 6.
3.5 Mechanical Analysis
Tab. 3 Mechanical properties of FK/PVA nanofibers membrane with different AgNPs contents
|
sample
|
sb(MPa)
|
eb(%)
|
|
0%-AgNPs
|
3.05±0.19
|
30.00±3.61
|
|
0.6%-AgNPs
|
3.29±0.12
|
33.50±2.00
|
|
1.2%-AgNPs
|
4.07±0.26
|
38.17±5.39
|
|
1.8%-AgNPs
|
4.60±0.07
|
48.33±1.04
|
|
2.4%-AgNPs
|
3.44±0.17
|
43.00±5.50
|
|
3.0%-AgNPs
|
3.07±0.23
|
40.17±2.57
|
The mechanical properties of nanofibers membranes including tensile strength (sb) and elongation at break (eb) are shown in Table 3. It can be seen that the sb and eb of FK/PVA nanofibers membrane with no AgNPs are 3.05 MPa and 30.00%, respectively. The sb and eb of FK/PVA nanofibers membrane by adding AgNPs increase first and then decrease with amount of AgNPs increasing. When the content of AgNPs arrived at 1.8%, the sb and eb of nanofibers membrane reached the maximum, 4.60 MPa and 48.33%, respectively. Some of the stress of FK/PVA nanofibers membrane is absorbed and dispersed because of the addition of AgNPs, which enhanced and improved the sb and eb[38].
While the content of AgNPs exceeds 1.8%, the sb and eb decrease gradually, respectively. That may ascribe to the viscosity of electrospinning solution by adding a great deal of AgNPs. The viscosity of electrospinning solution decreased with the addition of AgNPs, and the degree of entanglement among the macromolecules in the electrospinning solution decreased which finally resulted the sb and eb degrading.
3.6 Bacteriostatic analysis
Tab. 4 Bacteriostatic effect of FK/PVA nanofibers membranes with different AgNPs content on Escherichia coli (E. coli) and Staphylococcus aureus (S. aureus)
|
sample
|
Diameter of E.coil bacteriostatic circle /mm
|
Diameter of S.aureus bacteriostatic circle /mm
|
|
0%-AgNPs
|
0
|
0
|
|
0.6%-AgNPs
|
6.03
|
3.60
|
|
1.2%-AgNPs
|
7.84
|
3.72
|
|
1.8%-AgNPs
|
8.02
|
4.46
|
|
2.4%-AgNPs
|
9.46
|
5.18
|
|
3.0%-AgNPs
|
9.53
|
6.03
|
Fig. 8 shows the bacteriostatic circle images of FK/PVA nanofibers membranes with various AgNPs content on Escherichia coli (E.coli) and Staphylococcus aureus (S.aureus). And the diameters of bacteriostatic circle of FK/PVA nanofibers membranes with various AgNPs content are clearly exhibited in Tab. 4. As can be seen from Fig. 8 and Tab. 4, there was no bacteriostatic circle in the culture medium of E.coli and S.aureus of FK/PVA nanofibers membrane without AgNPs, which indicated that FK/PVA nanofibers membrane had no bacteriostatic effect on E.coli and S.aureus. Adding AgNPs, there were obvious bacteriostatic circles in the culture medium of nanofibers membrane, which indicated that AgNPs had bacteriostatic effect on E.coli and S.aureus. The bacteriostatic effect of FK/PVA nanofibers membrane with AgNPs on E.coli was better than that of S.aureus from the comparison of the diameter of bacteriostatic circle. Because S.aureus is a kind of Gram-positive bacteria and have a denser cell wall and peptide layer, which is difficult to be destroyed by AgNPs[39-41].
The bacteriostatic effect of FK/PVA nanofibers membrane with AgNPs on E.coli and S.aureus were improved with the increase of AgNPs content, while the bacteriostatic effect of samples on E.coli was more obvious and significant than that of S.aureus. The diameter of bacteriostatic circle for E.coli and S.aureus of FK/PVA nanofibers membrane with adding 3.0 wt% AgNPs was 9.53mm and 6.03mm, respectively.
Tab. 5 Comparison of bacteriostatic effect of keratin-based nanofibers membranes modified by AgNPs between the present study and references
|
Reference
|
sample
|
Diameter of E.coil bacteriostatic circle /mm
|
Diameter of S.aureus bacteriostatic circle /mm
|
|
[18]
[20]
|
AgNPs/Keratin/ PU
AgNPs/Keratin/PA6
|
1.90
>1
|
3.10
>1
|
|
[24]
|
AgNPs/FK/PVA/PEO
|
8.60
|
2.96
|
|
this study
|
AgNPs/FK/PVA
|
9.53
|
6.03
|
Tab. 5 shows the comparison of bacteriostatic effect of keratin-based nanofibers membranes modified by AgNPs between the present study and references. It can be seen that the bacteriostatic performance of as-prepared FK/PVA nanofibers membrane with AgNPs in our study was best among the nanofibers membranes listed in Tab. 5 and it is promising for biomedicine materials.