1.1 Impact of platelet count during initial treatment
The relevant information and clinical indicators of the 301 newly-treated AML patients were collected (Table 1).
Table 1
Basic characteristics of primary AML patients(N = 301)
|
Characteristics
|
(%)
|
|
Age(year)
|
≦ 55
|
238(79.1)
|
| |
56–74
|
58(19.2)
|
| |
≥ 75
|
5(1.7)
|
|
Sex
|
Male
|
167(55.5)
|
| |
Female
|
134(44.5)
|
|
Risk
|
Low-risk
|
112(37.2)
|
| |
Medium-risk
|
54(17.9)
|
| |
High-risk
|
128(42.5)
|
| |
Unknown
|
7(2.4)
|
|
Hemorrhage
|
Yes
|
124(41.2)
|
| |
No
|
117(38.8)
|
|
Infected
|
One month before chemotherapy
|
122(40.5)
|
| |
During Chemotherapy
|
158(42.5)
|
| |
Six month after chemotherapy
|
48(15.9)
|
| |
No
|
3(1.1)
|
|
Chemotherap
|
High dose cytarabine
|
4(1.3)
|
| |
Low dose cytarabine
|
14(4.7)
|
| |
3 + 7 regimen
|
238(94.0)
|
|
Platelet reco
|
Yes
|
129(42.9)
|
| |
No
|
169(56.1)
|
| |
Unchanged
|
3(1.0)
|
|
Platelet trans
|
Yes
|
282(93.7)
|
| |
No
|
19(6.3)
|
|
Prognosis
|
Complete remission
|
166(55.1)
|
| |
Partial remission
|
39(13.0)
|
| |
No remission
|
79(26.3)
|
| |
Death
|
22(5.6)
|
The univariate analysis of leukemia remission and clinical indicators showed that bleeding in AML patients, platelet transfusion during chemotherapy, and platelet rise after chemotherapy are the factors that affect complete remission after chemotherapy (Table 2).
Table 2
Correlation between CR and clinical characteristics in AML patients
| |
Remission
|
|
|
|
Variables
|
No
|
%
|
Yes
|
%
|
X2
|
P
|
| |
(n = 135)
|
|
(n = 166)
|
|
|
|
|
Sex
|
|
|
|
|
1.414
|
0.234
|
|
Female
|
55
|
40.7
|
79
|
47.6
|
|
|
|
Male
|
80
|
59.3
|
87
|
52.4
|
|
|
|
Age
|
|
|
|
|
4.344
|
0.114
|
|
≦ 55
|
100
|
74.1
|
138
|
83.1
|
|
|
|
56–74
|
32
|
23.7
|
27
|
16.3
|
|
|
|
≥ 75
|
3
|
2.2
|
1
|
0.6
|
|
|
|
Risk
|
|
|
|
|
3.345
|
0.341
|
|
Low-risk
|
44
|
32.6
|
68
|
41
|
|
|
|
Medium-risk
|
23
|
17
|
31
|
18.7
|
|
|
|
High-risk
|
65
|
57.1
|
63
|
38
|
|
|
|
Unknown
|
3
|
2.2
|
4
|
2.4
|
|
|
|
Infected
|
|
|
|
|
3.468
|
0.325
|
|
One month before chemotherapy
|
57
|
42.2
|
61
|
36.7
|
|
|
|
During chemotherapy
|
38
|
28.1
|
56
|
33.7
|
|
|
|
Six month after chemotherapy
|
35
|
25.9
|
47
|
28.3
|
|
|
|
No
|
5
|
3.7
|
2
|
1.2
|
|
|
|
Hemorrhage
|
|
|
|
|
4.115
|
0.043
|
|
Yes
|
47
|
34.8
|
77
|
46.4
|
|
|
|
No
|
88
|
65.2
|
89
|
53.6
|
|
|
|
Platelet transfusion
|
|
|
|
|
4.555
|
0.033
|
|
Yes
|
122
|
90.4
|
160
|
96.4
|
|
|
|
No
|
13
|
9.6
|
6
|
3.6
|
|
|
|
Platelet recovery
|
|
|
|
|
41.483
|
0.001
|
|
Yes
|
79
|
58.5
|
150
|
90.4
|
|
|
|
No
|
56
|
41.5
|
16
|
9.6
|
|
|
|
Chemotherapy regimen
|
|
|
|
|
1.082
|
0.582
|
|
High dose cytarabine
|
2
|
1.5
|
2
|
1.2
|
|
|
|
Low dose cytarabine
|
70
|
51.9
|
96
|
57.8
|
|
|
|
3 + 7 regimen
|
63
|
46.7
|
68
|
41
|
|
|
The multiple regression analysis results showed a relationship between complete remission and clinical indicators. A logistic multiple regression analysis was performed using the associated factors screened in the above-mentioned single factor analysis. The results indicated that complete remission in AML patients caused the increase in platelets after chemotherapy. Besides independent risk factors, platelet increased after chemotherapy, and the patient prognosis was better (Table 3).
Table 3
Logistic multiple regression analysis of CR in AML patients
|
Variables
|
βcoefficient
|
OR(95%CI)
|
P
|
|
| |
Hemorrhage
|
|
|
|
| |
No
|
|
1
|
|
| |
Yes
|
0.442
|
1.556(0.935-2.59)
|
0.089
|
| |
Platelet transfusion
|
|
|
|
| |
No
|
|
1
|
|
| |
Yes
|
0.597
|
1.817(0.61-5.417)
|
0.284
|
| |
Platelet recovery
|
|
|
|
| |
No
|
|
1
|
|
| |
Yes
|
1.862
|
6.437(3.443-12.033)
|
<0.001
|
| |
Constant
|
-1.969
|
0.14
|
0.001
|
After a chemotherapy course, AML patients were divided into four groups based on platelet rise. Cox regression analysis was used to analyze the correlation between platelet rise and remission of AML patients after chemotherapy ( 49 days limit). (Fig. 1) The remission rate of AML patients increased with platelet rise after chemotherapy.
1.2 Cytogenetic/mutation effects at initial diagnosis
The patients were divided into the non-mutation group, FLT3-ITD positive mutation group, and other mutation groups based on gene mutation, and into high (> 40×10⁹/l) and low platelet groups (≤ 40×10⁹) according to the platelet count /l) for analysis. The FLT3-ITD positive mutation group had a more significant effect on the chemotherapy outcome than other mutation groups (p < 0.05). However, the FLT3-ITD positive mutation and low platelet coexistence had the worst chemotherapy outcome (p < 0.05). Besides, GeneCards (https://www.genecards.org/) indicated that the FLT3-ITD gene is associated with platelets and leukemia. Therefore, the association between FLT3-ITD mutations, platelets, and the factors affecting chemotherapy outcome was investigated.
2.1 Data quality assessment and DEG identification
Principal component analysis (PCA) and Heat map were used for probe pretreatment in the FLT3-ITD positive group (relative to the normal group) and the FLT3-ITD negative group (relative to the normal group) from the GSE12662 (Fig. 2A, 2B)to reveal the distribution of gene expression data in each group (Fig. 2C, 2D, 2E, 2F). The GEO2R online tool was used to detect 246 and 291 differentially expressed genes from the FLT3-ITD positive group and FLT3-ITD negative group (adj.P < 0.01, |logFC| >1). The volcano map was used to visualize the differentially expressed genes in the positive and negative groups (Fig. 3A and Fig. 3B). Venn analysis is performed on the differentially expressed genes in the positive and the negative. A total of 67 common differentially expressed genes were identified (Fig. 3C). A heat map was constructed to visualize the 67 differentially expressed genes (Fig. 3D). A PPI network of 62 differentially expressed genes was constructed to show potential gene interactions via the STRING database. Three gene sets were central genes, one set included MYH10, MYO5C, PLS3, PBX1, and MECOM, another set had VPREB1, RAG1, and VPREB3 and another set had LIMCH1 and TRIP6 (Fig. 4).
2.2 GO function and KEGG pathway enrichment analysis
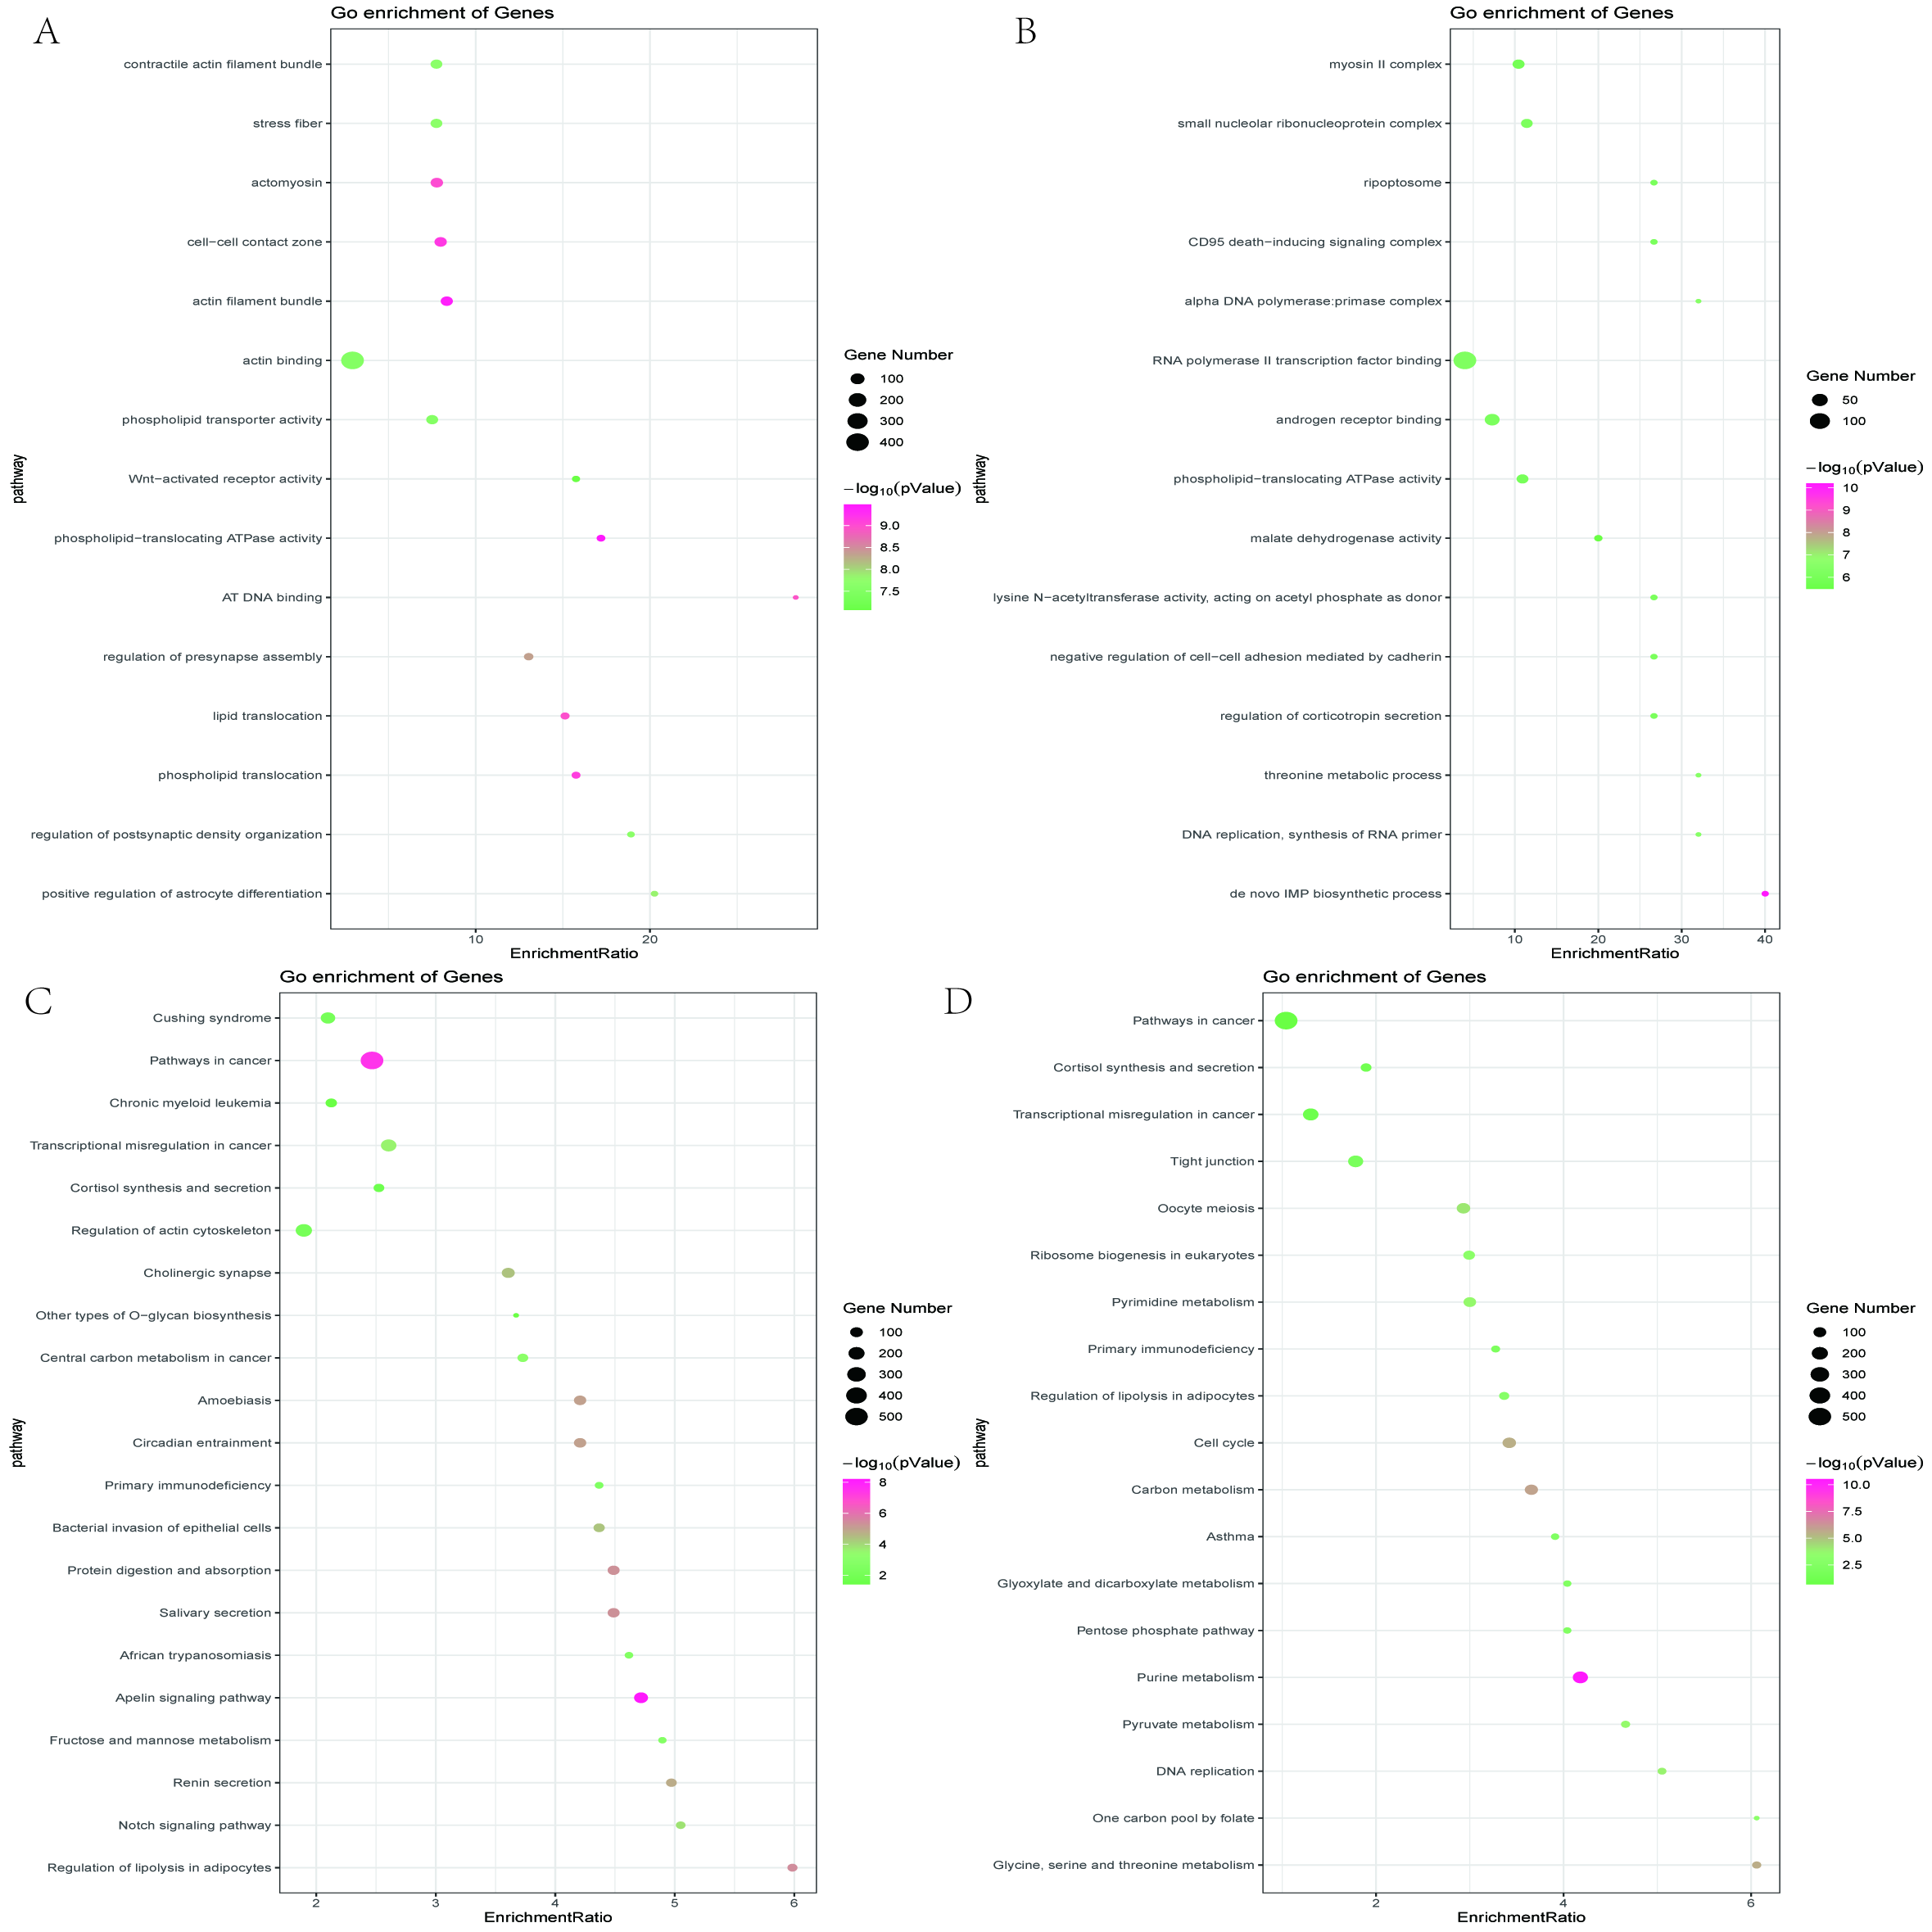
GO and KEGG enrichment analyses were performed using two array data to identify the most relevant biological processes (BP), molecular functions (MF), and cellular components (CC). The representative top 100 GO items were then extracted. The distribution of cellular components and molecular functions in the main branches of the ontology was in GO biological processes. The enrichment results showed that the 246 differentially expressed genes were positively regulated via astrocyte differentiation in BP, AT DNA in MF, actin filament bundles in CC. Furthermore, the Apelin signaling pathway in KEGG was the most enriched (Fig. 5A). The 291 differentially expressed genes were associated with the "de novo" IMP biosynthesis process in BP, the lysine N-acetyltransferase activity in MF, acting on acetyl phosphate as a donor, and the αDNA polymerase in CC: primer complex. The metabolic enrichment of glycine, serine, and threonine in KEGG was the most abundant (Fig. 5B).
The KEGG pathways of tumors or leukemia were screened for comparative analysis. A total of 13 KEGG pathways were identified in the two data sets, including two KEGG pathways, cancer pathways (MECOM, CDH1, IL12RB2), and transcriptional disorders in cancer (PBX1) (Fig. 5C, 5D, 5F). The GSEA method was used to reconfirm the KEGG results. Both the GSEA and the WebGestalt results showed cancer pathways (Table 4).
Table 4
Enrichment results of KEGG pathway by GSEA
| |
GS follow link to MSigDB
|
SIZE
|
ES
|
NES
|
NOM p-val
|
FDR q-val
|
FWER p-val
|
Rank at max
|
Leading edge
|
Rank
|
|
FLT3+
|
Pathways in cancer
|
319
|
0.29
|
1.36
|
0
|
0.356
|
0.93
|
2336
|
tags = 16%, list = 11%, signal = 17%
|
29
|
|
FLT3-
|
Pathways in cancer
|
319
|
-0.18
|
-0.89
|
0.709
|
0.762
|
1
|
4609
|
tags = 27%, list = 21%, signal = 34%
|
64
|
2.3 MYH10 protein can be used as a biomarker for changes in platelet numbers in acute myeloid leukemia
Venn analysis was used to analyze the related genes in the KEGG pathway. MECOM, CDH1, and IL12RB2 were the co-genes of cancer pathways, and PBX1 a co-gene of transcription disorders in cancer. (Fig. 5D, 5F). The PPI network showed that MECOM and PBX1 genes were grouped in MYH10.
Megakaryocytes (MKs) fragmentation forms platelets. The regulation of platelet production depends on the number and size of MKs. MK differentiates into polyploidy at a late stage to increase the cytoplasmic quality of each MK, resulting in huge cells 15–17. MK polyploidy is characterized by cytokinesis failure caused by defects in contractile force at the cleavage groove18. Immature MKs express two types of myosin II( myosin heavy chain IIA (MYH9) and myosin heavy chain IIB (MYH10)), while mature MKs only express myosin IIA19. During MK production, myosin IIB accumulates in the cutting groove instead of myosin IIA. However, during polyploidization, the MYH10 gene is silenced, and no myosin II accumulation occurs. MK doubling and maturation occur via RUNX1-mediated non-myosin heavy chain IIB (MYH10) silencing19. MYH10 expression is silenced during the doubling and maturation process due to the negative regulation of the MYH10 gene-mediated via RUNX1. Moreover, the RUNX1 gene knockout in MKs causes thrombocytopenia20. Therefore, MYH10 and RUNX1 are involved in MK doubling and platelet production.
MYH10 and RUNX1 assessment in STRING showed that they are related to MK doubling and platelet production. The GEPIA database was also used to compare MYH10, FLT3, and RUNX1 mRNA expressions in leukemic bone marrow (LAML) and normal bone marrow. The expression levels of FLT3 and RUNX1 were higher in leukemic bone marrow than normal tissues, while MYH10 expression was lower than normal bone marrow (Fig. 6).
In conclusion, MYH10 expression influences platelet production, indicating that MYH10 protein in platelets can be used as a marker to screen hematological malignancies related to RUNX1 gene changes, including familial platelet diseases, which tend to develop into acute myeloid leukemia (FPD / AML; OMIM 601399)21, primary or secondary AML and chronic myeloid leukemia (CML)22.
2.4 MYH10 causes thrombocytopenia and prognostic factors in acute myeloid leukemia via RUNX1 gene alteration
Bluteau23 compared the MKs between FPD/AML patients and healthy individuals and found that MYH10 mRNA was significantly increased in FPD/AML patients (P < 0.05). MYH10s were more in mature MKs of all FPD/AML patients compared with normal MKs. MYL9 and MYH9 expressions decreased, while MYH10 expression increased in FPD/AML MKs. However, the MYH10 protein was in the cytoplasm of mature MKs.Together with the Antony-Debré study24, RUNX1 knockdown is associated with megakaryocyte ploidy decrease and MYH10 expression increase in humans/mice. The MYH10 protein expression in the platelets of CML patients was examined. MYH10 protein expression was detected in the platelets of eight patients, and RUNX1 mutation in five of the eight patients. All patients with negative platelet MYH10 had negative RUNX1 mutation.
Interestingly, the platelet numbers in the eight CML patients were lower than other patients. Therefore, the GEPIA database was used to compare the effects of MYH10, RUNX1, and FLT3 genes on the OS prognosis. High FLT3 and low MYH10 expressions were associated with poor prognosis. RUNX1 did not affect the prognosis. A correction analysis between MYH10/FLT3 and MYH10/RUNX1 was also conducted. The low MYH10 expression was associated with a poor prognosis (Fig. 7).
Therefore, MYH10 causes thrombocytopenia in acute myeloid leukemia via RUNX1 gene alteration and influences prognostic factors. MYH10 variant detection improves the identification of AML molecular characteristics and its prognostic impact on AML.