Cold injury/injuries can range from minor chilblain to extreme form of frostbite. Cold injuries are pathologically a combination of ice crystal formation in tissue with inflammation, thrombosis and ischemia to extremities, necessitating limb amputation in extreme cases due to tissue necrosis. Less severe forms of cold injuries can be managed by gentle rewarming of limb and avoiding exposure to cold leading to favorable outcomes, however severe forms of frostbite are a cause of major concern to patients as well as the treating physician. Due to lack of effective pre-treatment modalities and paucity of research in prophylaxis and therapeutics of cold injuries, we have developed a novel-herbosomal loaded PEG-Poloxamer topical formulation (n-HPTF) by Quality by Designed approach, incorporating natural ingredients which are having potential therapeutic effect for the treatment of cold injury in a form of a novel-lipid vesicles (herbosomes) loaded in polymers (PEG-3350 and Poloxamer-188) resulting excellent occlusive barrier and thus promote rapid healing. Optimized novel-herbosomes showed entrapment efficiency > 90% and < 300 nm mean particle size and in-vitro drug permeation of about 2 µg/cm2 followed by Higuchi’s release kinetic. Skin irritancy study on female Sprague Dawley rats showed no edema or erythema. In-vivo bio-efficacy study was performed and found significantly good at p-value < 0.05 when compared to the standard treatment groups.
Research Article
Design and Optimization of a Novel-Herbosomal Loaded PEG-Poloxamer Topical Formulation For the Treatment of Cold Injuries: A Quality By Design Approach
https://doi.org/10.21203/rs.3.rs-895807/v1
This work is licensed under a CC BY 4.0 License
You are reading this latest preprint version
Novel-Herbosomal loaded PEG-Poloxamer Topical Formulation (n-HPTF)
Quality by Design
Skin Irritancy Study
Frostbitten-Wound Healing Study
Histopathology
Development of an optimal drug delivery system requires control of many critical parameters to ensure that the formulation of different batches remains uniform whenever it is produced. Quality control parameters in formulations containing herbal extracts are quite critical as compared to ones that contain synthetic molecule(s). Quality-by-Design (QbD) approach in pharmaceutical product development has been introduced by pharma regulatory authorities to build the basis for robust and effective product, with a statistically designed risk assessment and risk management parameters within a design space. A QbD should emphasize uniform built parameters for the analytical quality control as well as finished product. Design of experiments (DoE) for process design and development and process optimization are widely used in pharmaceutical product development [1–2, 58–59]. In this paper, we have designed and developed novel-herbosomal loaded PEG-Poloxamer topical formulation (n-HPTF) by QbD approach for formulation optimization by controlling the critical processing variables, entrapment efficiency, particle size, in-vitro drug permeation through skin and rheology. Vesicles prepared from natural polymer and lipid possess less shelf life and are stable mostly in refrigerated condition. To increase the shelf-life of herbosomes, we have incorporated a polymeric base containing excellent carrier for the model disease as well as this base increases shelf-life of the herbal pharmaceutical upon storage at room temperature.
Herbal pharmaceuticals are quite complex than the synthetic ones because finished product quality is dependent on the source and nature of the material. Thus, during selection and processing procedure of the herbal ingredients validation of each step is required for a maximum yield and quality product. Vogel (1982), defines Herbal medicinal products (Phytopharmaka) as those active substance(s), more (or) less enriched preparations of plant-derived constituents or whole extract, besides that, it may contain concomitant substances which exert or do not exert therapeutic activity. The WHO, 1992 defines pharmacopeia specification to standardized physical, chemical and physicochemical properties of herbal drugs/or their derivatives such as whole extract, fractionated extracts etc. to ensure quality of raw material on the behalf of following characterization parameters: (a) botanical name; (b) specification of the part used (as a herbal medicine intended to use); (c)macro and microscopic examination (d) morphological description with reference to standard reference; (e) determination of particle size distribution; (f) determination of extractable matter; (g) Determination of total ash or sulfated ash (residue on ignition) and acid insoluble ash; (h) determination of loss of water on drying or moisture content; (i) Determination of essential oils; (j) identification by thin layer chromatography; (k) quantitative determination of active constituents; (l) limit tests for heavy metals; (m) determination of pesticide residues.
A standard pharmaceutical concept with high rate of approvals of pharmaceutical products envisages Quality-by-Designed (QbD) for designing, developing and optimizing the processing variables for robust product. Guidelines dedicated to QbD are enumerated by International Conference of Harmonization (ICH) of ICH Q8 (R2) [1–2]. ICH defines quality as “the suitability of either a drug substance or drug product for its intended use”. Pharmaceutical manufacturing industries widely accept the concept of QbD to achieve an invariable product batch-to-batch by implementing the QbD relationship links of critical material attributes (CMAs) and critical quality attributes (CQAs) within a design space. The ICH Q8 guidelines defines ‘Design Space’ as ‘the multidimensional combination and interaction of input variables and process parameters that have been demonstrated to assure overall quality of the finished product’ (ICH, 2009).
Response surface methodology (RSM) is used to explore the relationship between independent (processing variables) and dependent variables (responses). A control and validated response of the process/product development can be achieved by Design of Experiment (DoE) by combination of factors and testing of each factor level with respect to their responses. To minimize many experiments run, time and cost of experiments, a statistical design of experiments following full factorial design, Box-Behnken design, central composite design etc. can be used [6–7].
A plethora of treatment options for critical diseases are available in herbal pharmaceuticals, and the efficacies of these herbal pharmaceuticals are based on their active constituents and combinations used. but this shows a wide range of variability between two similar crude material due to nature, origin, time of cultivation and harvesting etc. Thus, it become important to control CQAs of the herbal pharmaceuticals also [8–9]. Similarly, pharmaceutical formulations based on herbal pharmaceuticals exhibit batch-to-batch variation like change in pH, appearance, and sometimes efficacy too, hence it is recommended to validate the independent variable before processing of herbal pharmaceuticals.
The aim of this study was to optimize a novel-herbosomal loaded PEG-Poloxamer topical formulation (n-HPTF) used for the treatment of cold injury (both freezing and non-freezing) occurring at high altitude by employing QbD approach at each CQAs. The product efficiency and product critical attributes were measured at each stage to minimize the quality risk factors, leading to cost-effective finished product. This development includes process control step at each point of designing of n-HPTF for cold injury such as: percentage entrapment efficiency for herbosomes, particle size and zeta potential, with their independent variables like drug ratio and lipid ratio. On the other hand, optimization of final formulation i.e., n-HPTF was critically controlled in terms of selection of polymeric ratio, penetration enhancer etc., which had a significant role on rheological parameter sand in-vitro drug permeation. Finally, a stability study by using ICH guidelines for testing stability of the topical formulations intended for human use was carried out by chemical characterization.
Materials
Ascorbic acid; 2,2’-azio-bis-(3-ethylbenzothiazoline-6-sulphonic acid (ABTS); 2,2’-diphenyl-1-picrylhydrazyl (DPPH); Ferric chloride hexahydrate (FeCl3.6H2O); Folin-Ciocalteu Reagent; potassium persulphate; sodium nitroprusside; sodium hydroxide; sodium carbonate; ferrous sulphate; sodium phosphate; aluminum chloride; ammonium molybdate; tocopherol acetate; gallic acid;rutin trihydrate; L-α-Phosphatidylcholine; cholesterol; stearic acid; sorbitol; pro vitamin B5; PEG 3350; Poloxamer 188;Carbapol® 940;cetyl alcohol; xanthan gum; triethanolamine; Garcinia indica;Transcutol®; glycerol; tween-60 and PEG-200 was procured from Sigma Aldrich (St Louis USA). Solvents such as: methanol (HPLC grade) and chloroform (HPLC grade) are also procured from Sigma Aldrich (St Louis USA). Ultra-pure water with 18.2 MΩ resistivity was obtained by Milli-Q unit (Merck ELIX®) was used throughout the study wherever required.
The plant material was collected from different regions of India during (February-October, 2020) or procured from reputed herbal suppliers. The plant material was duly authenticated by a reputed Botanist and tested for the absence of heavy metals. Quality control methods for herbal materials as stipulated by WHO (2011) were strictly followed. Authentic specimens of the material have been maintained in the Department of Phytochemistry, Defence Institute of Physiology and Allied Sciences, Delhi, India. The plant material (Aloe barbadensis (leaf) (Aq.); Azadirachta indica (leaf) (Aq.); Curcuma longa (rhizome) (Aq.: Ethanol, 50:50 v/v); Camellia sinensis (leaf) (Aq.); Glycyrrhiza glabra (stem) (Aq.: Ethanol, 30:70 v/v); Arnica montana (Aq.: Ethanol, 50:50 v/v); and Calendula officinalis Aq.: Ethanol, 50:50 v/v) was extracted by homogenizer-assisted extraction method.
Homogenizer-assisted extraction of herbals
A homogenizer-assisted herbal extraction method was opted over conventional maceration method due to their high antioxidant capacities content extracts [10]. Other advantages of this method over convention method of extractions are: high yield extraction, less time consuming, less energy expenditure and reduces chances of any bacterial or fungal contamination. The extraction of herbal viz-a-viz Aloe barbadensis (leaf) (Aq.); Azadirachta indica (leaf) (Aq.); Curcuma longa (rhizome) (Aq.: Ethanol, 50:50 v/v); Camellia sinensis (leaf) (Aq.); Glycyrrhiza glabra (stem) (Aq.: Ethanol, 30:70 v/v); Arnica montana (Aq.: Ethanol, 50:50 v/v); and Calendula officinalis Aq.: Ethanol, 50:50 v/v) was carried out using GRAS solvents (water and ethanol) separately. Each extract was collected separately and filtered using muslin cloth and then further purified by using ultracentrifugation at 5000 rpm for 10 min at 40C (ROTA 4R-V/Fm Plasto Craft), further lyophilized by using (Allied Frost FD-5 lyophilizer). Lyophilized herbal extracts were collected and packed in an air-tight container, percent yield of each extract was calculated and kept for further analysis. Percent yield of the lyophilized extract was calculated by the formula given below:
Percent Yield = Actual Yield/ Theoretical yield × 100
Attenuated Total Reflection-Fourier Transform Infrared Spectroscopy (ATR-FTIR)
Fourier transform infrared spectroscopy analyses the infrared light from the light source passing through a Michelson Interferometer along with the optical light. The parallel polarized light affects the absorption by the sample which can be enhance by using polarizer. FTIR is dedicated to study the functional groups present in the sample with perpendicular to its dipole moment with respect to internal reflection metal. To study the functional groups present in the all-herbal extracts namely: Aloe barbadensis (leaf) (Aq.); Azadirachta indica (leaf) (Aq.); Curcuma longa (rhizome) (Aq.: Ethanol, 50:50 v/v); Camellia sinensis (leaf) (Aq.); Glycyrrhiza glabra (stem) (Aq.: Ethanol, 30:70 v/v); Arnica montana (Aq.: Ethanol, 50:50 v/v); and Calendula officinalis Aq.: Ethanol, 50:50 v/v), ATR-FTIR spectrophotometer (Bruker EQUINOX 55 FTIR spectrophotometer equipped with a liquid nitrogen cooled mercury cadmium telluride (MCT)) at room temperature (25±10C) with a equipped detector of nominal resolution of 2 cm for each spectra. For ATR reflection, a diamond is embedded with FTIR as an internal reflection element (IRE), placed at an angle of 450 and this scans each functional group 32 times to give one reflection, which is equivalent to resolutions. After successful spectral reading an advance ATR correction was applied to all spectra in the region lies from 4000 cm-1 to 400 cm-1, subsequently peak fitting was performed by using Opus software integrated with Bruker ATR-FTIR instrument [23].
Determination of total polyphenolic content and total flavonoid content
Total polyphenolic content in the herbal extracts was quantified by using Folin-Ciocalteu Reagent (FCR) adopted from Do et al., (2014) with some modification. Briefly, standard of gallic acid was prepared between concentration range of 5 µg/mL to 45 µg/mL to obtained a standard curve. Simultaneously, accurately weighed 1 mg of all test compounds [extracted herbals viz; Aloe barbadensis (leaf) (Aq.); Azadirachta indica (leaf) (Aq.); Curcuma longa (rhizome) (Aq.: Ethanol, 50:50 v/v); Camellia sinensis (leaf) (Aq.); Glycyrrhiza glabra (stem) (Aq.: Ethanol, 30:70 v/v); Arnica montana (Aq.: Ethanol, 50:50 v/v); and Calendula officinalis Aq.: Ethanol, 50:50 v/v)]was dissolved in 10 mL of Milli-Q water. After that each dilution of standard and test compounds were mixed with 1mL of FCR and kept aside for 5 min. of incubation in dark. Then 2 mL of sodium carbonate solution (20 %) was added to the above incubated mixtures and further kept aside for further 60 min. more. After a complete incubation time period, absorbance of each standard and test compounds was recorded at 750 nm wavelength using Jenway (6505) UV/Vis spectrophotometer. Experiments were carried out in triplicate and results were expressed in mg of gallic acid equivalents of per gram (GAE/g) of dry weight of extract (DWE) [11-12].
Total flavonoid content in the herbal extract was quantified by using aluminum chloride method described by Zhishen et al., (1999) with some modification. Briefly, a standard solution of rutin trihydrate (RT) between a concentration range of 10 µg/mL to 300 µg/mL in Milli-Q water to obtain a standard curve. Simultaneously, accurately weighed 1 mg of test compounds [extracted herbals like- Aloe barbadensis (leaf) (Aq.); Azadirachta indica (leaf) (Aq.); Curcuma longa (rhizome) (Aq.: Ethanol, 50:50 v/v); Camellia sinensis (leaf) (Aq.); Glycyrrhiza glabra (stem) (Aq.: Ethanol, 30:70 v/v); Arnica montana (Aq.: Ethanol, 50:50 v/v); and Calendula officinalis Aq.: Ethanol, 50:50 v/v)] was prepared in 1 mL of Milli-Q water. Then, In a 10 ml test tube, 0.5 mL of herbal extract solution, 0.5 mL of 30% methanol, 0.3 mL of NaNO2 (0.5M) and 0.3 mL of AlCl3.6H2O (0.3M) were mixed together and kept aside for 5 min. of incubation in dark and same procedure was followed for the standard solution. After 5 min. of incubation, 1 mL of NaOH (1 M) was added and then total volume was made up to 10 mL with Milli-Q water. Each sample in triplicate was recorded at the 510 nm wavelength by using Jenway (6705) Uv/Vis Spectrophotometer. The total flavonoid content in each extract was expressed as mg of rutin trihydrate equivalents per gram (RTE)/g of dry weight of extract (DWE) [11-14].
In-vitro antioxidant potential study
Antioxidant capacity is the overall capacity of extracts, food or antioxidative enzymes such as SOD (superoxide dismutase) Catalase, GPx (Glutathione peroxidase) Glutathione-S-transferase etc. to scavenge free radicals, which prevents generation harmful effects generated by these free radicals. Antioxidant potential study of herbal extract used in formulation, designed for the treatment of any disease, becomes necessary due to their protective efficacy for cells and cellular structure from harmful free radicals specially superoxide ions, nitrogen and hydroxyl ion. Antioxidant potential of extracted herbals was assessed by using in-vitro assays viz-a-viz: DPPH (2,2-diphenyl-1-picrylhydrazyl), FRAP (Ferric Reducing Antioxidant Power), ABTS (2,2’-azino-bis (3-ethylbenzothiazolin-6-sulfonic acid)), NO (Nitric Oxide) scavenging potential and TAC (Total Antioxidant Capacity).
Determination DPPH (2,2-diphenyl-1-picrylhydrazyl) radical scavenging activity
DPPH free radical scavenging activity of extracts was determined by 2,2-diphenyl-1-picrylhydrazyl (DPPH) chemical method described by Blois (1958) and Uddin (2008). The hydrogen donating capacity of the extracts leads to change in color of the DPPH solution from violet to yellow showing antioxidant activity in the given extracts. Briefly, in a 10 ml of test tube 0.1 mM methanolic DPPH (3 mL) and 0.2 mL of extracts (ranged from 0.5 mg/mL to 10mg/mL) was added, followed by vortex and kept aside in dark for 30 min. of incubation. Similarly, standard solution of ascorbic acid in the range of 10 µg/mL ton 100 µg/mL was taken as a reference potential for inhibition activity. After a 30 min of incubation at room temperature (250C), absorbance of each solution was recorded spectrophotometrically at 517 nm wavelength.
The percentage inhibition of DPPH free radical was calculated by following equation:
% I [DPPH Free Radical] scavenging potential = [(Ac-As)/Ac] x 100
Where Ac is absorption of control; As is absorption of extracts/standard.
The % inhibition of standard solution was plotted against concentration and an IC50 value was calculated from the graph. Results obtained from extracts were correlated with standard. Each value obtained from the reading was calculated from sample of each extract in triplicate.
Determination of FRAP (Ferric ion Reducing Antioxidant Power) activity
FRAP activity of the given extracts was determined by method reported by Benzie et al. (1996). Briefly, 1 mg/mL of each extract in Milli-Q water was taken in a test tube and 2.8 mL of FRAP solution [(300 mM acetate buffer (25 mL); 10 mM 2,4,6-trpyridyl-s-traizine (TPTZ) in 40 mM HCL (2.5 mL) and 20 mM FeCl3.6H2O (2.5 mL)] was added to it. To determine FRAP activity in the given extract a standard solution of Ferric sulphate was prepared in Milli-Q water and a concentration range of 50 µg/mL to 500 µg/mL was taken to plot a standard curve and incubated with FRAP solution. Each sample in triplicate was incubated in dark at room temperature (250 C) for 30 min. After which a standard plot was drawn and results were expressed in mg of ferrous (II) equivalent per gram dry weight of extracts (Fe (II)E/g of DWE).
Determination of ABTS (2, 2’-amino-bis (3-ethylbenzothiazoline-6-sulfonic acid) free radical scavenging activity
ABTS free radical activity was determined by ABTS+ radical cation decolorization (from bule/green stable cationic radical chromophore to colorless) by addition of antioxidant agents described by Re et al. (1999). ABTS+ cation radical was prepared by reaction mixture (1:1) of 7 mM ABTS in water and 2.45 mM of potassium persulfate in an amber color reaction mixture bottle and stored in dark for 12-16 hrs. before use. Before carrying out the experiments, ABTS+ solution was diluted with methanol to achieve an absorbance of 0.700 ±0.02 at 734 nm [19].
Briefly, 50 µL of plant extracts (1 mg/mL) was added to 3.995 ml of diluted ABTS+ solution, and set aside for 30 min. of incubation at room temperature (250 C) in dark. An absorbance was recorded at 734 nm in triplicates sample of each extract. Trolox was used as a standard in the range of 10 µg/mL to 200 µg/mL and Milli-Q water as a blank.
Calculation of ABTS+ value was done by using formula below [20]:
ABTS+ free radical scavenging capacity (µg TEAC/g DWE) = c ×V× t/m
Where, ABTS+ free radical scavenging capacity of the extracts was expressed in TEAC/g DWE (Trolox equivalent antioxidant capacity per gram of dry weight of extract). In which c is the Trolox concentration (µg/mL); V is the sample volume taken (ml), t is the dilution factor (if any), and m is the mass of the sample i.e., dry weight of extract in gram.
Determination of NO (Nitric oxide) scavenging potential activity
Nitric oxide scavenging potential of the extracts was measured by method reported by Hazra et al. (2008) with slight modification. Briefly, 1 mL of extracts (1 mg/mL) was mixed with 0.8 mL of 10 mM sodium nitroprusside solution prepared in phosphate buffer saline (pH 7.4) followed by incubation at 400 C in dark for 150 min. then added 1 mL of 0.33% sulphanilamide prepared in 20% glacial acetic acid and incubated again for 5 min. in dark at room temperature (250 C). Afterwards, 1 mL of 0. 1% of napthylethyenediamine dihydrochloride solution was added and further more incubated for 30 min. in dark at room temperature (250 C). After successive incubation of extracts with reagent a light pink color chromophore was developed, which was analyzed by using UV/Vis spectroscopy at 540 nm. Ascorbic acid (10 µg/mL to 100 µg/mL) was used as standard against test sample. Each sample was analyzed in triplicates.
The percentage inhibition of the nitric ion i.e., nitric oxide free radical was calculated by using formula described below:
% I [NO] free radical scavenging activity = [(Ac-As)/Ac] × 100
where, Ac is the absorbance of control and As is the absorbance of test samples/standards
Determination of Total Antioxidant Capacity (TAC)
Total antioxidant capacity of given extracts was quantify by phosphomolybdenum complex formation method described by Prieto et al. (1999). Phosphomolybdemum assay is based on reduction of Mo (VI) to Mo (V) by the given test samples (analytes) which subsequently form green phosphate /Mo (V) complex when it reached to acidic pH. This test was performed by taking 0.3 mL of given sample (1 mg/mL) in a test tube mixed with 3 mL of reducing reagent (0.6 M sulfuric acid, 28 mM sodium phosphate and 4 mM ammonium molybdate). Subsequently, samples were incubated at 950 C for 90 min. and kept aside for cool down at room temperature (250 C). All samples were analyzed in triplicates. Ascorbic acid in the concentration range of 10 µg/mL to 600 µg/mL was taken as a standard and a calibration curve was plotted against absorbance. The absorbance was recorded at 695 nm spectrophotometrically and results are expressed in mg of ascorbic acid equivalent per gram of dry weight of the extract ((mg AAE)/g of DWE)).
Preparation of novel-herbosomes (n-herbosomes)
Herbosomes are basically herbal-liposomes specially designed to enhance the bioavailability of the herbals so that they have targeted site of action. In this study, we have designed herbosomes by using conventional method of preparation i.e., thin film hydration (TFH) method of liposomes described by Bangham (1995) and Dave et al., (2017) with few modifications. The ratio of herbals (Curcuma longa (CL): Arnica montana (AM); lipid (L-α-Phosphatidylcholine); cholesterol; solvents (chloroform: methanol); surfactant (stearic acid); cryopreservant (sorbitol) and vehicle (phosphate buffer saline, pH 7.4) are depicted in Table 1. Method of optimization of n-herbosomes was done by employing response surface method analysis. Briefly, lipid, cholesterol, stearic acidand sorbitol were weighed accurately and dissolved in the solvent taken in round bottom flask (RBF), mixed thoroughly to obtained a clear lipid solution. Subsequently, Curcuma longa was added to lipid solution (oil/organic phase) and Arnica montana to PBS (aqeous phase). The organic phase was continuously rotated by using Rota evaporator (BUCHI Rotavapor® R-300) at 75 rpm and temperature 450 C to form a uniform and thin film. After a successive thin film formation, RBF was taken out and attached with vacuum pump to remove excess of organic solvent. After complete drying, flask was kept over dry ice bath and taken out before any cracks seen over film. After successful step of thin film formation, aqueous layer containing aqueous soluble ingredients was added drop-wise under continuous stirring at 300 rpm (too high or too low stirring rate may lead to generation of MLV (multilamellar vesicle)), for 24 h to forms n-herbosomes. n-herbosomes was then subjected to Prob sonication (PCI Analytics) using ice bath for each 5 min of sonication cycle and 3 min. of thawing to avoid any excess heat generation and lipid disruption. n-herbosmes was then successfully collected in vessels and used for further drug development.
Table 1 Formulation designing for optimization of n-herbosomes (n-H)
|
Batch no. |
n-H-01 |
n-H-02 |
n-H-03 |
n-H-04 |
n-H-05 |
n-H-06 |
n-H-07 |
n-H-08 |
n-H-09 |
|
Drug* (mg) |
75:50 |
100:50 |
125:50 |
75:50 |
100:50 |
125:50 |
75:50 |
100:50 |
125:50 |
|
Lipid** (mg) |
100:15 |
100:15 |
100:15 |
125:15 |
125:15 |
125:15 |
175:15 |
175:15 |
175:15 |
|
Solvents*** (ml) |
1:1 |
1:1 |
1:1 |
1:1 |
1:1 |
1:1 |
1:1 |
1:1 |
1:1 |
|
Stearic acid (mg) |
50 |
50 |
50 |
50 |
50 |
50 |
50 |
50 |
50 |
|
Sorbitol (mg) |
50 |
50 |
50 |
50 |
50 |
50 |
50 |
50 |
50 |
|
PBS pH 7.4 (ml) |
10 |
10 |
10 |
10 |
10 |
10 |
10 |
10 |
10 |
Drug*: (Curcuma longa: Arnica montana); Lipid**: (L-α- Phosphatidylcholine (95%): Cholesterol); Solvents***: (Chloroform: Methanol); PBS: (Phosphate Buffer Saline)
Incorporation of n-herbosomes into Polymeric base to form novel-herbosomal loaded PEG-Poloxamer topical formulation (n-HPTF)
Novel-herbosomal loaded PEG-Poloxamer topical formulation (n-HPTF) was prepared by fusion method. Briefly, oil phase containing PEG-3350, poloxamer-188, Garcinia indica, cetyl alcohol, stearic acid, and xanthan gum was fused with respect to their melting temperature in a decreasing order on a water bath at 600C and water phase containing Aloe barbadenesis, Azardichta indica, Camellia sinensis, Glycyrrhiza glabra, Calendula officinalis, pro-vitamin B5, acryl 10/30, PEG-200, Tween-60, Transcutol®, glycerol, triethanolamine was dissolved and warm up at 600C on water bath before mixing. After a complete fusion of oil phase, water phase was added to it slowly and stir continuously on water bath. After a homogenous mixing of both phase mixture was taken out from water bath and transfer to mortar. Mixture was mixed continuously by pestle when temperature of the formulation reached to 40-450C 10 ml of previously prepared n-herbosomes was added slowly and stirred properly until a smooth homogenous cream was obtained. Numbers of formulation was prepared by controlling processing variables and ingredients were weighed and mixed together as listed in Table 2. and further a final optimization was done by using QbD approach.
Table 2 Formulation designing for optimization of novel-herbosomalloaded PEG-Poloxamer topical formulation (n-HPTF)
|
Batch no. |
n-HPTF-01 |
n-HPTF-02 |
n-HPTF-03 |
n-HPTF-04 |
n-HPTF-05 |
n-HPTF-06 |
n-HPTF-07 |
n-HPTF-08 |
n-HPTF-09 |
|
n-herbosomes (ml) |
10 |
10 |
10 |
10 |
10 |
10 |
10 |
10 |
10 |
|
Aloe barbadensis (gm) |
30 |
30 |
30 |
30 |
30 |
30 |
30 |
30 |
30 |
|
Azadirachta indica (gm) |
0.5 |
0.5 |
0.5 |
0.5 |
0.5 |
0.5 |
0.5 |
0.5 |
0.5 |
|
Camellia sinensis (gm) |
2.0 |
2.0 |
2.0 |
2.0 |
2.0 |
2.0 |
2.0 |
2.0 |
2.0 |
|
Glycyrrhiza glabra (gm) |
3.5 |
3.5 |
3.5 |
3.5 |
3.5 |
3.5 |
3.5 |
3.5 |
3.5 |
|
Calendula officinalis (gm) |
1.5 |
1.5 |
1.5 |
1.5 |
1.5 |
1.5 |
1.5 |
1.5 |
1.5 |
|
Pro-vitamin B5 (mg) |
50 |
50 |
50 |
50 |
50 |
50 |
50 |
50 |
50 |
|
Tocopherol acetate (mg) |
200 |
200 |
200 |
200 |
200 |
200 |
200 |
200 |
200 |
|
PEG-3350 (gm) |
3.0 |
5.0 |
7.0 |
3.0 |
5.0 |
7.0 |
3.5 |
5.0 |
7.0 |
|
Poloxamer-188 (gm) |
2.5 |
2.5 |
2.5 |
5.5 |
5.5 |
5.5 |
10.5 |
10.5 |
10.5 |
|
Garcinia indica (gm) |
1.5 |
1.5 |
1.5 |
1.5 |
1.5 |
1.5 |
1.5 |
1.5 |
1.5 |
|
Carbapol® 940 (gm) |
0.5 |
0.5 |
0.5 |
0.5 |
0.5 |
0.5 |
0.5 |
0.5 |
0.5 |
|
Stearic acid (gm) |
2.5 |
2.5 |
2.5 |
2.5 |
2.5 |
2.5 |
2.5 |
2.5 |
2.5 |
|
Cetyl alcohol (gm) |
0.4 |
0.4 |
0.4 |
0.4 |
0.4 |
0.4 |
0.4 |
0.4 |
0.4 |
|
Xanthan gum (gm) |
0.15 |
0.15 |
0.15 |
0.15 |
0.15 |
0.15 |
0.15 |
0.15 |
0.15 |
|
Tween-60 (gm) |
0.3 |
0.3 |
0.3 |
0.3 |
0.3 |
0.3 |
0.3 |
0.3 |
0.3 |
|
Triethanolamine (gm) |
0.15 |
0.15 |
0.15 |
0.15 |
0.15 |
0.15 |
0.15 |
0.15 |
0.15 |
|
Transcutol® (ml) |
2.5 |
2.5 |
2.5 |
5.5 |
5.5 |
5.5 |
10.5 |
10.5 |
10.5 |
|
PEG-200 (ml) |
1.5 |
1.5 |
1.5 |
2.5 |
2.5 |
2.5 |
3.5 |
3.5 |
3.5 |
|
Glycerol (ml) |
5 |
5 |
5 |
5 |
5 |
5 |
5 |
5 |
5 |
|
Aqua (q.s.) (w/w) |
100 |
100 |
100 |
100 |
100 |
100 |
100 |
100 |
100 |
Design of experiment (DoE)
Design of experiment (DoE) plays an empirical tool for quality risk management (QRM) in pharmaceutical ICH guideline of ICH (Q9) including risk identification, risk analysis, risk evaluation and risk acceptance [26] which work within a define design space ICH (Q8) [27]. Response surface methodology (RSM) is a statistical and mathematical tool employee to access such critical attributes by justifying input of critical processing variables during product development [28-31].
In the present study, Box-Behnken full-factorial design (32) was used to study the critical variable (independent variable) affecting product development and their risk management by employing Statistica V.10 software (StatSoft, Inc. USA) [23, 32]. RSM study independent variables parameter affecting one or more dependent variable (s). we had applied RSM for the optimization of n-herbosomes as well as optimization of final formulation (n-HPTF). In herbosomes effect of independent variables as: X1: drug ratio (Curcuma longa: Arnica montana) and X2: lipid ratio(L-α-Phosphatidylcholine: Cholesterol) on Y1 (CL): percentage entrapment efficiency (%EE) of Curcuma longa; Y1 (AM): percentage entrapment efficiency (%EE) of Arnica montana and Y2:particle size (nm) was studied. After optimization of herbosomes, final formulation was prepared and their processing variables were also studied by using full factorial design in which independent variables were taken as: X1: polymer ratio (PEG-3350: Poloxamer-188) and X2: Penetration enhancer ratio (Transcutol®:PEG-200) and their effect was studied on most critical attributes (for herbosomes) in finished product of topical formulation i.e., Y1 (CL): in-vitro drug permeation Q (µg/cm2) of Curcuma longa; Y1 (AM): in-vitro drug permeation Q (µg/cm2) of Arnica montana Y2: Spreadability (mm). Tables 3, 4, and 5 summarize experimental run, their coded value and corresponding actual value and their subsequent responses. The responses were calculated by using quadratic equation given below:
Y = β1X1 + β2 X2 + β3 X3 + β12 X1X2 + β13 X1 X3 + β23 X2X3 + β11 X12 + β22X22+ β33X33
Y (responses) = b0 + b1X + b2Y + b3X2 + b4XY + b5Y2
Table 3 Coded levels for experimental design
|
Independent variables |
Coded levels |
|
0 -1 +1 |
|
|
Amount of drug (Curcuma longa: Arnica montana) mg |
75:50 100:50 125:50 |
|
Amount of lipid (L-α- Phosphatidylcholine: Cholesterol) mg |
100:15 125:15 175:15 |
|
Amount of polymer (PEG-3350) gm |
3.0 5.0 7.0 |
|
Amount of polymer (Poloxamer-188) gm |
2.5 5.5 10.5 |
|
Volume of penetration enhancer (Transcutol®:PEG-200) ml |
2.5:5 5.5:5 10.5:5 |
Table 4 Optimization of n-herbosomes by RSM
|
Batch Code |
X1 |
X2 |
Y1 (CL) |
Y1 (AM) |
Y2 (nm) |
|
n-H-01 |
0.00 |
0.00 |
59.84±1.39 |
60.86±1.02 |
240.1 |
|
n-H-02 |
-1.00 |
0.00 |
56.31±1.63 |
62.11±1.64 |
244.1 |
|
n-H-03 |
+1.00 |
0.00 |
74.14±0.26 |
66.17±1.02 |
278.0 |
|
n-H-04 |
0.00 |
-1.00 |
82.68±1.46 |
74.12±1.56 |
240.4 |
|
n-H-05 |
-1.00 |
-1.00 |
89.68±1.44 |
79.11±1.11 |
260.2 |
|
n-H-06 |
+1.00 |
-1.00 |
97.62±1.76 |
90.11±1.18 |
214.8 |
|
n-H-07 |
0.00 |
+1.00 |
87.14±1.44 |
77.14±1.74 |
285.5 |
|
n-H-08 |
-1.00 |
+1.00 |
84.46±1.82 |
79.02±1.46 |
274.5 |
|
n-H-09 |
+1.00 |
+1.00 |
82.80±1.14 |
77.79±1.14 |
280.1 |
- Independent variables: X1 (Drug ratio); X2 (Polymer ratio)
- Dependent variables: Y1 (CL) (%EE of Curcuma longa); Y1 (AM) (%EE of Arnica montana); Y2 (Particle size of n-herbosomes)
Table 5 Optimization of n-HPTF by RSM
|
Batch Code |
X1 |
X2 |
Y1 (CL) |
Y1 (AM) |
Y2 (mm) |
|
n-HPTF-01 |
0.00 |
0.00 |
0.14±0.07 |
0.29±0.08 |
7.0±0.07 |
|
n-HPTF-02 |
-1.00 |
0.00 |
0.12±0.12 |
0.29±0.17 |
7.7±0.07 |
|
n-HPTF-03 |
+1.00 |
0.00 |
0.69±0.18 |
0.33±0.09 |
6.1±0.01 |
|
n-HPTF-04 |
0.00 |
-1.00 |
0.22±1.12 |
0.22±0.14 |
5.0±0.14 |
|
n-HPTF-05 |
-1.00 |
-1.00 |
0.94±0.08 |
0.39±0.12 |
11.1±0.12 |
|
n-HPTF-06 |
+1.00 |
-1.00 |
1.14±1.10 |
0.42±0.14 |
10.1±0.01 |
|
n-HPTF-07 |
0.00 |
+1.00 |
0.29±0.09 |
0.26±0.14 |
5.2±0.01 |
|
n-HPTF-08 |
-1.00 |
+1.00 |
0.45±0.14 |
0.28±0.02 |
4.1±0.1 |
|
n-HPTF-09 |
+1.00 |
+1.00 |
0.86±0.01 |
0.39±0.17 |
4.5±0.01 |
- Independent variables: X1 (Polymer ratio); X2 (Penetration enhancer ratio)
- Dependent variables: Y1 (CL) (in-vitro drug permeation (Q) of Curcuma longa in mg/cm2); Y1 (AM) (in-vitro drug permeation (Q) of Arnica montana in mg/cm2); Y2 (Spreadability (mm)
Characterization of novel-herbosomes
Percentage entrapment efficiency (%EE) of novel-herbosomes
Percentage entrapment efficiency (%EE) of the designed herbosomes was quantified by analyzing the unentrapped drug (herbals) remains in the supernatant when exposed to a very high speed of centrifugation. Briefly, prepared herbosomes was subjected to ultracentrifugation at 14000 rpm at 40C for 15 min. using Thermo Scientific (SARVALL LEGEND MICRO 21R) centrifuge. The supernatant obtained from it was collected and unentrapped amount of drug was quantified by using UV/Vis spectroscopy at425.0 nm (Curcuma longa) and 345.0 nm (Arnica montana). each formulation was analyzed in triplicates and %EE was calculated by the formula given below:
% EE = [Actual loaded drug – Free Drug (unentrapped drug)/ Actual loaded drug] × 100
Particle size, polydispersitivityand zeta potential of novel-herbosomes
A controlled and uniform particle size is of the novel-herbosomes is indispensible due to very larger mass of the herbal extracts in comparison to synthetic drug with their precise molecular mass. Particle size (nm), polydispersity index (PDI) and zeta potential (mV) of prepared novel-herbosomes were characterized by using principle of dynamic light scattering (DLS) with Malvern Zetasizer Nano ZS (Malvern Instrument, UK)at fix angle of 900 at room temperature (250C) and standard experimental condition. Sample was diluted with de-ionized water before carrying out measurement and repeated trice for each sample at 15 cycle run. PDI is another characteristic of the herbosomes, a narrow range of PDI reveals about its homogenecity. Zeta potential reveals a charge (+ive/-ive) present over the surface of the particles which signify the stability of the particles upon long term storage. Theoretically, best range of zeta potential for vesicle is define above than value of +30 mV or -30 mV [33].
Characterization of optimized n-HPTF
Physical evaluation
Optimized n-HPTF-06was physically evaluated for their color, homogeneity, and apparent phase separation upon long term storage with respect to initial formulation phase.
pH of optimized nHPTF
pH of optimized n-HPTF-06 was measured by suing digital pH meter Thermo Scientific (EUTECH Cyberscan PC 300, pH/Conductivity/TDS/0C/0F meter). Briefly, 5 gm of optimized n-HPTF was placed in a clean beaker and allowed to equilibrate for 15 min. after keeping the reference electrode in the beaker. Triplicate measurement was carried out for an average pH value.
Rheological behavior
Standardized rheology is important for type of ailment to treat. To assess the rheological property of n-HPTF-0 to n-HPTF-09 a digital viscometer (make ATAGO, VISCOTM-895 Package B) at room temperature (250 C) was used. Briefly, 25 gm of the n-HPTF was placed in narrow head beaker and allowed to equilibrate for 15 min before recording the dial reading. Shear rate (sec-1) for optimized formulation was recorded in triplicate and an average value was plotted against viscosity (η).
Spreadability
Spreadabilty is another rheological parameter based on “slip” and “drag” characteristics of the optimized n-HPTF-06 by using a modified spreadability apparatus [34]. Briefly, 1 gm of the optimized n-HPTF-06 was placed (in a sandwich form) on glass plate (upper) having measurement (L×B) 10×4 cm was fixed with another glass plate (below) with same measurement and a graph paper embedded below it. Upper slide was fixed with thin string hooked with weighing pan along with a pulley. After that a constant weight with an increasing weight was placed over the pan and sliding of upper glass plate with respect to weight was measured and repeated trice. This gradual increase in slide of glass plate with respect to weight is calculated by the formula described below to know the spreadability [35] of n-HPTF.
S =M × L / t
Where M is the mass applied; L is the distance travelled by the glass plate with respect mass applied; and t is time in seconds (60 sec) taken by glass plate to move L (cm) distance.
Attenuated Total Reflection-Fourier Transform Infrared Spectroscopy (ATR-FTIR)
The ATR-FTIR spectra of optimized n-H-06 and its composition viz; (Curcuma longa, Arnica montana , L-α-Phosphatidylcholine, cholesterol, stearic acid as well as optimized n-HPTF-06 and its composition like (PEG-3350, poloxamer-188, Garcinia indica, cetyl alcohol, stearic acid, and xanthan gum, Aloe barbadenesis, Azardichta indica, Camellia sinensis, Glycyrrhiza glabra, Calendula officinalis, pro-vitamin B5, acryl 10/30, PEG-200, Tween-60, Transcutol®, glycerol, and triethanolamine was analyzed by using ATR-FTIR spectroscopy (Perkin Elmer FTIR Spectrum Two, UATR Two) equipped with a DynascanTM interferometer with a set of LiTaO3 (Lithium tantalate) MIR detector gives value in the range of 4000 cm-1 to 450 cm-1at best resolution of 0.5 cm-1 at room temperature (25 ± 10C). Peak fitting and analysis were done by in-built software “Spectrum” (Perkin Elmer IR Version 10.6.2),
In-vitro drug permeation (Q)
In-vitro drug permeation of the optimized n-HPTF-06 was obtained by using Franz’s diffusion cell (Orchid scientific six station diffusion cell, EMFDC 06, India) having 2.5 cm2 orifice diameter (total drug diffusion area). Briefly, pre-treated cellophane membrane (12000-14000 kDa) in 0.1 M HCl was used as a semi-permeable skin membrane. Weighed accurately 0.5 gm of the formulation (n=6) and applied over membrane and mount on Franz’s diffusion cell’s mouth (between donor and receptor compartment). Further receptor compartment was filled with phosphate buffer saline pH 6.8 and 10% ethanol to maintain sink condition at a stirring rate of 270 rpm at a set temperature of 37±10C maintained by continuous flow of water inside water jacket in the equipment. Samples were withdrawn by using injection equipped with instrument at 0, 0.5, 1, 2, 4, 6, 8 and 24 h and replaced by buffer to maintain a constant volume for release of drug throughout the process. filtered by using 0.45 µM syringe filter and measured using UV/Vis spectroscopy at 286.0 nm (Aloe barbadensis), 289.0 nm (Azadirachta indica), 425.0 nm (Curcuma longa), 302 nm(Camellia sinensis), 333.0 nm (Glycyrrhiza glabra), 345.0 nm (Arnica montana) and 287.0 nm (Calendula officinalis).In-vitro drug permeation rate was calculated by cumulative amount of drug released through a semi-permeable membrane from a specified surface area with respect to given time and represented graphically as Q (µg/cm2) versus time (h) [36-40].
Kinetic modeling
To study the kinetics of drug release from optimized n-HPTF-06, a set of mathematical release kinetic model as zero order kinetics (Eq. 1); first order kinetics (Eq. 2); Higuchi model (Eq. 3) and Korsmeyer-Peppas model (Eq. 4) was employed to assess the release of molecule from polymeric core/ matrix to the physiological buffer media[41-47].
Qt = Q0 + k0t (Eq. 1)
Log Qt = Log Q0 – (k1 /2.303) × t (Eq. 2)
Qt = kH t1/2 (Eq. 3)
Mt/M∞ = krtn (Eq. 4)
Where, in Eq. 1, Qt is the amount of drug present at absorption site at time t; Q0 is the initial amount of drug present in the buffer solution or physiological media and in most of the cases this remain zero; k0 is the constant for zero order kinetics.
In Eq. 2, Qt is the amount of drug dissolved at time t; Q0 is the initial amount of drug present in the buffer solution or physiological media; and k1 is constant for first order kinetics.
In Eq. 3, Qt is the amount of drug present in the media released from core/matrix of the polymer at given time t; and kHis the constant for Higuchi model [45].
In Eq. 4, Mt/M∞ represents the fraction of drug released at time t, kris the release constant which is characteristics to the polymer-drug interactions, power n is the diffusion exponent characteristic to the release mechanism [47].
When (i) n =0.5, equation become equal to Higuchi model indicates that release mechanism is of Fickian type of release, (ii) n= 0.5 to 1.0, suggested release corresponds to an anomalous i.e., non-Fickian type of drug transport to the release media, (iii) n= 1.0, indicates release kinetics of drug is of zero-order kinetics, (iv) n >1.0 suggested that release of drug is process dependent which rely on the number of polymeric chains in the given drug matrix [41].
Stability study
Stability study of the optimized n-HPTF was performed by using ICH guidelines (ICH Q1 A (R2)) for long term stability study of the topical pharmaceuticals for a given period of six month at temperature (50C ± 30 C and 300 C ± 20 C) and percentage relative humidity (% RH) (65% ± 5%) using stability chamber (M.K. Scientific instruments, M.K SI-142-B) [50]. The formulation was observed subsequently at 0, 30, 60, 90, 120 and 180 days for color, texture, pH, spreadability and phase separation (if any) and furthermore evaluated by using ATR-FTIR spectroscopy for any physicochemical incompatibility after long term stability study.
In-vivo study
Experimental animals
Throughout the study protocol animal handling was performed within the prescribed guidelines given by CPCSEA (Committee for the Purpose of Control and Supervision of Experiments on Animals) and experiment approved by IAEC (Institutional Animal Ethical Committee) of Defence Institute of Physiology and Allied Sciences (DIPAS), DRDO, India, with approval number DIPAS/IAEC/2019/Dec-03.Animals were acclimatized prior to study for the 7 days before carrying out experiments upon standard laboratory condition (25 ± 10 C) followed by 12-hour light/dark cycle receiving water and food ad libitum.
Skin irritancy study of optimized n-HPTF
Skin irritancy study of the optimized n-HPTF-06 was performed by selecting healthy young adult female Sprague-Dawley rats (nulliparous and non-pregnant) weighing 174-180 gm. In this study female rats were selected due to their high sensitivity to any chemical/others treatment [48]. The rats were acclimatized after grouping for at least 7 days before performing experiments. Approximately 24 h, before carrying out experiments, animals were anesthetized by giving cocktail of Ketamine (90 mg/kg B.W.) and Xylazine (9.1 mg/kg B.W.) and dorsal hair of the rats was shaved by using electrical trimer for cattle use. Acute dermal toxicity of n-HPTF was performed as per prescribed OECD guidelines for acute dermal toxicity (402) [49]. Briefly, 1 gm of the optimized n-HPTF was applied over the dorsal skin of the rats (4 x 2.5 cm2) and observed for any visible changes such as erythema at 1h, 6h, 24h, and 72 h after application. The mean erythema scores were recorded by using range between 0-4 at arbitrary scale depending upon the degree of erythema after application categories as: (i) no erythema = 0; (ii) Slight erythema (barley, light pink skin) = 1; (iii) moderate erythema (dark pink) = 2; (iv) moderate to severe erythema (dark pink) = 3; and (v) severe erythema (extreme redness) = 4 scores.
Preparation of skin before induction of frostbite
Before induction of frostbite injury on the skin of the rats, skin preparation was carried out to suitably perform the experiments. Twenty-four hours before the experiment, rats were individually anaesthetized by using a cocktail of Ketamine (90 mg/kg B.W., i.m.) and Xylazine (9.1 mg/kg B.W., i.m.). Thereafter, the dorsal skin of the rats covering from basal region of neck to the rear haunches was shaved a using trimmer (WAHL® Battery Trimmer), whereas small hair left behind on the skin were not further removed by application of any hair remover to mimic the actual skin condition (as hair appendages can act as a skin barrier to topical drug delivery system) [60]. After trimming, the skin was gently wiped with isopropyl alcohol and the animals were housed again in cages.
Induction and validation of frostbite model using Sprague-Dawley rats
Induction of frostbite on the skin of rats was carried out by the method previously described by Auerbach et al., (2014) with slight modification. Briefly, after twenty-four hours of skin preparations, rats were anesthetized by using a cocktail of Ketamine (90 mg/kg B.W., i.m.) and Xylazine (9.1 mg/kg B.W., i.m.) and frostbite was created by using Ferrite magnet having diameter 1.29 cm, thickness 0.56 cm and weigh 2.9 gm. Two magnets of the same diameter were placed in crushed dry ice (-800±20 C) for fifteen minutes and then placed on the skin of the rats by slightly sliding skin in upward direction for a duration of 1 minute. The magnet was then removed and the skin was allowed to thaw for 5 minutes and the freeze-thawed cycle was repeated thrice with a freezing cycle interval of 5 minutes. Within two minutes of frostbite induction, skin of the animal appears bluish in color, which is an indication of the first sign of frostbite i.e., cold injury. The model was further validated by continuous observation for change in skin color, which was followed upto 3 days and it was observed that the exposed skin was completely darkened.
Study design and dosing
The experimental design constituted of grouping of the animals in subcategories for a comparative analysis of therapeutic efficacy of n-HPTF with a standard formulation. For these animals were grouped into three groups (n=12 each) viz; (i) Group I: Frostbitten (untreated); (ii) Group II: Frostbitten + Standard formulation (ALOCAL); (iii) Group III: Frostbitten + treatment (n-HPTF). About 0.5 gm of the standard drug and formulation were applied to the animals daily based on the groups assigned. The animal tissue was harvested (n=2) at 0, 3, 7, 14, and 21 days for histopathological examination, as well as for the biochemical assays and markers-based studies.
Morphometric analysis of frostbitten wound area
Following induction of cold injury exposure achieved by ferrite magnet pre-frozen in dry ice, morphometric analysis aimed at studying the diameter of the darken skin with and without treatment. In skin wound condition a precise there wound appears after exposure to validated wound model, but in case of cold-injury the diameter of affected area is directly proportional to the cytokine response and individual’s body pathophysiological response, thus it becomes necessary to carry out morphometric analysis as a routine basis to assess the changes in the received treatment groups and control groups. This analysis was carried out by the method described by Vaghasiya et al., (2019) where routine measurement of the frostbitten area was done with the help of Vernier caliper until complete healing of the cold-injured area. Percentage area (contracted wound) is calculated by the formula given below:
Frostbitten Wound Contraction (%) 
Histopathological study
The histopathological observation was made by harvesting the animals (n=2) 0, 3, 7, 14 and 21 days under euthanasia condition by using high dose of anaesthesia (Ketamin HCL/ Xylazin , 100 mg/mL). The cold injured skin tissue was wiped with sterile swabs and then excised and the affected area was washed with phosphate saline buffer (pH 7.4) and further fixed in 10% buffer formalin solution. For histological studies, the excised formalin-fixed tissue was embedded in paraffin blocks by opting the routine tissue embedding procedure. Briefly, the fixed tissue sample was dehydrated first by using graded concentration of ethanol and then in xylene and further embedded to the pre-fixed paraffin blocks. The section was cut for the thickness of 5 μm by using standard microtome. After obtaining the tissue sections, it was rehydrated before following the haematoxylin and eosin (H&E) staining protocol. The stained tissue was further observed under optical microscope (LMi EA #LM061, Fisher Scientific, USA).
Homogenizer-assisted extraction of herbals
Homogenizer-assisted extraction technique was used to extract the herbals used in the development of the n-HPTF-06 and the percentage yield of the extracted herbals was found as: Aloe barbadensis (leaf) (Aq.) whole extract; Azadirachta indica (leaf) (Aq.) 16.37%; Curcuma longa (rhizome) (Aq.: Ethanol, 50:50 v/v) 11.37%; Camellia sinensis (leaf) (Aq.) 11.33%; Glycyrrhiza glabra (stem) (Aq.: Ethanol, 30:70 v/v) 7.01%; Arnica montana (Aq.: Ethanol, 50:50 v/v) 9.26%; and Calendula officinalis Aq.: Ethanol, 50:50 v/v) 15.22%.
Attenuated Total Reflection-Fourier Transform Infrared Spectroscopy (ATR-FTIR)
ATR-FTIR spectroscopy was used to characterized the prominent functional groups present in the extracted herbals which can be further used as a quality control parameter for a final form of formulation. The spectra of all herbals are depicted in Fig. 1. Characteristic ATR-FTIR spectra of Aloe barbadensis was at 3932.14 cm-1 showing sharp O-H free alcohol (stretching), 3851.00 cm-1 wide O-H (stretching), 2360.69cm-1 due to O=C= O group (stretching), 1782.60 cm-1 due to C=O anhydrous (stretching) and 1733.14cm-1 due to N-O nitro compound (stretching). In Azadirachta indica characteristic peaks were at 3744.51cm-1 showing medium O-H (stretching), 3113.13 cm-1 weak O-H carboxylic group (stretching), 2368.58 cm-1 strong C=O primary (free, stretching), 1557.07cm-1 due to N-O (stretching) and 1409.72 cm-1 medium S=O (stretching). In Curcuma longa characteristics peak were found at 3740.75cm-1 strong O-H, alcohol (stretching), 2425.99 & 2331.65 cm-1 strong C=O-H (stretching), 1688.8cm-1 strong C-H aromatic alkyl (bending) and 1549.75 cm-1 medium C=C cyclic alkenes (stretching). In Camellia sinensis the characteristic peaks were identified as 3226.44cm-1low O-H (stretching), 2967.94cm-1 C-H (stretching), 1605.53cm-1 α-β-unsaturated ketone (stretching), 1236.66cm-1 C-O alkyl aryl ether (stretching), 1144.55cm-1 C-O alcohol (stretching) and 1035.89cm-1 CO-O-CO (stretching). In Glycyrrhiza glabra characteristic peaks lies at 3743.63 cm-1 medium O-H free alcohol (stretching), 3546.22 cm-1 strong O-H intermolecular bonded alcohol (stretching), 1520.55 strong N-O nitro compound (stretching), 1416.60cm-1 O-H (bending), 1228.99cm-1 strong C-O aromatic (stretching) and 1040.50cm-1 strong CO-O-CO anhydride (stretching). In Arnica Montana the characteristics peak were found at 3326.71cm-1 medium O-H (stretching), 2977.36cm-1 strong C-H aldehyde (stretching), 1647.69cm-1 strong C=C monosubstituted alkene (stretching), 1387.42cm-1 medium C-H Gem dimethyl (bending), 1325.94 cm-1 O-H phenol (bending) and 1085.17 cm-1 strong C-H (stretching). In Calendula officinalis prominent peaks were identified at 3276.90cm-1 strong O-H (stretching), 2980.22 cm-1 weak O-H (stretching), 2133.41 cm-1 strong C=C=O ketone (stretching), 1645.58cm-1 C=O δ-lactone (stretching), 1416.82cm-1 medium O-H (bending), 1326.60cm-1 O-H phenol (bending), 1084.71cm-1 strong C-O (stretching), 1043.04cm-1 strong CO-O-CO anhydride (stretching) and 871.77cm-1 strong C-H 1,3-disubstitued (bending).
Determination of total polyphenolic content and total flavonoid content
Total polyphenolic content and total flavonoid content of the extracted herbals was quantified by using Folin-Ciocalteu Reagent (FCR) and aluminum chloride method respectively, analyzed by UV/Vis spectrophotometrically. Total polyphenolic compounds at 0.1 mg/mL of Aloe barbadensis (leaf) (Aq.); Azadirachta indica (leaf) (Aq.); Curcuma longa (rhizome) (Aq.: Ethanol, 50:50 v/v); Camellia sinensis (leaf) (Aq.); Glycyrrhiza glabra (stem) (Aq.: Ethanol, 30:70 v/v); Arnica montana (Aq.: Ethanol, 50:50 v/v); and Calendula officinalis Aq.: Ethanol, 50:50 v/v) was found as 2.43±0.04, 2.26±0.21, 2.85±0.22, 27.05±0.06, 15.44±0.15, 2.78±0.11 and 11.18±0.11 GAE of g/DWE respectively. Total flavonoid content of Aloe barbadensis (leaf) (Aq.); Azadirachta indica (leaf) (Aq.); Curcuma longa (rhizome) (Aq.: Ethanol, 50:50 v/v); Camellia sinensis (leaf) (Aq.); Glycyrrhiza glabra (stem) (Aq.: Ethanol, 30:70 v/v); Arnica montana (Aq.: Ethanol, 50:50 v/v); and Calendula officinalis Aq.: Ethanol, 50:50 v/v) was found as 6.66±0.03, 7.30±0.02, 2.83±0.01, 52.50±0.04, 46.41±0.03, 7.12±0.11 and 14.72±0.07 RTE of g/DWE respectively. The maximum content of both polyphenolic and flavonoid groups was present in Camellia sinensis and Glycyrrhiza glabra. Results were statistically analyzed by employee one-way ANOVA using Tukey’s multiple comparison test and are also depicted in Table 6.
Table 6 Total Polyphenolic content and Total Flavonoid content in the homogenizer-assisted extracted herbals
|
Parameters |
Aloe barbadensis (Aq.) |
Azadirachata indica (Aq.) |
Curcuma longa (Aq.: Ethanol, 50:50 v/v) |
Camellia sinensis (Aq.) |
Glycyrrhiza glabra (Aq.: Ethanol, 30:70 v/v) |
Arnica montana (Aq.: Ethanol, 50:50 v/v) |
Calendula officinalis Aq.: Ethanol, 50:50 v/v) |
|
Total Polyphenolic content (mg GAE/g of DWE) |
2.43±0.04$ |
2.26±0.21#$ |
2.85±0.22*# |
27.05±0.06*# |
15.44±0.15*# |
2.78±0.11$ |
11.18±0.11*# |
|
Total Flavonoid content (mg RTE/g of DWE) |
6.66±0.03$ |
7.30±0.02$# |
2.83±0.01$ |
52.50±0.04*# |
46.41±0.03*# |
7.12±0.11#$ |
14.72±0.07*# |
Total polyphenolic content and total flavonoid content of extracted herbals are expressed as the mean±SEM (n=3) by standards as GAE i.e., Gallic acid equivalent and RTE i.e., Rutin trihydrate equivalent capacity of DWE i.e., Dried weight of the extract.
One-way ANOVA using Tukey’s multiple comparison test statistic is used and with p value as p<0.001(*); p<0.01(#) and p<0.05 ($).
In-vitro antioxidant potential study
Determination DPPH (2,2-diphenyl-1-picrylhydrazyl) radical scavenging activity
DPPH free radical scavenging activity of the extracted herbals was performed by using DPPH assay. Percentage inhibition of each extract was calculated and plotted against concentrations (0.5, 1.0, 2, 4, 6, 8 and 10 mg/mL) and then IC50 value of each extract was calculated from graph as represented in Table 7. IC50 value of extract namely: Aloe barbadensis (leaf) (Aq.); Azadirachta indica (leaf) (Aq.); Curcuma longa (rhizome) (Aq.: Ethanol, 50:50 v/v); Camellia sinensis (leaf) (Aq.); Glycyrrhiza glabra (stem) (Aq.: Ethanol, 30:70 v/v); Arnica montana (Aq.: Ethanol, 50:50 v/v); and Calendula officinalis Aq.: Ethanol, 50:50 v/v) was found as 1.11±0.16, 2.14±0.11, 1.72±0.17, 7.81±0.14, 2.56±0.11, 2.23±0.17 and 0.93±0.02 respectively. Results were statistically analyzed by one-way ANOVA followed by Tukey’s multiple comparison test. The order of free radical DPPH scavenging activity of the extract was Camellia sinensis>Glycyrrhiza glabra> Arnica montana>Azadirachta indica> Curcuma longa> Aloe barbadensis> Calendula officinalis.
Determination of FRAP (Ferric ion Reducing Antioxidant Power) activity
The FRAP reducing activity of the extracted herbal was performed and expressed in Fe (II) E/g of DWE as depicted in Table 7. FRAP reducing activity of Aloe barbadensis (leaf) (Aq.); Azadirachta indica (leaf) (Aq.); Curcuma longa (rhizome) (Aq.: Ethanol, 50:50 v/v); Camellia sinensis (leaf) (Aq.); Glycyrrhiza glabra (stem) (Aq.: Ethanol, 30:70 v/v); Arnica montana (Aq.: Ethanol, 50:50 v/v); and Calendula officinalis Aq.: Ethanol, 50:50 v/v) was found as 15.11± 0.28, 8.31±0.01, 17.92±0.05, 168.03±0.33, 19.47±0.16, 14.44±0.12 and 11.12±0.22 Fe (II)E/g of DWE respectively. Results were statistically analyzed byone-way ANOVA followed by Tukey’s multiple comparison test. The order of free radical FRAP activity was found as Camellia sinensis> Glycyrrhiza glabra> Curcuma longa> Aloe barbadensis> Arnica montana> Calendula officinalis>Azadirachta indica.
Determination of ABTS (2, 2’-amino-bis (3-ethylbenzothiazoline-6-sulfonic acid) free radical scavenging activity
Trolox equivalent activity of the extracted herbals was determined by using ABTS assays method. ABTS free radical scavenging activity of the extracts viz-a-viz Aloe barbadensis (leaf) (Aq.); Azadirachta indica (leaf) (Aq.); Curcuma longa (rhizome) (Aq.: Ethanol, 50:50 v/v); Camellia sinensis (leaf) (Aq.); Glycyrrhiza glabra (stem) (Aq.: Ethanol, 30:70 v/v); Arnica montana (Aq.: Ethanol, 50:50 v/v); and Calendula officinalis Aq.: Ethanol, 50:50 v/v) was found as 14.23±0.11, 1.26±0.17, 0.89±0.14, 2.75±0.016, 3.14±0.14, 2.14±0.07 and 1.18±0.11 µg TEAC/g of DWE respectively. Results were statistically analyzed by employee one-way ANOVA using Tukey’s multiple comparison test. The order of ABTS scavenging activity was found as Aloe barbadensis> Glycyrrhiza glabra> Camellia sinensis> Arnica montana>Azadirachta indica> Calendula officinalis> Curcuma longa.
Determination of NO (Nitric oxide) scavenging potential activity
Nitric oxide scavenging potential activity of the extracted herbals was performed by using NO method and percentage inhibition of nitric oxide free radical by given extract was expressed as capacity of inhibition as depicted in Table 7 The percentage inhibition of the NO by extracts as Aloe barbadensis (leaf) (Aq.); Azadirachta indica (leaf) (Aq.); Curcuma longa (rhizome) (Aq.: Ethanol, 50:50 v/v); Camellia sinensis (leaf) (Aq.); Glycyrrhiza glabra (stem) (Aq.: Ethanol, 30:70 v/v); Arnica montana (Aq.: Ethanol, 50:50 v/v); and Calendula officinalis Aq.: Ethanol, 50:50 v/v) was found to be 38.43%, 78.00%, 58.80%, 62.14%, 66.46%, 54.12% and 49.46% respectively. Results were statistically analyzed byone-way ANOVA followed by Tukey’s multiple comparison test. The order of percentage inhibition of NO by extracts was as Azadirachta indica> Glycyrrhiza glabra> Camellia sinensis> Curcuma longa> Arnica montana> Calendula officinalis> Aloe barbadensis.
Determination of Total Antioxidant Capacity (TAC)
Total antioxidant capacity of the extracted herbals was performed by phosphomolybdenum complex formation method. Herbal extracts viz-a-viz Aloe barbadensis (leaf) (Aq.); Azadirachta indica (leaf) (Aq.); Curcuma longa (rhizome) (Aq.: Ethanol, 50:50 v/v); Camellia sinensis (leaf) (Aq.); Glycyrrhiza glabra (stem) (Aq.: Ethanol, 30:70 v/v); Arnica montana (Aq.: Ethanol, 50:50 v/v); and Calendula officinalis Aq.: Ethanol, 50:50 v/v) showed TAC as 4.23±0.01, 8.12±0.17, 4.15±0.17, 7.14±0.16, 4.71±0.01, 1.12±0.14 and 0.77±0.01 mg AAE/g of DWE respectively. Results were statistically analyzed by one-way ANOVA using Tukey’s multiple comparison test and are also depicted in Table 7. The order of TAC activity wereAzardichata indica> Camellia sinensis> Glycyrrhiza glabra> Aloe barbdensis> Curcuma longa> Arnica montana> Calendula officinalis.
Table 7 In-vitro antioxidant potential of the homogenizer-assisted extracted herbals
|
Parameters |
Aloe barbadensis (Aq.) |
Azadirachata indica (Aq.) |
Curcuma longa (Aq.: Ethanol, 50:50 v/v) |
Camellia sinensis (Aq.) |
Glycyrrhiza glabra (Aq.: Ethanol, 30:70 v/v) |
Arnica montana (Aq.: Ethanol, 50:50 v/v) |
Calendula officinalis Aq.: Ethanol, 50:50 v/v) |
|
DPPH (IC50) |
1.11±0.16$ |
2.14±0.11#$ |
1.72±0.17#$ |
7.81±0.14#* |
2.56±0.11# |
2.23±0.17# |
0.93±0.02$,ns |
|
FRAP (mg Fe (II) E/g of DWE |
15.11±0.28# |
8.31±0.01# |
17.92±0.05# |
168.03±0.33* |
19.47±0.16# |
14.44±0.12# |
11.12±0.22# |
|
ABTS (µg TEAC/g of DWE) |
14.23±0.11*# |
1.26±0.17* |
0.89±0.14ns |
2.75±0.16* |
3.14±2.14* |
2.14±0.07* |
1.18±0.11* |
|
NO (%I) |
38.43%# |
78.00%* |
58.80%# |
62.14%* |
66.14%* |
54.12%# |
49.46%# |
|
TAC (mg AAE/g of DWE) |
4.23±0.01* |
8.12±0.17* |
4.15±0.17* |
7.14±0.16* |
4.71±0.01* |
1.12±0.14* |
0.77±0.01# |
In-vitro antioxidant capacities of extracted herbals are expressed as the mean±SEM (n=3) evaluated by DPPH (2, 2-diphenyl-1-picrylhydrazyl); FRAP (Ferric Reducing Antioxidant Power); ABTS (2,2’-azio-bis(3-ethylbenzothiazone-6-sulfonic acid); NO (Nitric oxide) and TAC (Total Antioxidant Capacity). Where TEAC is Trolox equivalent antioxidant capacity; AAE is Ascorbic acid equivalent antioxidant capacity and DWE is Dried weight of the extract.
One-way ANOVA using Tukey’s multiple comparison test statistic is used and with p value as p<0.001(*); p<0.01(#), p<0.05 ($) and ns (non-significant).
Preparation of novel-herbosomes (n-herbosomes)
Preparation of n-herbosomes was carried out by method by thin film hydration method in different batches with ingredients prescribed in Table 1 and later on optimized by using response surface method by optimizing percentage entrapment efficiency (%EE), in-vitro drug permeation (Q) and particle size (nm).
Incorporation of n-herbosomes into Polymeric base to form novel-herbosomal loaded PEG-Poloxamer topical formulation (n-HPTF)
Optimized n-herbosomes (n-H-06) was incorporated in the PEG-Poloxamer polymeric base and n-HPTF was formulated in different batches by controlling independent variables like polymer ratio and penetration enhancer and subsequently optimized by statistical models.
Design of experiment (DoE)
Optimization of the n-herbosomes and n-HPTF was done by using response surface methodology using 32 full factorial design and optimization was done by using one-way ANOVA and expressed by surface plot, fitted surface plot, predicted and observed value and suing pareto chart for frequency of independent variables over dependent variables. The quadratics equation was found as:
%EE (CL): - 332.734 – 0.7836X – 5.9256Y + 0.006XX – 0.0056XY – 0.0157YY.
%EE (AM): - 220.1582 – 0.0224X + 3.6838Y + 0.0015XX – 0.0019XY – 0.0105YY.
PS (nm): 315.4073 + 3.0369X – 4.3125Y – 0.0056XY – 0.0088XY + 0.0196YY.
In-vitro drug permeation (CL): - 1.2232 – 0.024X + 0.2993Y + 0.0133XX – 0.0007XY –
0.0151YY.
In-vitro drug permeation (AM): 0.0797 + 0.0211X + 0.2993Y – 0.0004XX + 0.0018XY –
0.0016YY.
Spreadability (mm): - 19.3817 + 5.3888X + 1.9263Y – 0.3333XX – 0.0122XY – 0.1147YY.
Fcalculated>>>Ftabulated that confirmed that the selected independent variables had significant effect on the selected models. One-way ANOVA was employed and R2 value was obtained as: R2 (%EE of CL) = 0.9586, R2 (%EE of AM) = 0.9224, R2 (PS) = 0.8946, R2 (in-vitro drug permeation of CL) = 0.8695, R2 (in-vitro drug permeation of AM) = 0.7306, and R2 (spredability) = 0.9629 respectively. This reveals that percentage entrapment efficiency of both Curcuma longa and Arnica Montana was found to be satisfactory but particle size was little higher than usual this may be due to larger molecular chain present in the herbal extract in comparison with synthetic smaller molecular weight compounds. On the other hand,in-vitro drug permeation the actual value is less than predicted value this may be due to again larger chain present in the herbals which hinders the drug release responses from carrier and spredability and was found significant with the independent variables revealing that the selected variable fitted to the responses i.e., dependent variables. The surface responses from each run is depicted in Fig. 2. Based on which n-H-06 was optimized as n-herbosomes and n-HPTF-06 as a final formulation.
Characterization of novel herbosomes
Percentage entrapment efficiency (% EE) of n-herbosomes
Percentage entrapment efficiency of both entrapped drug Curcuma longa and Arnica montana was estimated and depicted in Table 4. The order of entrapped drug Curcuma longa was found as: n-H-06> n-H-05> n-H-07> n-H-08> n-H-09> n-H-04> n-H-03> n-H-01> n-H-02 respectively and order of entrapped drug Arnica montana was found as: n-H-06> n-H-05> n-H-08> n-H-09> n-H-07> n-H-04> n-H-03> n-H-02> n-H-01 respectively. Similar entrapment efficiency of one of the components of Curcuma longa’s that is curcumin has showed >80% entrapment efficiency when incorporated into liposomes was quoted by Ng et al., (2018).
Particle size, polydispersitivity and zeta potential of n-herbosomes
The mean vesicle size (nm), size distribution (PDI) and zeta potential (mV) are essential parameter to characterized vesiculosomes like herbosomes, liposomes, cubosomes etc. In this study all n-herbosomes was characterized for their particle size (nm) and found in the range between 214.8 nm to 280.1 nm also depicted in Table 4 and Fig. 3. Whereas polydispersitivity lies in between the range of 0.299 to 0.387 and zeta potential of all formulation was found as +26 mV revealing formation of stable herbosomes. The positive charge on zeta potential was due to stearic acid which was taken constant in all the formulation, hence measured for the optimized one i.e., n-H-06 as showed in Figure 3. To deliver drug to the deeper dermis layer the optimum particle size should be ≤300 nm [52-53] and our optimized particles lies within this range, hence herbosomes can beneficially act to the target site with more receptor binding affinity.
Characterization of optimized n-HPTF
Physical evaluation
Physical evaluation of the optimized n-HPTF-06 was done by observing colour, homogeneity, apparent phase separation upon long term storage at room temperature (250C ± 1) and cold storage condition (40C ± 1). There was no change observed attested temperature, which was further evaluated in stability chamber.
pH of optimized n-HPTF
Physiological pH is very important parameter to understand the release of drug in a unionized form. Hence, it is very important to design the formulation within range of target site of absorption of drug. pH of the optimized formulation n-HPTF-06 was evaluated by using digital pH meter and it was found as 6.5±0.11 (n=3). pH of the topicals can widely affect the permeation and absorption of the drug. Study suggested that an optimal pH of 6-7 was found good to increase the permeability through dermal layer [54-55].
Rheological behavior
All formulation from (n-HPTF-01 to n-HPTF-09) was used to access their rheological behavior by using ATGO digital viscometer. The rheological behavior of all formulation was found satisfactory and consistent. It was observed that formulation having high amount of polymeric ratio i.e., from n-HPTF-07 to n-HPTF-09 was slightly possesses more shear stress with respect to spinning of spindle of a given time. The rheological behavior of the all formulation is depicted in Fig.4.showing viscosity (η) with respect to shear rate (sec-1) applied.
Spreadability
Spreadabilty of the n-HPTF was performed by the method described earlier and is depicted in Table 5. It was observed that upon increasing the concentration of PEG-3350 (from 3.0 gm to 7.0 gm) and poloxamer-188 (from 2.5 gm to 10.5 gm) the spreadability of the formulation decreases and remain more consistent. Spreadability is a critical sensory parameter highly dependent upon the vehicles and humectant used in the formulation [56] and middle range of combination of PEG-3350: poloxamer-188 (5.0: 5.5 gm) was found a suitable range for ease-of-application (spreadability) i.e., 11.1±0.12 mm in 60 sec.
Attenuated Total Reflection-Fourier Transform Infrared Spectroscopy (ATR-FTIR)
The ATR-FTIR spectra of the optimized n-H-06 and n-HPTF-06 were characterized with all ingredients and their characteristic peaks and overlay spectra of the optimized formulation with ingredients are depicted in Fig. 5. The characteristic spectra of the L-α-Phosphatidylcholine showed prominent peaks at 3281.81 cm-1 broadO-H alcohol (stretching), 3010.32cm-1 medium C-H (stretching), 2922.12 cm-1 medium C-H (stretching), 1737.28 cm-1 strong C+O (stretching), 1618.99 cm-1 strong C+C (stretching), 1464.98 cm-1 medium C-H (bending), 1053.54cm-1 strong C-O (stretching) and 822.29cm-1 medium C-H (bending). Cholesterol showed their characteristics peaks at 3431.97 cm-1 broad O-H (stretching), 2929.85 cm-1 medium O-H (stretching), 2866.39cm-1 doublet C-H (stretching), 1670.7 cm-1 weak C=C (bending) and 1463.98cm-1 weak O-H (bending). And the optimized n-herbosomes (n-H-06) showed prominent peaks at 3350.91 cm-1 broad O-H (stretching), 2929.86 cm-1 medium O-H (stretching), 2978.15 cm-1 intermolecular O-H (stretching), 1643.33 cm-1 strong C=C (stretching), 1044.31 cm-1 strong CO-O-CO (stretching) and 879.13 cm-1 strong C-H (bending). Formulation base like PEG-3350 showed their characteristics peaks at 3425.32 cm-1 broad O-H (strong), 2860.61 cm-1 medium C-H (stretching), 2694.78 cm-1 medium C-H (stretching), 1340.99cm-1 medium C-H (bending) and 1097.67 cm-1 strong C-O aliphatic alcohol (stretching). Poloxamer (P-188) showed their characteristics peaks at 2969.93 cm-1 medium C-H (stretching), 2882.50 strong C-H (stretching), 1466.51cm-1 medium C-H (bending), 1100.81 cm-1 strong C-O (stretching) and 946.98 cm-1 monosubstituted C=C (bending). Garcinia indica showed prominent peak at 2953.46 cm-1 medium C-H (stretching), 2914.57cm-1 alkene C-H (stretching), 2849.33cm-1 alkane C-H (stretching), 1730.08cm-1 ester C=O (stretching) and 1174.39cm-1 medium C-O (stretching). Cetyl alcohol showed their characteristic peaks at 3271.03cm-1 broad O-H (stretching), 2916.33cm-1 strong C-H (stretching), 2848.94 cm-1 medium C-H (stretching) and 1464.81cm-1 strong C=C (stretching). Stearic acid showed their characteristics peaks at 2962.62 cm-1 medium C-H (stretching), 2914.94 cm-1 medium C-H (stretching), 1698.93 cm-1 conjugated ketone C=O (stretching), 1429.01cm-1 medium O-H (bending) and 940.62cm-1 weak C=C (bending). Xanthan gum showed their characteristics peaks at 3265.27cm-1 broad O-H (stretching), 2882.20cm-1 C-H (stretching), 1599.48cm-1 medium C=C (bending) and 1368.86cm-1 medium C-H (bending). Tocopherol acetate showed their characteristics peak at 2925.39cm-1 strong C-H (stretching), 2867.63cm-1 alkene C-H (stretching), 1758.31cm-1 strong C=O (stretching), 1460.16cm-1 medium C-H (bending) and 1204.43cm-1 C-O (stretching). Carbapol® 940 showed their characteristic peaks at 3048.70cm-1 broad O-H (stretching), 2946.83cm-1 strong C-H (stretching), 2659.46cm-1 medium C-H (stretching), 1703.76cm-1 C=O (stretching), 1414.68 cm-1 alcohol O-H (bending) and 1452.30cm-1 medium C-H (bending). PEG-200 showed their characteristics peak at 3410.49cm-1 broad O-H (stretching), 2868.24cm-1 strong C-H (stretching), 1453.92cm-1 medium C-H (bending), 1406.35cm-1 alcohol O-H (stretching) and 1099.26 cm-1 medium C-O (stretching). Tween-60 showed their characteristics peak at 3489.83cm-1 broad O-H (stretching), 2922.26cm-1 strong C-H (stretching), 2854.34cm-1 medium C-H (stretching), 1735.87cm-1 strong C=O (stretching), 1638.90 cm-1 conjugated C=O (stretching) and 1097.09cm-1 medium C-O (stretching). Transcutol® showed their characteristics peak at 3430.56cm-1 broad O-H (stretching), 2975cm-1 strong C-H (stretching), 2867.54cm-1 strong C-H (stretching), 1455.38cm-1 medium C-H (bending), 1287.47cm-1 medium C-O (stretching) and 1068.86cm-1 secondary alcohol C-O (stretching). Glycerol showed their characteristics peak at 3293.89cm-1 broad O-H (stretching), 2879.34cm-1 strong C-H (stretching), 2933.20cm-1 strong C-H (stretching), 1412.14cm-1 medium C-H (bending) and 1029.64 cm-1 medium C-O (stretching). Triethanolamine showed their characteristics peak at 3307.47cm-1 strong O-H (stretching), 2948.61cm-1 , 2478.52cm-1 , and 2822.85cm-1 ternary amine, 1655.19cm-1 medium C=O (stretching) and 1067.15cm-1 medium C-O (stretching). Physical mixture of the designed formulation showed characteristics peak at 3350.60cm-1 broad O-H (starching), 2980.01 cm-1 strong C-H (stretching), 2816.75cm-1 C-H (stretching), 1639.07cm-1 weak C=C (stretching), 1457.85cm-1 C-H (bending) and 1044.43cm-1 medium C-O (stretching). And finally optimized formulation n-HPTF-06 showed their characteristics peaks at 3359.71cm-1 broad O-H (starching), 2883.55 cm-1 strong C-H (stretching), 2816.75cm-1 C-H (stretching), 1638cm-1 weak C=C (stretching), 1457.85cm-1 C-H (bending) and 1094.38cm-1 medium C-O (stretching). The identical peaks in the physicochemical mixture and optimized formulation revealed no physicochemical incompatibility in this combination of drug and polymers.
In-vitro drug permeation (Q)
In-vitro drug permeation from n-HPTF-06 containing herbosomes and extracted herbals is depicted in Fig. 6. The aim of preparing herbosomes was to increase the bioavailability of Curcuma longa at the target site due to its ability to inhibit TNF-alpha factor in deep tissue injury as well as it also contains antimicrobial property along with it. Secondly, Arnica montana which is hydrophilic in nature but still selected to incorporate into herbosomes due to their potent analgesic effect which required in an immediate action at the targeted site. Other ingredients like Aloe barbadensis, Azadirachata indica, Camellia sinensis, Glycyrrhiza glabra, Calendula officinalis and Pro-Vitamin B5 showed controlled release from the polymeric matrix. Initially, a burst release pattern was seen in all ingredients due to their hydrophilic charged surface. different release pattern for all herbals suggested that it may be due to nature of solubility and affinity to entrapped by the polymer and lipid inside their core matrix as well as to the polymeric end chain, secondly this may be due molecular weight and partition efficiency to the semi permeable membrane at the diffusion site and a similar release parameter was cited by Vuddanda et al.; (2015).
Kinetic modeling
The release kinetic model’s R2 value estimated for all ingredients in optimized formulation n-HPTF-06 has shown in Table 8. Overall best fit model for optimized formulation was first order model in which amount of drug dissolved in the buffer media directly from the formulation followed by Higuchi’s model in which drug dissolution take place from the matrix of the polymeric core. The different behavior of the herbals may be due to their complex molecular chain and larger molecular size.
Table 8 Release kinetic model for the optimized formulation n-HPTF-06
|
Kinetic model |
Aloe barbadensis (Aq.) (R2) |
Azadirachata indica (Aq.) (R2) |
Curcuma longa (Aq.: Ethanol, 50:50 v/v) (R2) |
Camellia sinensis (Aq.) (R2) |
Glycyrrhiza glabra (Aq.: Ethanol, 30:70 v/v) (R2) |
Arnica montana (Aq.: Ethanol, 50:50 v/v) (R2) |
Calendula officinalis Aq.: Ethanol, 50:50 v/v) (R2) |
Pro vitamin B5 (R2) |
|
Zero order |
0.874 |
0.874 |
0.875 |
0.969 |
0.901 |
0.974 |
0.969 |
0.971 |
|
First order |
0.814 |
0.914 |
0.941 |
0.984 |
0.914 |
0.923 |
0.914 |
0.978 |
|
Higuchi model |
0.819 |
0.921 |
0.874 |
0.914 |
0.901 |
0.907 |
0.907 |
0.905 |
|
Korsmeyer-Peppas |
0.748 |
0.748 |
0.784 |
0.873 |
0.822 |
0.904 |
0.987 |
0.808 |
Stability study
Stability study of the final optimized formulation was studied by placing the optimized formulation n-HPTF-06 at two different temperatures as per ICH guideline for long term stability study of topical formulation i.e., 5°C±3°C and 30°C±2°C; 65%±5% RH. n-HPTF-06 was accessed for color, texture, pH, spreadability and phase separation with respect to time (in days) for sampling i.e., 0, 30, 60, 90, 120, and 180 days of storage. There was no significant change in any parameter was observed, observed data are tabulated in Table 9. Further any physicochemical incompatibility upon long term storage was accessed by using ATR-FTIR and there is no physicochemical incompatibility was seen in spectra.
Table 9 Stability study of the optimized n-HPTF by using ICH guidelines Q1 A (R2) (Long term study)
|
Characteristics of Optimized formulation (n-HPTF-06) |
Temperature (°C) and %Relative Humidity (%RH) |
Time (in days) |
|||||
|
Initial observations |
30 days |
60 days |
90 days |
120 days |
180 days |
||
|
Color |
5°C±3°C 30°C±2°C; 65%±5% RH |
Pale yellow Pale yellow |
Pale yellow Light brown |
Pale yellow Light brown |
Pale yellow Light brown |
Pale yellow Light brown |
Pale yellow Light brown |
|
Texture |
5°C±3°C 30°C±2°C; 65%±5% RH |
Smooth & no grittiness Smooth & no grittiness |
Smooth & no grittiness Smooth & no grittiness |
Smooth & no grittiness Smooth & no grittiness |
Smooth & no grittiness Smooth & no grittiness |
Smooth & no grittiness Smooth & no grittiness |
Smooth & no grittiness Smooth & no grittiness |
|
pH |
5°C±3°C 30°C±2°C; 65%±5% RH |
6.5±0.11 6.5±0.17 |
6.5±0.10 6.5±0.11 |
6.5±0.12 6.5±0.11 |
6.5±0.10 6.4±0.13 |
6.4±0.14 6.4±0.12 |
6.4±0.11 6.4±0.12 |
|
Spredability (Spreading in 1 min at the force of 25 gm) |
5°C±3°C 30°C±2°C; 65%±5% RH |
11.02 mm2 11.11 mm2 |
11.00 mm2 11.02 mm2 |
11.01 mm2 11.13 mm2 |
11.10 mm2 11.15 mm2 |
11.17 mm2 11.14 mm2 |
15.14 mm2 15.19 mm2 |
|
Phase separation |
5°C±3°C 30°C±2°C; 65%±5% RH |
No phase separation No phase separation |
No phase separation No phase separation |
No phase separation No phase separation |
No phase separation No phase separation |
No phase separation No phase separation |
No phase separation No phase separation |
Skin irritancy study of optimized n-HPTF
The optimized n-HPTF-06 was used for the skin irritancy study on female Sprague Dawley rats (n=6) and observed under prescribed protocol of (OECD 402). The formulation was applied over dorsal area of the rat’s skin by dividing the skin surface into two sections on the same rat to see any immediate contact irritation on the leftover skin (if any). Subsequently, rat skin was observed initially for 1h and 6 h and observations were recorded and further the skin was restrained by using medical adhesive so that formulation remained in contact with the skin for a long time. On the next day, adhesive was removed and wiped out and the skin was gently sanitized by using 70 % ethanol and observation was recorded and further observations were made till 72 h and primary dermal irritation index (PDII) was scored. No erythema or edema was observed on skin of the rats at any point of study. Hence, the optimized formulation was considered as a safe formulation possessing no-irritancy upon application on rat’s skin is depicted in Table 10.
Table 10 Primary dermal irritation scores in female Sprague Dawley rats (n=6) after exposure to optimized n-HPTF
|
Time (h) |
Incident of dermal irritation Erythema Edema |
Total PDI* |
PDII** |
|
|
1 |
0 |
0 |
0 |
0 |
|
6 |
0 |
0 |
0 |
0 |
|
24 |
0 |
0 |
0 |
0 |
|
48 |
0 |
0 |
0 |
0 |
|
72 |
0 |
0 |
0 |
0 |
PDI* (Primary Dermal Irritation = average erythema + average edema)
PDII** (Primary Dermal Irritation Index)
Experimental design and dose optimization for bio-efficacy study of n-HPTF
Sprague Dawley rats used for this study were grouped into three groups: Group (I, II, and III) as mentioned above and frostbite was induced comparative study of the frostbite condition was monitored in formulation treated groups as well as in untreated condition. Visual observation was done and changes recorded and further the condition was analyzed by histological study. No treatment complications or death of animals were observed during the course of this study.
n-HPTF ameliorates cold injury, promotes skin frostbitten wound healing and maintains skin integrity in-vivo
A sequential analysis was required before reaching the final conclusion vis-a-vis the optimized n-HPTF formulation. In cold-injury, tissue undergoes multifarious pathological alterations which may lead to amputation of exposed extremities if the sequences of changes/alteration(s) are not controlled. When the skin comes in contact with chilled wind or in sub-zero temperature, it impairs the normal physiological condition and causes desensitization of the non-selective cationic channel, vasoconstrictions, tissue hypoxia, alteration in flow of electrolyte concentration inside the cells, ice-crystal formation, generation of reactive oxygen species, tissue necrosis. Cumulative and prolonged exposure persistence of these conditions accentuates thrombus formation, and thus leading to amputation/loss of extremities. Thus, in this study animals were grouped in three major groups viz; Group I (untreated), Group II (standard formulation twice a day; 0.5 gm application), Group III (treatment was followed by applying n-HPTF twice a day; 0.5 gm/each application) and observation was recorded on 3, 7, 14, 21, and 28 days till the complete healing of frostbitten rat skin.
At day 0, purplish skin was observed after 2 Hrs of induction of frostbite in all the rats and the area was marked for further morphometric analysis.
At day 3, the major changes in the skin were noticed in all the three groups: [Group I: the skin became more injured and appeared more wounded in comparison to Groups II and Groups III animals which received topical formulations]. The severity of cold injury among the groups was evident from visual inspection of the dead epidermis and more inflamed and flared skin.
At day 7, Group I animals of the skin became oozier and developed hard crust over skin as well as pus formation was also observed. In Group II and Group III the hard crust was also observed but in case of Group III the skin around the crust was normal and no sign of inflammation was observed in comparison to Group I and II.
At day 14, the hard crust from the animal skin was crust out in almost all groups but in case of untreated groups the condition of skin worsened and was a significant sign of ice-crystal formation, which upon nucleation damaged the deep skin layers in both Group I and II with very slight observable differences whereas the skin of Group III animal which were treated with n-HPTF was remain in contact which reveals that n-HPTF increases the ionic interaction and thus maintains integrity of the skin.
At day 21, Group III showed accelerated healing rate followed by contraction and narrowing the wound area, suggesting an earlier re-epithelialization than the others groups of animal.
At day 28, Group III showed complete healing and no scars over skin was witnessed by necked eyes over the skin of animals.
In conclusion, based on the ingredients incorporated in n-HPTF which was priory selected with the function of their targeted mode of action over the entire squeal helped in alleviation of the frostbite symptoms and promoted rapid tissue healing as compared to untreated group and standard drug treated group and the comparative digital representation of all the three groups with respect to days 0, 3, 7, 14, 21 and 28 are also depicted in Fig. 7.
Morphometric analysis of frostbitten wound area
Animals groups followed by their prescribed dosage form was observed for their healing rate and measured by using Vernier-caliper at day 3, 7, 14, 21 and 28 respectively and percentage frostbitten-wound contraction was calculated by formula mentioned above. The results was analyzed by using student t-test and found to be significant at p- value < 0.05. n-HPTF showed ≈98.96% recovery than the standard treatment (65.65 %) at day 28 suggesting that an improved healing rate and the supporting morphometric measurement in graphical form is also depicted in Fig. 8.
Channelized recovery of frostbitten skin by n-HPTF evaluated histopathologically
The histological study was designed to observe the detailed changes occurring during the course of induction of frostbite in cold injury induced model. During the study protocol, detailed histology of skin layers, demarcation and thickness of skin layers, morphology of underlying papillary layer as well as dermis layer with abundant blood capillaries and connective tissue cells was studied.
Day 3: Animals of all three groups represented similar changes symptomatically to frostbite condition. Few differences was noticed in the animal Group I and II, in which the skin layers was less inflamed (Fig. 9 (B1 and C1) as compared to untreated groups as marked by red arrows in Group I (Fig. 9 (A1).
Day 7: In Group I and II (Frostbitten and frostbitten + standard drug treated) underlying papillary layer was completely delocalized due to progression of frostbitten wound (Fig. 9 (A2 and B2) but in Group III papillary layer just below the epidermis was found intact with their position which is due to the antioxidant properties possess by extracted herbals incorporated to the n-HPTF are able to maintain papillary which is widely known for the regulation of vascular temperature hence inhibit the ice-crystal formation as depicted in Fig. 9 (C2), similar observation was evaluated by Auerbach et al., 2014.
Day 14: Group I (untreated) exhibited complete disruption of all layers of the skin and losses of skin integrity, disruption of blood vessels and connective tissue and histopathologically depicted in Fig. 9 (A3) whereas, in Group II, the demarcation was observed and skin gaps between epithelial junctions could be clearly observed. However, in case of Group III a clear morphology, with defined skin integrity was observed at day 14 suggesting that n-HPTF is effective in controlling the subsequent ischemic condition inside the cells those results due to cold induced stress. The herbal ingredients in n-HPTF possess significant amount of antioxidant capacity as reveals in the in-vitro antioxidant capacity of the homogenizer assisted extracted herbals which are showing promising therapeutic for the cold injury condition.
Day 21: Group I, showed formation of larger vacuoles during the phase of natural healing attaining by dermis and epidermis layer of mammalian skin (Fig. 9 (A4)) similar results were seen in Group II with less number of larger gap filling vacuoles (Fig. 9 (B4)), but in case of Group III, the skin layer exhibited a well-defined structure and a clear delineation between epidermis and dermis layer of skin suggesting that the herbal ingredients of n-HPTF are able to maintain ionic interaction between cells and thus accelerate the production of collagen as well as connective tissue which can be clearly observed in Fig 9 (C4) as well 40X resolution image is depicted in Fig 9 (E) showing dense collagen fiber suggesting recovered healing.
Quality by design (QbD) model is used in development of pharmaceuticals to control their critical processing variables and save the time and cost of the finished product. These models are frequently used in pharmaceutical development so that in-process quality control (IPQC) and finished product quality control (FPQC) can be obtained in given design space. In this paper we have formulated a novel-herbosomal topical formulation for the use of cold injury generally occurs in high altitude at ambient temperature from 40C to 100C when skin come in contact with cold wind exposure. The developed n-HPTF was critically controlled for their entrapment efficiency, particle size, zeta potential, spreadability, viscosity, in-vitro drug permeation etc. as well as the herbal extracts were characterized by using ATR-FTIR to obtained their characteristic peaks so that further any physicochemical changes after product development can be identified. The developed formulation was studied for optimizing their shelf-life by using long term stability study as per ICH guideline Q1 A (R2) and results were found satisfactory. Furthermore, the optimized formulation was used to assess the skin irritancy (if any) using female Sprague Dawley rats and no dermal erythema or edema was observed. In-vivo of the n-HPTF with respect to standard treatment was found significantly good at p-value < 0.05 suggesting a novel and herbal prophylactic as well as treatment regimen for the cold injury occurs at high altitude. In future, the optimized n-HPTF will be further used for molecular pathway elucidation as well as canonical biochemical pathways.
Compliances with ethical standards
Ethical Approval and Consent of participate:
For conducting animal study, ethical consent was approved by IAEC (Institutional Animal Ethical Committee) of Defence Institute of Physiology and Allied Sciences (DIPAS), DRDO, India, having approval number DIPAS/TAEC/2019/Dec-03. And there is no human study was carried out by authors for this study.
Consent for publication:
This paper reflects the view of authors and should not construed to reflect the views of the Govt. Of India or the Ministry of Defence/DRDO or any other institution(s)/agency(ies) whatsoever and may be construed as such. This article includes only unclassified information and is purely scientific in nature. The research work done is in compliance with all relevant ethical standards.
Availability of data and materials:
This study was not published anywhere and data provided in this study is studied to prove the theoretical aspect in topical formulation development.
Competing interests:
The authors declare no competing interests.
Funding:
The authors gratefully acknowledge the financial support for research received from DRDO under project ST/14-15/DIP-265, entitled “Development of herbal products based on pharmacologically active mushrooms and plants to improve human performance at high altitudes”.
Author’s contributions:
All authors discussed the strategies for the study and discussed the results and contributed for the final manuscript.
Acknowledgment:
The authors would like to thank Director, DIPAS for providing necessary facilities, support and encouragement. The authors gratefully acknowledge the financial support for research received from DRDO under project ST/14-15/DIP-265, entitled “Development of herbal products based on pharmacologically active mushrooms and plants to improve human performance at high altitudes”. RBY would like to acknowledge Defence Research and Development Organization (DRDO), India for providing a Senior Research Fellowship supporting her doctoral research work.
Author’s information
Affiliation:
1. Defence Institute of Physiology and Allied Sciences (DIPAS), DRDO, India
Renu Bala Yadav, Rajeev Varshney and Rajesh Arora.
2. Delhi Pharmaceutical Sciences and Research University, India
Dharam Pal Pathak
- ICH. The International Conference on Harmonization of Technical Requirements for Registration of Pharmaceuticals for Human Use. Quality Guideline Q8(R2) Pharmaceuticals development. https://database.ich.org/sites/default/files/Q8_R2_Guideline.pdf. [accessed on Sep 2020].
- ICH. 2009. ICH harmonized Tripartite Guideline: Pharmaceutical Development Q8 (R2).http://www.ich.org/fileadmin/Public_Web_Site/ICH_Products/Guidelines/Quality/Q8_R2_Guideline.pdf [accessed on Sep 2020].
- Food and Drug Administration. Guidance for industry. Q8(R1) Pharmaceutical Development. 2009.https://www.fda.gov/regultory-information/search-fda-guidance-documents/q8r2-pharmaceutical-development. [accessed on Sep 2020].
- Vogel G. Herbal medicines from a medical and pharmacological point of view. In: Quality of herbal medicines Stuttgart. Scientific publishing company GmbH; 1982. pp. 19–30.
- WHO, World Health Organization. Quality control methods for medicinal plant materials. Geneva: World Health Organization; 1992.
- Cochran WG, Cox GM. Experimental design. New York: John Wiley & Sons, Inc; 1992.
- Box GEP, Behnken DW. Some new three level designs for the study of quantitative variables. Technometrics. 1960;2:455–75.
- Effert T, Koch E. Complex interactions between phytochemicals. The multi-target therapeutic concept of phytotherapy. Curr Drug Target. 2011;12:122–32.
- Yan B, Li Y, Guo H, Qu H. Quality by design for herbal drugs: a feedforward control strategy and an approach to define the acceptable ranges of critical quality attributes. Phytochem. 2014;25:59–65.
- Pereia GA, Molina G, Arruda HS, Pastore GM. Optimizing the homogenizer-assisted extraction (HAE) of total phenolic compounds from banana peel. J Food Proces Eng. 2016; 1–8.
- Do QD, Angkawijaya AE, Tran-Nguyen PL, Huynh LH, Soetaredjo FE, Ismadji S, Ju YH. Effect of extraction solvent on total phenol content, total flavonoid content and antioxidant activity of Limnophila aromatica. J Food Drug Anal. 2014;22(3):296.
- Yadav RB, Kumar B, Vats A, Singh SN, Pathak DP, Arora R. Development, standardization and validation of analytical method for quality assurance and quality control of aloe-based pharmaceuticals and nutraceuticals. Trak J Sci. 2020;4:294–309.
- Zhishen J, Mengcheng T, Jianming W. The determination of flavonoid contents in mulberry and their scavenging effects on superoxide radicals. Food Chem. 1999;64(4):555–9.
- Alex KM, Stephen KM, Mathew PN., In vitro antioxidant activities of methanolic extracts of Caesalpinia volkensii Harms., Vernonia lasiopus O. Hoffm., and Acacia hockiiDe Wild. Evidence-Based Compl Alter Med. 2020; 1–10.
- Blois MS. Antioxidant determinations by the use of a stable free radical. Nature. 1958;181:1199–200.
- Uddin SN. Antioxidant and antibacterial activities of Trema orientalis Linn an indigenous medicinal plant of Indian subcontinent. Orie Pharm Exp Med. 2008;8(4):395–9.
- Benzie IF, Strain JJ. The Ferric reducing ability of Plasma (FRAP) as a measure of “antioxidant power”: the FRAP assay. Anal Biochem. 1996;239(1):70–6.
- Re R, Pellergini N, Proteggente A, Yang M, Rice-Evans C. Antioxidant activity applying an improved ABTS radical cation decolorization assay. Free Rad Bio Med. 1999;26:1231–7.
- Saeed N, Khan MR, Shabbir M. Antioxidant activity, total phenolic and total flavonoid contents of whole plant extract Torilisleptophylla L. BMC Compl Altern Med. 2012;12:221.
- Bunea A, Rugina D, Sconta Z. Anthocyanin determination in blueberry extract from various cultivars and their antiproliferative and apoptotic properties in B16-F10 metastatic murine melanoma cells. Phytochem. 2013;95:436–44.
- Hazra B, Biswas S, Mandal N. Antioxidant and free radical scavenging activity of spondias pinnata. BMC Compl Altern Med. 2008;8:63–73.
- Prieto P, Pineda M, Aquilar M. Spectrophotometric quantitation of antioxidant capacity through the formation of phosphomolybdanum complex: specific application to the determination of Vitamin E. Anal Biochem. 1999;269(2):337–41.
- Dave V, Yadav RB, Kushwaha K, Yadav S, Sharma S, Agrawal U. Lipid-polymer hybrid nanoparticles: Development & Statistical optimization of norfloxacin for topical drug delivery system. Bioact Mater. 2017;2:269e280.
- Bangham AD. Surrogate cells or Trojan horses. The discovery of liposomes: BioEssays News Review. Mol Cell Dev Bio. 1995;17:1081–8.
- Dave V, Sharma S, Yadav RB, Agarwal U. Herbal liposome for the topical delivery of ketoconazole for the effective treatment of seborrheic dermatitis. Appl NanoSci. 2017;7:973–87.
- Lionberger RA, Lee SL, Lee L, Raw A, Yu LX. Quality by design: concept for ANDAs. AAPS J. 2008;10(2):268–76.
- Rosas JG, Blanco M, Gonzalez JM, Alcala M. Quality by design approach of a pharmaceutical gel manufacturing process, part 1: determination of design space. J Pharm Sci. 2011;100(10):4432–41.
- Box-George EP, Hunter JS, Hunter WG. Statistics for experimenters: Design, innovation and discovery. Second ed. New York: Wiley; 1978. p. 510.
- Ferreira SLC, Burns RE, Ferreira HS, Matos GD, David JM, Brandao GC, da-Silva EGP, Portugal LA, dos-Reis PS, Souza AS, dos-Santos WNL. Box-Behnken design: an alternative for the optimization of analytical methods. Anal Chem Acta. 2007;597:179–86.
- Myers RH, Montgomery DC, Anderson-Cook CM. Response surface methodology: process and product optimization using designed experiments, Third ed. John Wiley & Sons Inc.
- Singh B, Tripathi C, Bhatowa R, Kapil R. Developing micro-/nanoparticulate drug delivery systems using “design of experiments”. Int J Pharm Invest. 2011;1:75–87.
- Badawi MA, El-Khordaugi LK. A quality by design approach to optimization of emulsions for electrospinning using factorial and D-optimal designs. Eur J Pharma Sci. 2014; 1–12.
- Li Y, Wong HL, Shuhendler AJ, Rauth AM, Wu XY. Molecular interactions, internal structure and drug release kinetics of rationally developed polymer-lipid hybrid nanoparticles. J Control Rel. 2008;128:60–70.
- Gusai T, Dhavalkumar M, Soniwala M, Dudhat K, Vasoya J, Chayda J. Formulation and optimization of microsponge-loaded emulgel to improve the transdermal application of acyclovir- a DOE based approach. Drug Del Transl Res. 2020;11:1–21.
- Shahzad Y, Afreen U, Nisar H, Shah S, Hussain T. Applying response surface methodology to optimized nimesulide permeation from topical formulation. Pharma Dev Tech. 2013;18:1391–98.
- Kikwai L, Babu RJ, Prado R, Kolot A, Armstrong CA, Ansel JC, Singh M. In vitro and in vivo evaluation of topical formulation of Spantide II. AAPS Pharm Sci Tech. 2004;6(4):71.
- Bolla PK, Clark BA, Juluri A, Cheruvu HS, Renukuntla J. Evaluation of formulation parameters on permeation of ibuprofen from topical formulations using Strat-M® Membrane. Pharmaceutics. 2020;12:151.
- Bolla PK, Meraz CA, Rodriguez VA, Deaguero I, Singh M, Yellepeddi VK, Renukuntala J. Clotrimazole loaded Ufosomes for topical delivery: formulation development and in-vitro studies. Molecules. 2019;24:3139.
- Djekic L, Martinovic M, Stepanovi’c-Petrovi’c, Micov A, Tomi’c M, Primorac M. Formulation of hydrogel-thickened nonionic microemulsions with enhanced percutaneous delivery of ibuprofen assessed in vivo in rats. J Pharm Sci. 2016; 92: 255–265.
- Hadgraft J, Du Plessis J, Goosen C. The selection of non-steroidal anti-inflammatory agents for dermal delivery. Int J Pharm. 2000;207:31–7.
- Bruschi ML. Mathematical models of drug release. Strategies to modify the drug release from pharmaceutical systems. Woodhead Publishing: Combridge, UK; 2015. pp. 63–86.
- Yarce C, Pineda D, Correa C, Salamanca C. Relationship between surface properties and in-vitro drug release from a compressed matrix containing an amphiphilic polymer material. Pharmaceutics. 2016; 9–36.
- Costa P, Sousa Lobo JM. Modeling and comparison of dissolution profiles. Eur J Pharma. 2001;13:122–33.
- Varelas CG, Dixon DG, Steiner CA. Zero-order release from biphasic polymer hydrogels. J Control Rel. 1995;34:185–92.
- Siepmann J, Peppas NA. Higuchi equation: Derivation, application, use and misuse. Int J Pharm. 2011;418:6–12.
- Cruz L, Soares LU, Costa TD, Mezzalira G, Da Silveria NP, Guterres SS, Pohlmann AR. Diffusion and mathematical modeling of release profiles from nanocarriers. Int J Pharma. 2006;313:198–205.
- Korsmeyer RW, Gurny R, Doelker E, Buri P, Peppas NA. Mechanisms of solute release from porous hydrophilic polymers. Int J Pharma. 1983;15:25–35.
- Lalitha P, Sripathi SK, Jayanthi P. Acute toxicity study of extracts of Eichhornia crassipes (Mart.) Solms. Asian J Pharma Clin Res. 2012;5:59–61.
- OECD Guidelines for the testing of chemicals. https://www.oecd.org/environment/test-no-402-acute-dermal-toxicity-9789264070585-en.htm. [accessed on June 2021].
- ICH Q1A (R2), Stability Testing of New Drug Substances and Products, International Conference on Harmonization, United State Department of Health and Human Service Food and Drug Administration,(2003) pp. 4e20. CPMP/ICH/2736/99.
- Ng ZY, Wong JY, Panneerselvam J, Madheswaran T, Kumar P, Pilay V, Hsu A, HansbroN, Bebawy M, Wark P, Hansbro P, Dua K, Chellappan DK. Assessing the potential of liposomes loaded with curcumin as a therapeutic intervention in asthma. Colloids Sur B: Biointerf. 2018;172:51–9.
- Du Plessis J, Ramachandra C, Weiner N, Muller DG. The influence of particle size of liposomes on the deposition of drug into skin. Int J Pharma. 1994;103:277–82.
- Verma DD, Verma S, Blume G, Fahr A. Particle size of liposomes influences dermal delivery of substances into skin. Int J Pharma. 2003;258:141–51.
- Sahle FF, Balzus B, Gerecke C, Kleuser B, Bodmeir R. Formulation and in-vitro evaluation of polymeric enteric nanoparticles as dermal carriers with pH-depenedent targeting potential. Eur J Pharm Sci. 2016;92:98–109.
- Surber C, Abels C, Mailbach H (ed.). pH of the skin: issues and challenges, Curr. Probl. Dermatol. Basel. Karger. 54 (2018) pp. 143–151.
- Ili T, Daniels R. Critical quality attributes, in-vitro release and correlated in-vitro skin permeation-in-vivo tape stripping collective data for demonstrating therapeutics (non) equivalence of topical semisolid: a case study of “ready-to-use” vehicles. Int J Pharma. 2017;528:253–67.
- Vuddanda PR, Mishra A, Singh SK, Singh S. Development of polymeric nanoparticles with highly entrapped herbal hydrophilic drug using nanoprecipitation technique: an approach of quality by design. Pharma Dev Tech. 2015;20(5):579–87.
- Jhawat V, Gilia M, Gupta S, Maddiboyina B, Dutt R. Integration of pharmacogenomics and theranostics with nanotechnology as quality by design (QbD) approach for formulation development of novel dosage forms for effective drug therapy. J Control Rel. 2020;327:500–11.
- Rose F, Wern JE, Ingvarsson PT, Van de Weert M, Andersen P, Follmann F, Foged C. Engineering of a novel adjuvant based on lipid-polymer hybrid nanoparticles: a quality-bu-design approach. J Control Rel. 2015;210:48–57.
- Mark RP, Peter ME, Thomas JF, Matthias S, Jui-Chen T, Gopinathan KM, Walter MH, Kenneth RF. Skin barrier and transdermal drug delivery, Medical Therapy, Sect. 19, (2012)..
- Auerbach LJ. DeClerk BK, Fathman CG. Gurtner GC, Auerbach PS. Poly-L-Arginine topical lotion tested in a mouse model for frostbite injury, Wild Env Med 2014; 25 (2): 160–5.
- Vaghasiya K. Sharma A, Kumar K. RayE, Adlakha S, Katare OP, Hota SK. Verma RK. Heparin-encapsulated metered-dose topical “nano-spray gel” liposomal formulation ensures rapid on-site management of frostbite injury by inflammatory cytokines scavenging. 2019; 5: 6617–6631.
- GraphicalAbstract.png
Graphical abstract presenting the designing and optimization of novel-herbosomal loaded PEG-Poloxamer topical formulation (n-HPTF) and predictive model for the in-vivo study of the developed n-HPTF on Cold injury rat skin model
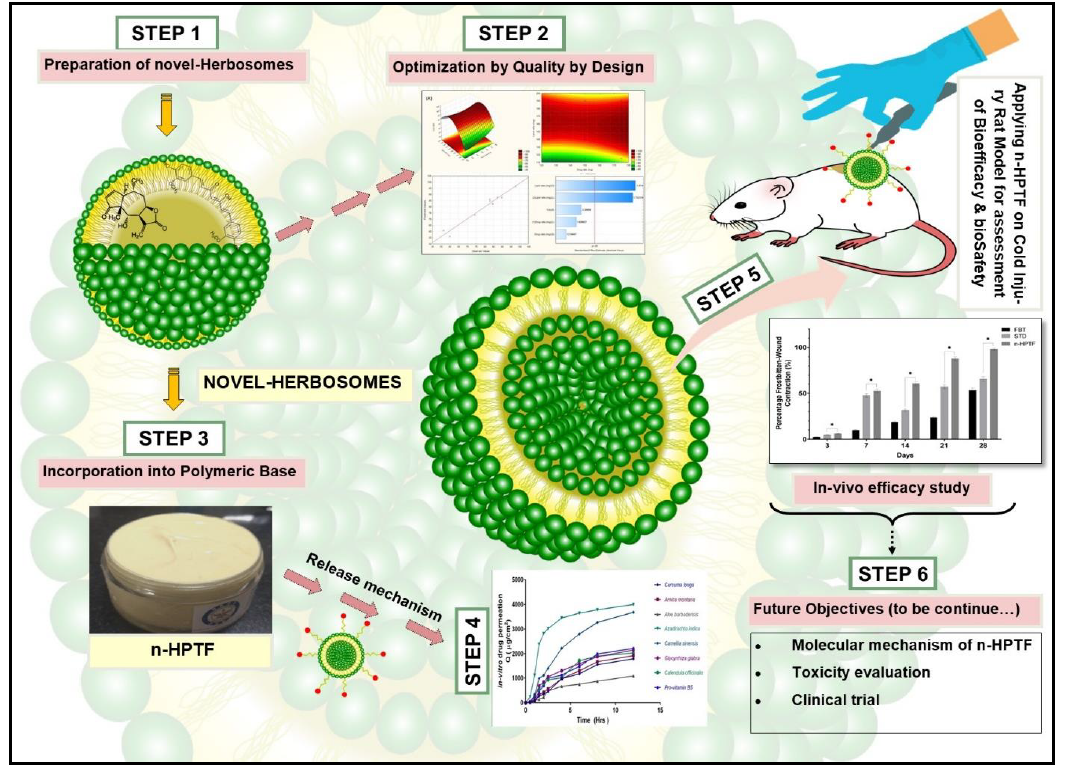