Blood donors
Blood samples were retrieved from residual clinical samples obtained after clinical testing from the NHS Grampian Biorepository (15/WM/0430). For lectin-age studies (Figures 2 and 3), blood samples were collected irrespective of age, gender or HbA1c levels. For lectin-hyperglycaemia and oxidation studies (Figure 4), blood samples were also collected irrespective of age or gender, selected by HbA1c levels in the normal (< 40 mmol/mol) and raised (>70 mmol/mol) ranges were collected at a 1:1 ratio.
Blood cell separation
Erythrocytes were separated from white blood cells in donor blood using Lymphoprep. Briefly, whole blood was diluted 1:1, layered over Lymphoprep and centrifuged at 400g for 35 minutes. The buffy coat was removed, while erythrocytes were isolated for analysis.
Lectin staining of erythrocytes and flow cytometry analysis
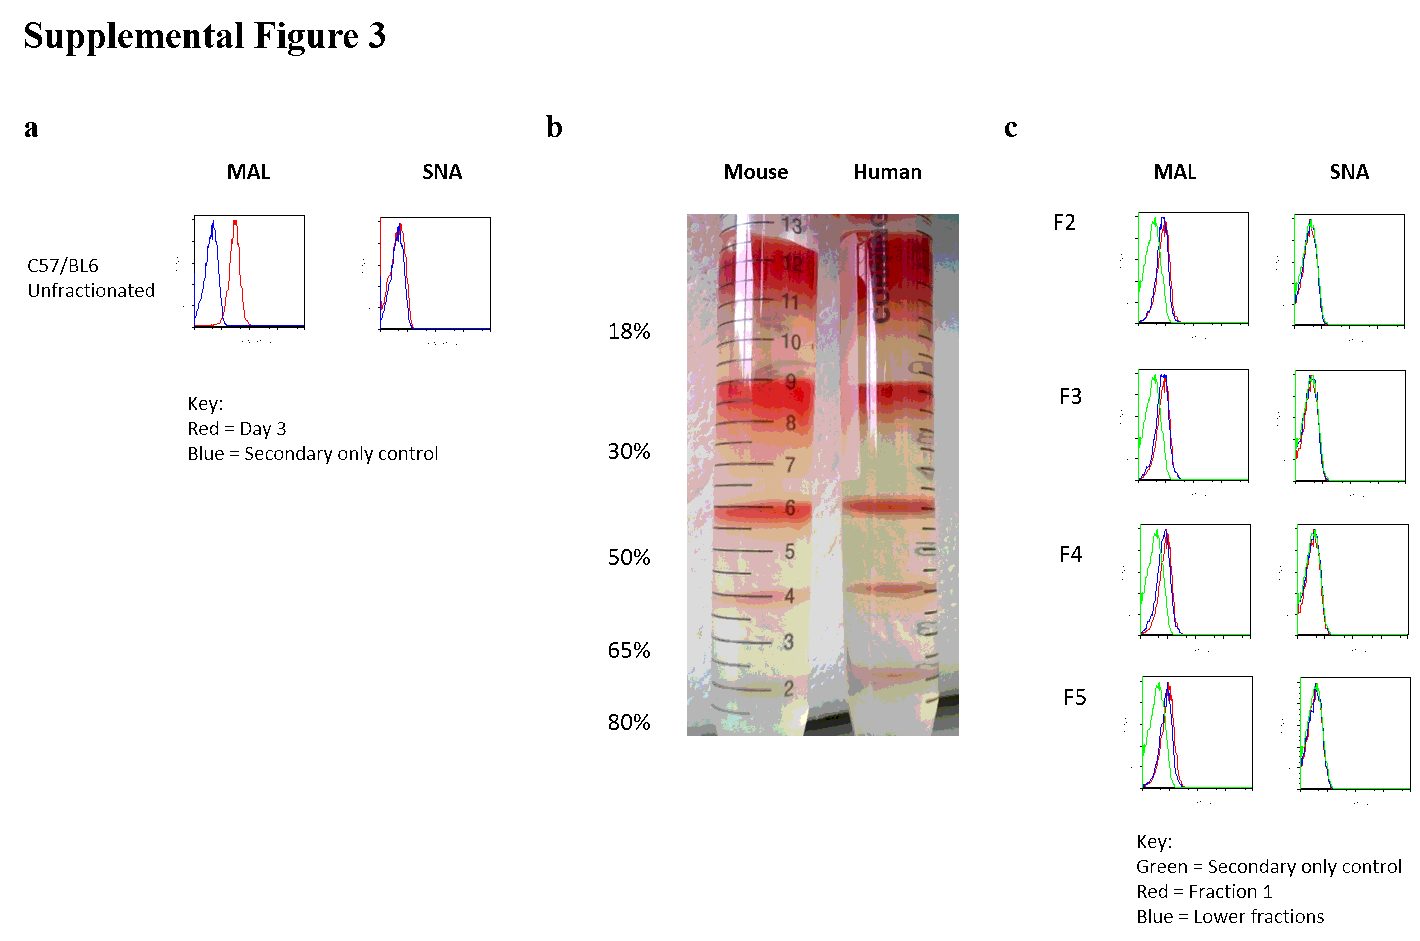
Biotinylated lectins (Vector Laboratories), Maackia amurensis Lectin II (MAL-II), Sambucas nigra Agglutinin (SNA), Aleuria aurantia (AAL) and Ulex europaeus (U.Euros) were used in conjunction with streptavidin PE-Cy7 or phycoerythrin (PE) for flow cytometric analysis. The lectins were titrated to minimise agglutination, as indicated by abnormally high forward versus side scatter (FCS) and high PE-Cy7 or PE intensity. Optimal flow cytometry concentrations for the lectins were MAL-II: 67 ng/ml; SNA: 57ng/ml; AAL: 200ng/ml; and U.Euros: 100ng/ml. Biotinylated lectins were applied, followed by streptavidin to purified erythrocytes, post-blocking with Carbo-Free-Block (Vector, SP5040) at room temperature for 30 minutes each before subjecting to flow cytometry (Dodge, Mitchell & Hanahan, 1963).
Neuraminidase treatment of erythrocytes
Purified erythrocytes were washed and treated with neuraminidase (Vibrio cholerae, Sigma) according to manufacturer’s instructions for 30 minutes at 37°C in DMEM. Cells were washed with cold (4°C) PBS thoroughly to remove contaminating enzyme or free sialic acids.
Periodic acid Schiff assay
Neuraminidase treated erythrocytes and control erythrocytes, N-acetylneuraminic acid (NANA) and fetuin, were subjected to a PAS assay adapted from Mehdi and colleagues (12). Samples were oxidized using 0.04 M periodic acid (4oC, 30 minutes, 1:5 ratio of acid to sample). Two volumes of resorcinol working solution (5 ml of 6.0% resorcinol solution, 0.125 ml of 0.1 M copper sulphate solution and 19.875 ml of distilled water, brought to a final volume of 50 ml with 10 M HCl) was added, heated at 98oC for 5 minutes and cooled in an ice bath for 2 minutes. 1.8 volumes of n-butanol was added, mixed vigorously and the mixture incubated for 3 minutes at 37oC. Absorbance at 625nm was measured against a reagent blank.
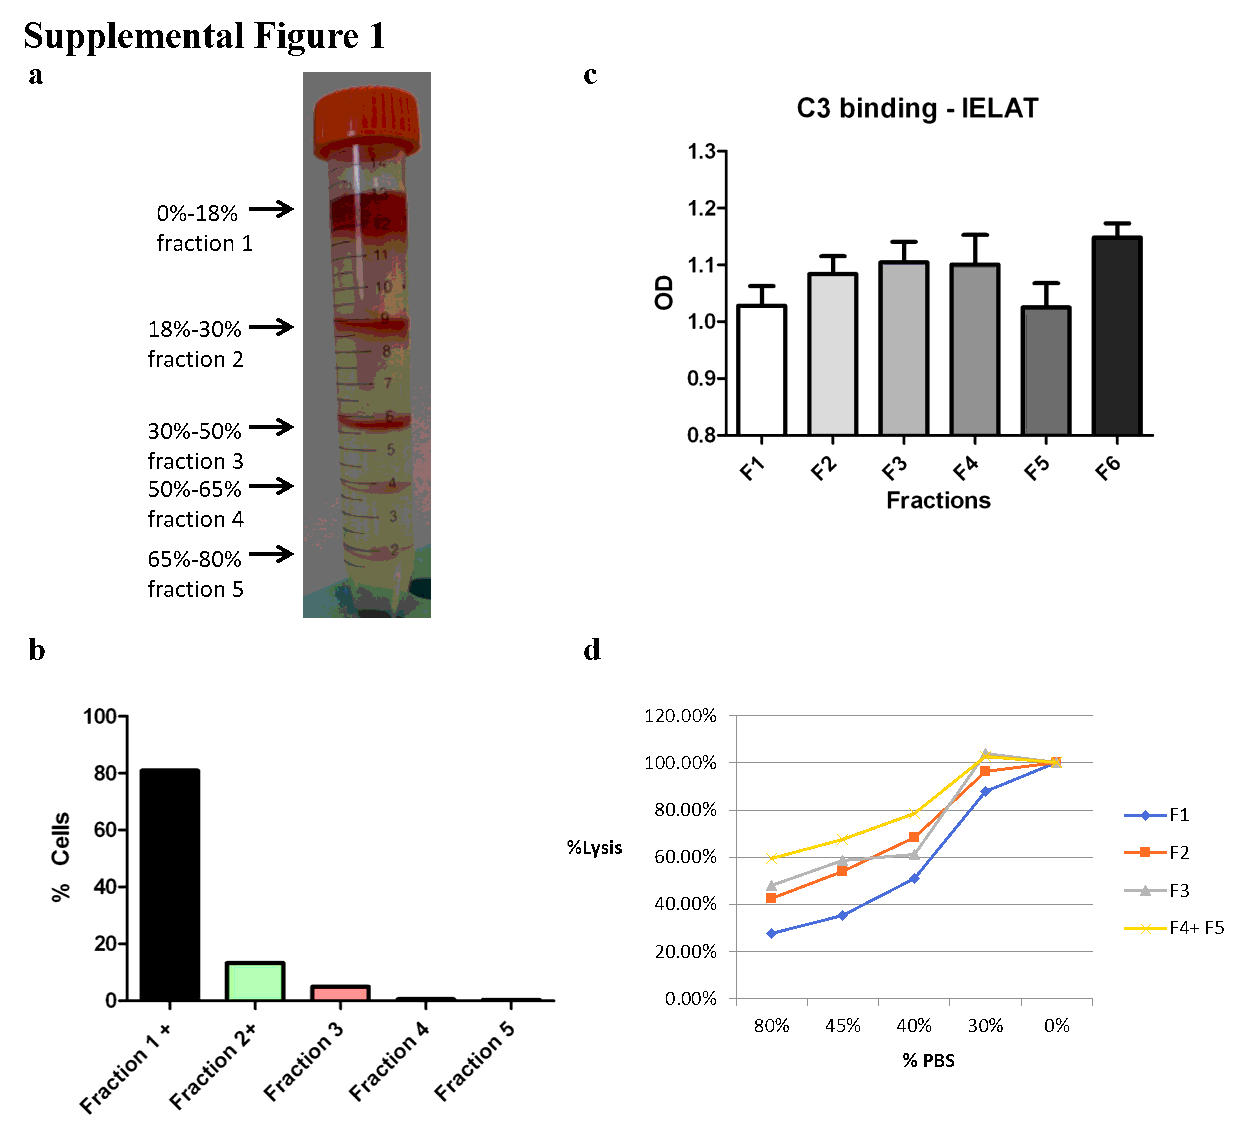
Gravity Percoll fractionation of erythrocytes
Erythrocytes were washed in PBS then SAH buffer (2.63 g/L BSA (Biosera), 132mM NaCl, 4.6mM KCl, 10mM HEPES, pH 7.1). Different percentages of Percoll/SAH mixtures were created by making a master mix of 97.5% density Percoll with the same salt and HEPES concentration as SAH, then diluting with SAH. The following fraction numbers indicate percentages of Percoll: Fraction 1, <18%; Fraction 2, 18-30%; Fraction 3, 30-50%; Fraction 4, 50-65%; Fraction 5, 65-80%; Fraction 6, 80-90%; Fraction 7, 90-97.5%. For layering the fractions by gravity, the highest desired density of Percoll/SAH is added to an empty 15ml Falcon™ tube and 1 ml of erythrocyte/SAH mixture gently layered on top. Consecutive layers of lower density Percoll is applied directly on top of the erythrocyte/SAH mixture. No centrifugation is required. Fractions of erythrocytes rise to the interphases of various Percoll layers applied. Fractionated erythrocytes are extracted from each layer into fresh tubes and washed in PBS well before analysis.
Erythrocyte fragility assay
Washed erythrocyte samples were tested for fragility based on protocol provided in by Blasi and colleagues (46).
Erythrocyte C3 deposition assay
A sensitive, quantitative indirect enzyme-linked antiglobulin test (IELAT) was employed to test for C3 (Abcam) deposition on erythrocytes (47).
RBC ghost preparation
Washed RBC were subjected to ice cold hypotonic lysis in 20 mM Tris, pH 7.6 and protease inhibitor (05056489001, Roche) (31). Lysates were washed three times in hypotonic lysis buffer (37000 g, 4°C, 30 minutes) before resuspension in minimal hypotonic lysis buffer. Protein concentrations were determined by protein BCA assay (23227, Pierce).
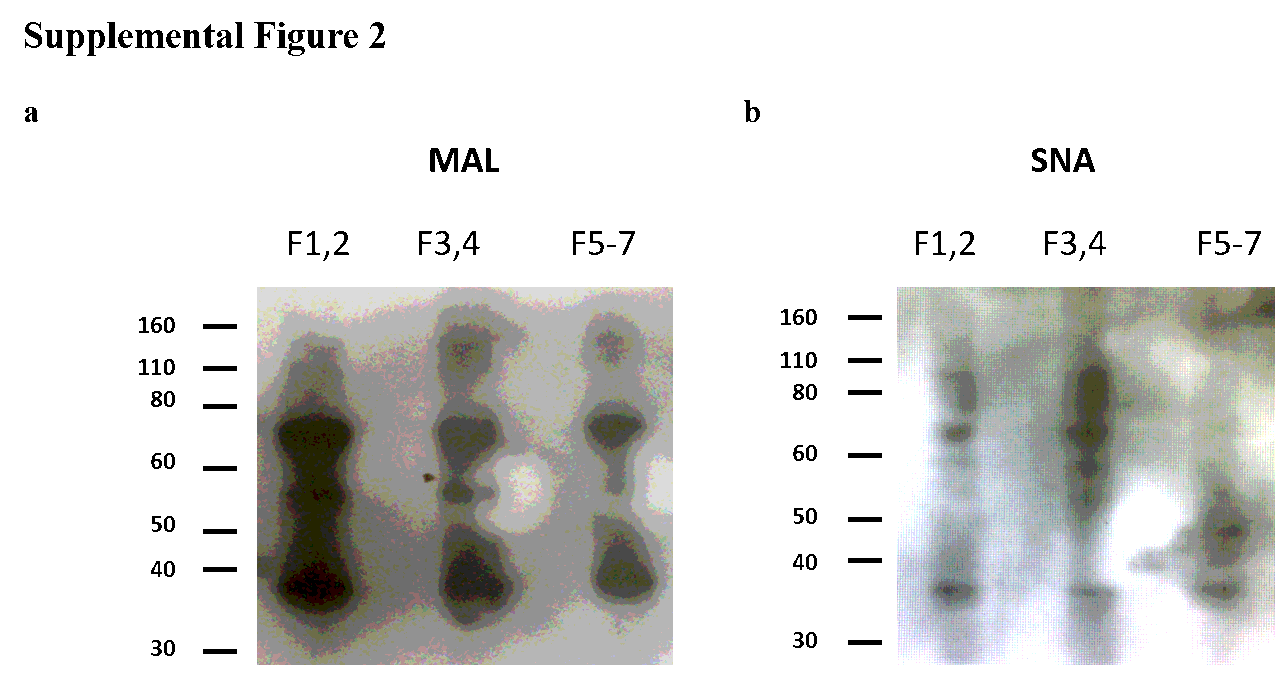
Lectin Western blot
Ghost preparations were mixed in equal volumes with SDS sample buffer containing 8M urea (31) and heated at 100°C for 10 minutes. Ghost protein samples were fractionated by gel electrophoresis using NuPage 4-12% Bis-Tris gel (Invitrogen, NP0312BOX) and transferred by Western blotting (30V, 1 hour) to polyvinylidene fluoride membrane (P 0.45 µm; 10600023 Amersham Hybond, GE Healthcare). Blots were probed with biotinylated MAL (0.2µg/ml) or SNA (2µg/ml) lectin (Vector Laboratories) and Streptavidin HRP (1:2500 dilution, 3999S, Cell Signalling) in calcium binding buffer (10mM HEPES, 150mM NaCl2, 2.5mM CaCl2, pH 7.4) containing 1x Carbo-Free Blocking Solution (Vector Laboratories, SP-5040) and protease inhibitor cocktail (11836145001, Roche) before development in Amersham ECL Select substrate (RPN2235, GE Healthcare). 0.1% Tween-20 was added in probing and washing steps. Loading of wells was normalized by protein concentration (~6 µg per sample).
Reactive Oxygen Species (ROS) Production
Rate of ROS production was determined by loading purified oxidized or untreated RBC with oxidation sensitive dye CM-H2DCFDA (10 µM; C6827, Molecular Probes) in PBS and incubating for 60 minutes in the dark at 37oC. RBC were then washed three times, resuspended in DMEM (Thermo Fisher) and fluorescence determined immediately by spectrofluorimeter (Fluostar Optima; BMG Labtech), with excitation of 485 nm and emission 530 nm. The rate of ROS formation was calculated for the linear portion of the fluorescence/time curve generated over six hours, which typically lasted for three hours.
Glycomic analysis
Structural analysis was performed as described previously (48). Briefly, ghost membranes were subjected to sonication in the presence of CHAPS detergent, reduced in 4 M guanidine-HCl (Pierce), carboxymethylated, and digested with trypsin. The digested glycoproteins were then purified by Oasis Plus HLB Sep-Pak (186000132, Waters Corp.). N-glycans were released by peptide N-glycosidase F (E. C. 3.5.1.52; Roche Applied Science) digestion, while O-glycans were released with reductive elimination (55 mg of KBH4/mL in 0.1 M KOH). Released N- and O-glycans were permethylated using the sodium hydroxide procedure and purified by C18-Sep-Pak.
Matrix-assisted laser desorption ionization-time of flight MS (MALDI-TOF MS) and MALDI-TOF/TOF MS/MS were performed for the analysis of permethylated glycans. MS data were acquired using either a 4800 MALDI-TOF/TOF (Applied Biosystems) mass spectrometer. MS/MS data were acquired using a 4800 MALDI-TOF/TOF mass spectrometer. Permethylated samples were dissolved in 10 μl of methanol, and 1 μl of dissolved sample was premixed with 1 μl of matrix (10 mg/ml 3,4-diaminobenzophenone in 75% (v/v) aqueous MeCN), spotted onto a target plate, and dried under vacuum. For the MS/MS studies, the collision energy was set to 1 kV, and argon was used as collision gas. The 4700 Calibration standard kit, Calmix (Applied Biosystems), was used as the external calibrant for the MS mode, and [Glu1] fibrinopeptide B human (Sigma) was used as an external calibrant for the MS/MS mode.
The MS and MS/MS data were processed using Data Explorer 4.9 Software (Applied Biosystems). The processed spectra were subjected to manual assignment and annotation with the aid of a glycobioinformatics tool, GlycoWorkBench (49). The proposed assignments for the selected peaks were based on 12C isotopic composition together with knowledge of the biosynthetic pathways. The proposed structures were then confirmed by data obtained from MS/MS experiments.