2.1. Materials
ZOL was purchased from CTTO Medicine Co., Ltd. (Nanjing, China). Mannosamine-palmitic acid was obtained from Nayuansu Biological Technology Co., Ltd. (Shanghai, China). DOX was purchased from Macklin Co., Ltd. (Shanghai, China). Soyabean phosphatidylcholine (SPC) was supplied by Lipoid GmbH (Ludwigshafen, Germany). Distearoyl phosphoethanolamine-PEG2000 (DSPE-PEG-2000) and cholesterol were purchased from A.V.T Pharmaceutical Co., Ltd. (Shanghai, China). RPMI Medium Modified, Penicillin-Streptomycin Solution, and Phosphate Buffered Saline (1X) were obtained from HyClone (USA). FITC Mouse lgG2b κ lsotype Control, FITC MOUSE Anti-Human (CD68), PE Mouse Anti-Human MSR1 (CD204), PE-Cy5 conjugated mouse/primate immunoglobulin G1 κ chain antibody, PE-Cy5 conjugated Anti-Human (CD206), and PE Mouse IgG1 κ Isotype Control RUO were purchased from BD BIOSCIENCES (San Diego, USA). Anti-GAPDH antibody, Anti-Mannose Receptor antibody, and Anti-Liver Arginase antibody were purchased from Abcam (Cambridge, UK). Dulbecco’s modified Eagle medium (DMEM), fetal bovine serum (FBS), 3-(4,5-Dimethylthiazol-2-yl)-2,5-diphenyltetrazolium bromide (MTT), penicillin G sodium, and streptomycin sulfate were obtained from Gibco BRL (Gaithersburg, USA). Other chemicals and solvents were all of analytical grade, and purified water was produced by a Millipore water purification system.
2.2. Cell culture and animals
Human mononuclear macrophages (THP-1) and human triple-negative breast cancer cell line (MDA-MB-231) were purchased from Type Culture Collection of the Chinese Academy of Sciences, Shanghai, China.
Four to six-week-old female BALB/c nude mice weighing 16–18 g were purchased from Zhejiang University Animal Laboratory (Hangzhou, China). The animals were housed in cages and had free access to tap water and standard laboratory food throughout experiments.
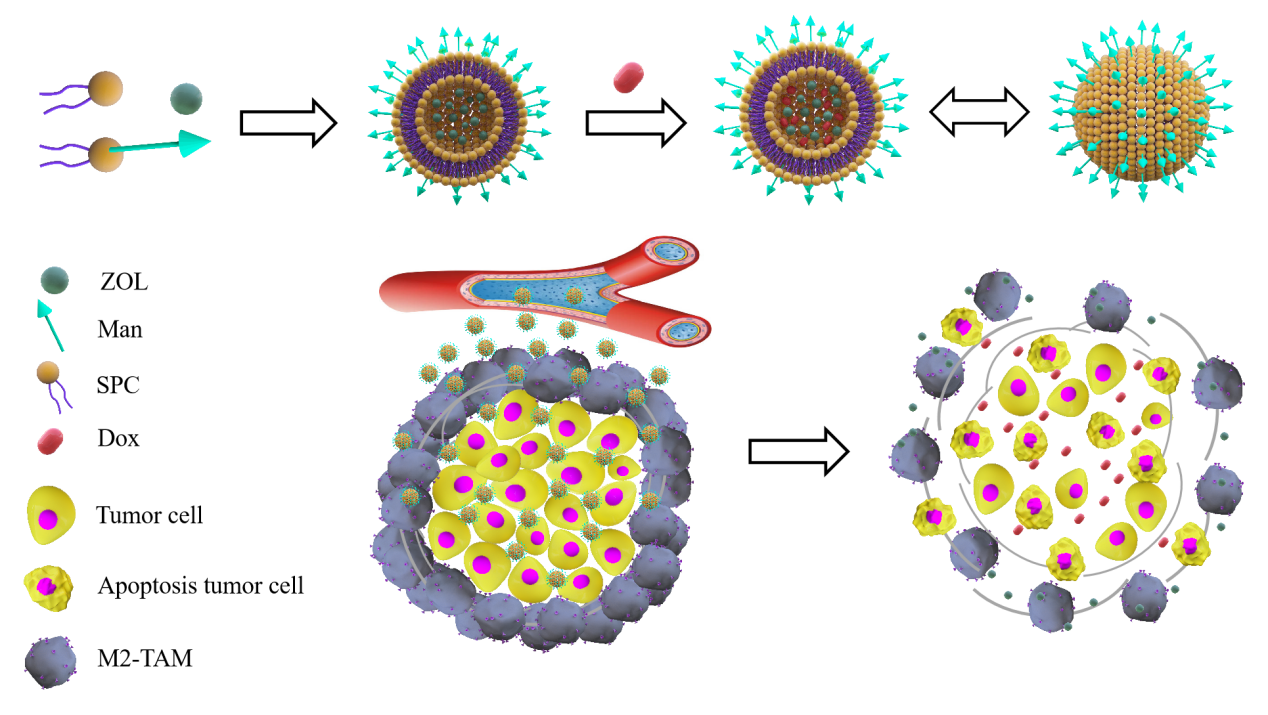
2.3. Preparation of LP and Man-LP
The ethanol injection method was used to prepare blank liposome (LP), and Man modified liposome (Man-LP) [26]. First, 200 mg of soy lecithin, 60 mg of cholesterol, 45 mg of DSPE-PEG2000, and 4.00 mg of mannosamine-palmitic acid were dissolved in ethanol and stirred in a water bath at 65°C. Following that, they were injected into water at a rate of 0.5 mL/s and stirred at 65°C for 20 min. After sonication for 8 min (200W×2 min, 400 W×6 min), the initially formed liposome was passed through microporous membranes of 0.80, 0.45, and 0.22 µm to obtain Man-LP. LP was prepared in the same manner without mannosamine-palmitic acid.
2.4. Preparation of LP@ZOL/DOX, Man-LP@ZOL, and Man-LP@ZOL/DOX
Based on ethanol injection method, DOX was actively encapsulated by ammonium gradient method to realize co-loading of the two drugs in liposomes. First, 600 mg ZOL was added to 2 mL of water and stirred until dispersion. Following that, 275 µL of ammonia water with a concentration of 14.9 mol/L was slowly added dropwise to completely dissolve ZOL. The resultant solution was dissolved to 10 mL to obtain (NH4)2Zol solution. A mixed solution of 0.5 mL of (NH4)2ZOL solution and 9.5 mL of 0.2 mol/L (NH4)2SO4 solution was stirred as a hydration medium for liposome preparation, followed by heating at 65°C water baths. Subsequently, 200 mg of soy lecithin, 60 mg of cholesterol, 45 mg of DSPE-PEG2000, and 4.00 mg of mannosamine-palmitic acid were dissolved in ethanol and stirred at 65°C. Then, they were injected into the hydration medium or (NH4)2Zol solution at a rate of 0.5 mL/s and stirred at 65°C for 20 min. After sonication for 8 min (200W×2 min, 400 W×6 min), the product passed through microporous membranes of 0.80, 0.45, and 0.22 µm to obtain Man modified ZOL liposome (Man-LP@ZOL). Man-LP@ZOL and 5.0 mg/mL doxorubicin solution were mixed according to the weight ratio of 1:10 and incubated at 60°C with stirring. After 20 min, they were taken out and placed at room temperature to terminate drug loading. Finally, Man-LP@ZOL/DOX was purified using centrifugation. LP@ZOL/DOX was prepared in the same manner without mannosamine-palmitic acid.
2.5. Characterization
The size distribution, polydispersity index (PDI), and Zeta-potential of liposomes were measured using Malvern ZEN 3690. Transmission electron microscopy (TEM) image of Man-LP@ZOL/DOX was obtained using a transmission electron microscope (H-7650, Hitachi, Japan), using 2% phosphotungstic acid solution negative staining [27].
Encapsulation efficiency (EE%) and drug loading (DL%) were determined according to a previously reported method. Briefly, 1 mL of liposome dispersions was eluted with PBS (pH 7.4) through Sephadex G-100 column to remove unloaded ZOL. The entrapped ZOL was determined by disrupting liposome dispersions with ethanol (the ratio of volume of methanol to liposome was 5:1). ZOL in liposome was measured using high-performance liquid chromatography (HPLC). After that, 1 mL of liposome was demulsified by 90% isopropanol (containing 0.75 mol/L HCl) and diluted to 10 mL. The absorbance of DOX in liposome was measured at 480 nm wavelength, and drug concentration was calculated. The encapsulation efficiency and drug loading of ZOL and DOX were estimated by Eqs. (1) and (2) [27, 28].
EE%=( W drug / W total )×100% (1)
DL%=( W drug / W LP )×100% (2)
W drug is the measured amount of drug (ZOL or DOX) in the liposome suspension; Wtotal is the weight of ZOL or DOX in the equal volume of liposome suspensions; Wdrug is the measured weight of liposome lyophilized powder.
2.6. Induction and identification of M2-TAMs
THP-1 cells were cultured in a 1640 complete medium containing 0.05 mM β-mercaptoethanol at 37 ℃ in 5% CO2 incubator. THP-1 cell concentration was adjusted to 1×10⁶ cells/mL with Mφ-type cell induction solution composed of serum-free 1640 medium, 100 ng/mL PMA, and 0.3% BSA. After 48 h of being cultured, non-adherent cells were centrifuged. Then, the cells were cultured with adherent cells in the original flask with Mφ-type cell induction solution. The cells were observed, and Mφ-type cell induction medium was repeatedly replaced every 48 h. After 14 days of induction, the cells (suspended and adherent cells) were cultured with M2 cell induction solution composed of serum-free 1640 medium and 20 ng/mL IL-4. After 48 h of induction, the cell culture medium was replaced with 1640 complete medium. After 48 h, M2-TAMs cells were collected and randomly divided into CD68, CD206, CD204 groups [29]. A total of 3 µL CD68 antibodies were added to the CD68 group, 10 µL CD206 antibodies were added to the CD206 group, and 10 µL CD204 antibodies were added to the CD204 group. After incubating for 30 min, the cells were washed twice with PBS to remove unbound antibodies and were detected using a flow cytometer (Accuri C6, BD, USA).
2.7. Cellular uptake and intracellular disposition
M2-TAMs in logarithmic growth phase were seeded in 6-well plates at 5×10⁵ cells/well in 5% CO2 at 37 ℃ for 24 h. After that, cells were treated with FITC-labeled LP and FITC-labeled Man-LP (3 µmol/L FITC) or blank serum-free culture medium at 37 ℃. After 1 h, cells were washed three times with PBS, then trypsinized and collected by centrifugation. The mean fluorescence intensity (MFI) was determined using a flow cytometer (Accuri C6, BD, USA). Next, confocal laser scanning microscopy (CLSM, Zeiss LSM880, Carl Zeiss, Germany) was applied to identify intracellular localization of FITC-labeled liposomes in cells. M2-TAMs cells were incubated in sterile glass-bottom dishes at a density of 1×10⁵ cells/well and cultured in 5% CO2 at 37 ℃ for 12 h. Following that, cells were treated for 4 h with a culture medium containing FITC-labeled LP or FITC-labeled Man-LP at a FITC concentration of 3 µmol/L. After three washes with PBS, the cells were stained with Hoechst 33342 and fixed with 4% (v/v) paraformaldehyde. The sterile glass dish was placed under CLSM to observe the fluorescence signal.
2.8. In vitro cytotoxicity
The MTT assay was utilized to evaluate the cytotoxicity of drug-free carriers and drug loading liposomes on MDA-MB-231 cells. Briefly, the cells were seeded in 96-well plates at a density of 8×10³ cells/well, and cultured overnight at 37 ℃. The cells were then treated with a serum-free culture medium containing drug-free carriers or drug loading liposomes at different concentrations for 48 h. The cells were incubated with a culture medium mixed with MTT (5 mg/mL) for 4 h. After discarding the supernatant, precipitates were dissolved in 150 mL DMSO, and the absorbance of the resulting solution was measured at a wavelength of 570 nm using a microplate reader (Synergy TM2, BIO-TEK Instruments Inc. USA) [30].
2.9. Effect to invasion
The transwell method was used to detect the effect of Man-LP, ZOL, and Man-LP@ZOL on MDA-MB-231 cell invasion. First, the matrigel and serum-free medium were mixed at a ratio of 1:3. They were spread evenly to the bottom of transwell inserts (Corning, USA) and incubated overnight at 37 ℃. Next, MDA-MB-231 cells were seeded into transwell inserts at a density of 1×10⁵ cells/well, while M2-TAMs were seeded into transwell plates at a density of 2×10⁵ cells/well, constructing a non-contact co-cultivation system. The transwell plate of control group was not seeded with M2-TAMs. The cells were then cultured in a serum-free culture medium containing Man-LP, ZOL, Man-LP@ZOL, or an equal amount of PBS. The control group was cultured in a serum-free medium. After 24 h, matrigel and MDA-MB-231 cells at the inner of transwell inserts were wiped. The cells passed through transwell inserts were fixed with 4% paraformaldehyde for 10 min and then stained with 0.1% crystal violet solution for 30 min. The stained cells were taken pictures of cells that have invaded the lower layer [31].
2.10. Effect to expression of Arg1 and CD206
M2-TAMs cells in the logarithmic growth phase were seeded in plates in 5% CO2 at 37 ℃ for 24 h. The cells were then cultured in a serum-free medium supplemented with Man-LP, ZOL, Man-LP@ZOL, or PBS. After 48 h, the cells were harvested and lysed in RIPA buffer with protease inhibitors (PMSF). BCA kit (Solarbio Cat, China) was used for quantitative analysis of protein. Equal amounts of total proteins were separated in a polyacrylamide gel containing 5% sodium dodecyl sulfate and transferred to a polyvinylidene fluoride membrane (GE Healthcare Life, USA). Next, the membranes were blocked in 5% nonfat powder and incubated with primary antibodies (Anti-GAPDH, Anti-Arg1, Anti-CD206) at 4 ℃ overnight. After washing with TBS containing 0.1% Tween 20, the membranes were incubated with secondary antibodies for 2 h at room temperature. After the reaction, the membranes were washed three times with TBS containing 0.1% Tween 20. The protein bands were visualized using ECL Chemiluminescence Analyzer (Clinx Science Instruments, Shanghai) [32, 33].
2.11 In vivo anti-tumor study
In vivo anti-tumor study was conducted on breast cancer tumor xenograft mice established by subcutaneously injecting MDA-MB-231 and M2-TAMs cells into BALB6 female mice. When the tumor grows to 80 mm3, the tumor xenograft mice were randomly divided into PBS group (control group), ZOL + DOX group, LP@ZOL/DOX group, and Man-LP@ZOL/DOX group. Man-LP@ZOL/DOX at a dose of 3 mg DOX-equivalent/kg and 0.3 mg ZOL-equivalent/kg body weight (or PBS) was intravenously administrated daily. Body weight and tumor size were recorded at 1, 4, 7, 9, 11, and 14 days. Six mice of each group were killed on day 14, and tumor tissues were collected and weighted. The tumor volumes and tumor growth inhibition rate (IR%) were calculated by Eqs. (3) and (4) [34].
V=(a×b 2 )/2 (3)
IR% = (1- W Tre / W Con )×100% (4)
Regarding the formulas, a, b, WTre and WCon refer to the maximum diameter of tumor, the minimum diameter of tumor, the mean tumor weight of treated groups, and the mean tumor weight of the control group, respectively.
2.12 Immunohistochemistry Staining
After the in vivo anti-tumor study, the removed tumors were sectioned for pathological analysis. Paraffin-embedded tumor tissue sections were histochemically stained with hematoxylin or immunohistochemically stained with fluorescein-labeled antibodies (CD68 and CD206). Images were captured using a photomicroscope (ECLIPSE E100, Nikon, Japan), and assessment of intensity or cumulative optical density (IOD) was completed using Image-Pro Plus 6.0 software.