Plant collection and extraction
Acacia jacquemontii leaves were collected from district Bhakkar near Bahawalpur Pakistan. The plant was authenticated by Cholistan institute of desert studies (CIDS) from the Islamia University of Bahawalpur, Pakistan, with voucher number CIDS/ IUB-1901/63. Leaves were cleaned, air dried under shade and finally were grounded into coarse powder using an electric grinder. About 100 gm of powdered material was macerated with ethyl acetate as ratio of 1:4 (W/V) at room temperature with occasional shaking and stirring for 7 days. After that whole mixture was filtered through filter paper and then was concentrated by using a rotary evaporator.
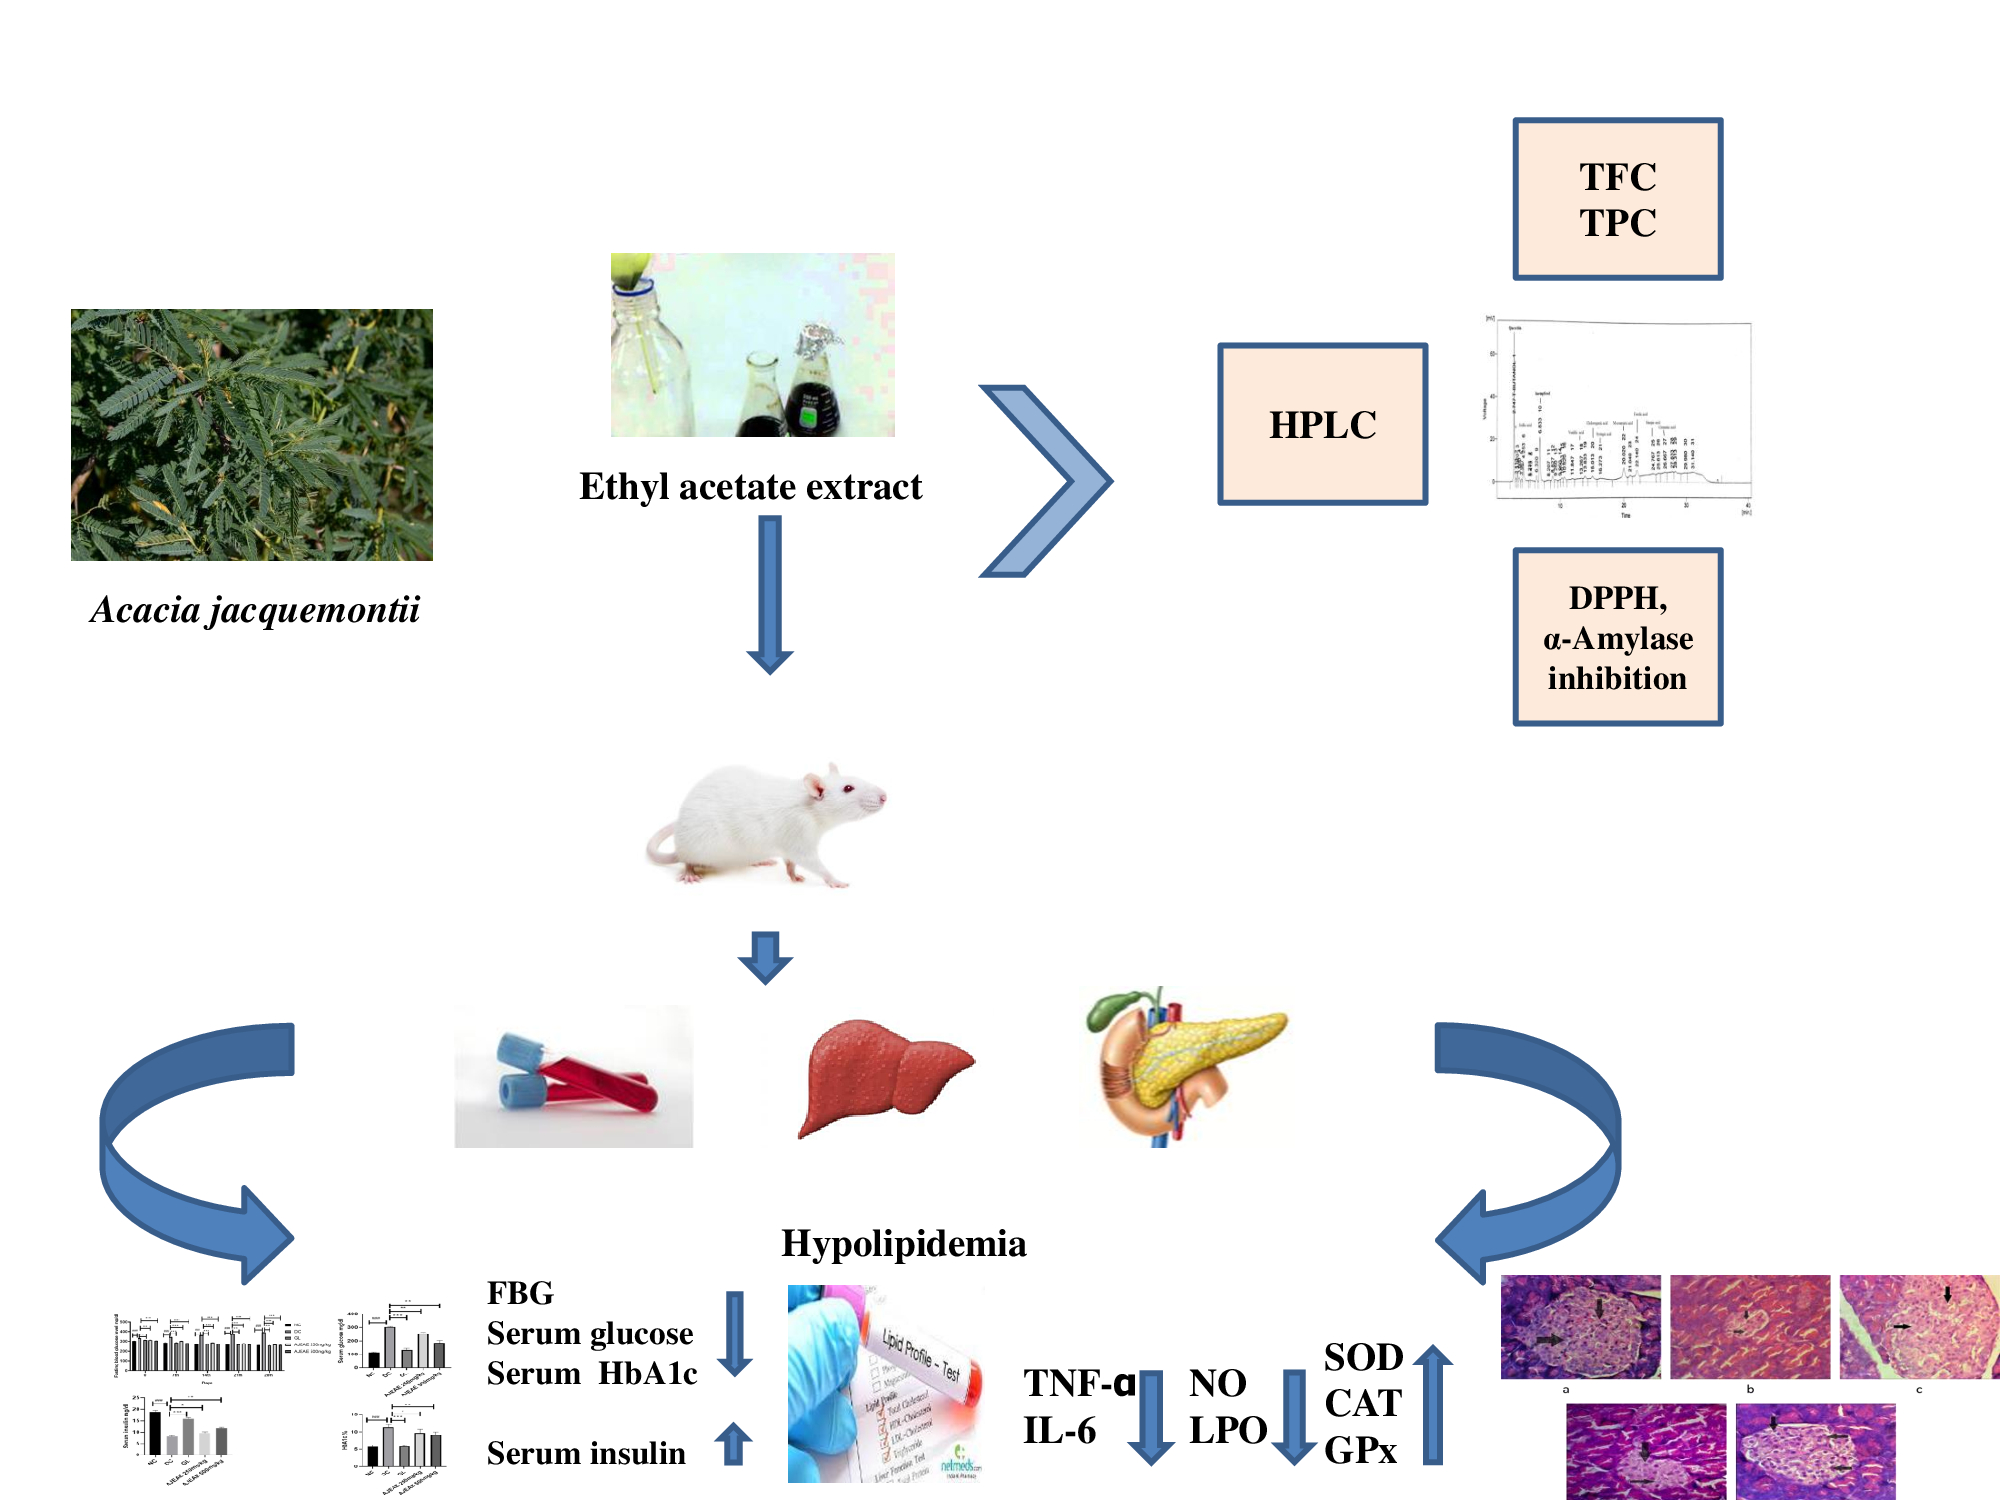
Characterization of AJEAE using HPLC
High performance liquid chromatography (HPLC) analysis was performed for detection of bioactive compounds. Stationary phase C18 (5.0 μM) 25 cm × 4.6 mm) and SIL-20A auto sampler (Shimadzu Scientific Instruments, Kyoto, Japan) were used. Combination of acetic acid and acetonitrile was used as mobile phase. The flow rate used for analysis was 1 mL/min. UV–visible detector (SPD-10AV) was used for detection of bioactive compound at the wavelength of 280 nm. Identification and quantification was done by comparison with standards (Imtiaz et al. 2019).
Evaluation of total phenolic and total flavonoid content in AJEAE
The total phenolic content (TPC) was estimated by using Folin-Ciocalteu method. After preparation of reaction mixture, absorbance was measured at 760 nm wavelength and results were presented as mg GAE/g (Aryal 2019).The total flavonoid content (TFC) was assessed by Aluminiun chloride colorimetric method. The absorbance was measured at 510 nm wavelength and results were displayed as mg QE/g of DW (Phuyal et al. 2020).
Evaluation of in vitro antioxidant activity (DPPH Assay)
The free radical scavenging activity of AJEAE was measured using DPPH as a free radical model (Mogole et al. 2020; Ashraf et al. 2015). Different concentrations of plant extract (0.125-1 μg/mL) were prepared. 1ml of plant extract was mixed with 3ml of 5 μg/mL DPPH and then incubated in the dark. Ascorbic acid was used as standard, absorbance was taken at 515 nm using spectrophotometer and activity was measured by using the formula below:
% Inhibition = A blank—A sample/A blank 𝑥 100
In vitro ꭤ-amylase inhibition assay
Alpha-amylase inhibitory assay was done to check the in-vitro antidiabetic activity of AJEAE (Sangeetha and Vedasree2012; Sathasivampillai et al. 2017). 100 μL of plant extract was allowed to react with 100 μL of 2 mM of phosphate buffer and 200 μL of α-amylase enzyme. The reaction mixture was allowed to incubate for 20 min and then added 100 μL of starch solution (1%). The similar protocol was carried out for the controls where buffer was used instead of the enzyme. After 5 minutes of incubation, dinitro-salicylic acid reagent (500 μL) was mixed in control and test, and then placed in boiling water bath for at least 5 min. The absorbance was measured at 540 nm using spectrophotometer. The inhibitory activity was found by using the equation given below:
% Inhibition = Absorbance of the control ₋ Absorbance of the test sample/ Absorbance of the control 𝑥 100
Experimental animals and ethical statements
Seventy five albino wistar rats (180-200 g body weight) were caged in the animal house of Institute of Physiology and Pharmacology, University of Agriculture Faisalabad. Before start of trail, all rats were acclimatized for 2 weeks. Experimental protocol was planned according to laboratory animal care guidelines permitted by Graduate studies Research Board, UAF Pakistan. Ethical certificate was issued by institutional biosafety and bioethics committee with letter no. 1739/ORIC for the conduct of in-vivo experiment. Following to the adaptation time, all rats were allocated into five groups, each group having 15 rats.
Induction of experimental diabetes
Alloxan mono-hydrate (i.p) in 0.9% w/v NaCl was used to induce diabetes (150mg/kg of BW) in all groups except the normal control group. Subsequent to 1st week of the study, glucose levels were measured from all rats according to tail vein method using On-Call Plus (catalogue # G113-214√) glucometer. For this study, diabetic rats were selected based on the blood glucose level higher than 300mg/dl.
Treatment protocol and sample collection
All rats were divided into following groups (n = 15/group).Group1: Normal Control (NC) = Daily Routine diet + water ad-libitum, Group 2: Diabetic control (DC), Group 3: Treated with Glibenclamide (GL; 10 mg/kg), Group 4: Treated with AJEAE (250 mg/kg), Group5: Treated with AJEAE (500 mg/kg). After completion of 28th day of study, all rats were made overnight fast, anaesthetized (i.p. 3% sodium pentobarbital) and then sacrificed. Blood samples were obtained, then centrifuged at 4000rpmfor 10 minutes and obtained serum was stored at -80 ºC for biochemical studies. For histopathological analysis, pancreatic tissues were preserved in 10% NBF solution. For biochemical investigations, tissue homogenates were prepared by homogenizing the pancreatic and hepatic tissues in buffer solution containing 50 mMTris-HCl & 1.15% KCl.
Estimation of serum glycemic markers
Fasting blood glucose level (FBG) was measured on the 0, 7, 14, 21and 28thday of the study via tail prick method by using On-Call Plus (catalogue # G113-214√) glucometer. After completion of trial, serum glucose levels of all groups were measured by using rat glucose assay kit of Crystal Chem, USA # 81693. Serum insulin levels were estimated by using ELISA kit (Thermo Fisher Scientific Catalog# ERINS). Glycosylated hemoglobin (HbA1c) was assessed byELISA kit (Rat HbA1c ELISA kit catalog # MBS2509196).
Estimation of serum lipid profile
Triglycerides (TG), high density lipoprotein (HDL), low density lipoprotein (LDL), total cholesterol (TC) and very low density lipoprotein (VLDL) were measured using previously described method (Arise et al. 2014).
Estimation of serum inflammatory markers
Serum cytokines (TNF-α, IL-6) were measured by commercially available ELISA kit (RayBio® Rat, RayBiotech, Norcross, GA, USA) according to instruction of manufacturer.
Estimation of oxidative stress markers
Oxidative stress was assessed by estimation of lipid peroxidation (malondialdehyde; MDA), nitric oxide (NO), catalase (CAT), glutathione peroxidase (GPx) and superoxide dismutase (SOD) levels in pancreatic and hepatic tissue homogenates using previously defined methods (Eslamiet al. 2015; Rotruck et al. 1973; Takahara et al. 1960; Ohkawa et al.1979; Green et al. 1982).
Histopathological analysis
For histopathological analysis, portions of pancreatic tissues were fixed in formalin (10%) for 1 day. Following the fixation, tissues were dehydrated and paraffinized in wax. Serial section were made via microtomy and stained with H&E dyes for microscopic examination (IRMECO GmbH & Co, no: IM-91) at magnification power of 40x and snapped using a digital camera.
Statistics
All data represents at least three autonomous experiments and results were showed as mean ± S.E. Statistically data were analyzed by analysis of variance (ANOVA) followed by Duncan multiple ranges (Graph Pad Prism Software, version 8.0.1, 244). All p values < 0.05 were considered as statistically significant.