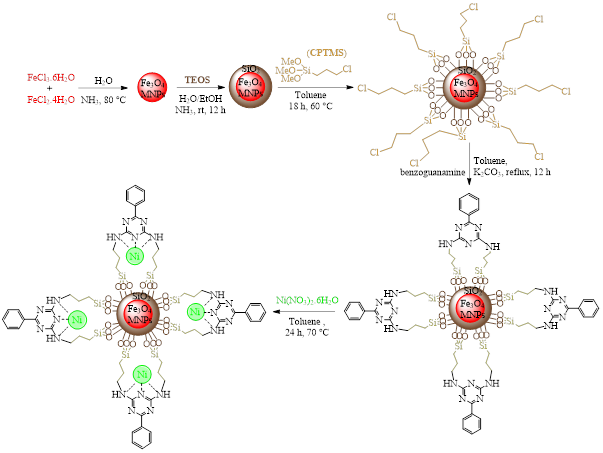
Synthesis of the Ni-supported nano-catalyst
The Ni-supported nanoparticle catalyst was obtained via synthesis of the Fe3O4 magnetic nanoparticles. In order to prevent agglomeration of magnetic nanoparticles, the particles are coated with TEOS. This covering stabilizes the magnetite nanoparticles in two various ways. On the one hand, is by shielding the magnetic dipole interaction with the silica shell. On the other hand, the silica nanoparticles are negatively charged. Therefore, the silica covering enhances the coulomb repulsion. Next step is the magnetic nanoparticles functionalization with CPTMS and BGA ligand, and then complexation with Ni(NO3)2.6H2O.
Characterization of the Ni-supported nano-catalyst
Formation of the Ni-supported nano-catalyst was verified by the inductively coupled plasma (ICP), FT-IR, X-ray diffraction (XRD), dispersive X-ray spectroscopy (EDX), scanning electron microscope (SEM), transmission electron microscope (TEM), thermo-gravimetric-differential thermal analysis (TGA-DTA), vibrating sample magnetometer (VSM) and BET (Brunauer-Emmett-Teller) measurements.
Characterization of the Ni-supported nano-catalyst by ICP
The ICP analysis of the catalyst showed that the Ni content of Fe3O4@SiO2@CPTMS@ BGA@Ni is about 49.7%.
Characterization of the Ni-supported nano-catalyst by FT-IR
Figure 1 presents the four FT‐IR spectra of A: Fe3O4@SiO2, B: Fe3O4@SiO2@CPTMS, C: Fe3O4@SiO2@CPTMS@BGA and D: Fe3O4@SiO2@CPTMS@BGA@Ni. Curve A displays two basic characteristic peaks at approximately about 583 and 1091 cm-1 which are attributed to the presence of the Fe-O and Si-O stretching vibrations, respectively to indicate the silica coated magnetite nanoparticles. Curve B shows a new peak at about 636 cm-1 indicating presence of the C-Cl bond. Curve C shows three new peaks at 1416, 1674 and 3380 cm-1 which respectively are attributed to the C-C, C=N and N-H bonds, to refer to the BGA ligand in Fe3O4@SiO2@CPTMS@BGA. And finally, the curve D shows shifts from 3380 to 3512 and from 1674 to 1515 cm-1 which are related to the new interactions of nickel with the nitrogen-containing ligand. Consequently, comparison of the IR spectra confirms the successful stages of the Ni-supported nano-catalyst.
Characterization of the Ni-supported nano-catalyst by XRD
Figure 2 shows the XRD patterns of A (Fe3O4@SiO2, black), B (Fe3O4@SiO2@CPTMS, green), C (Fe3O4@SiO2@CPTMS@BGA, blue) and D (Fe3O4@SiO2@CPTMS@BGA@Ni, purple). The XRD pattern exhibited peaks at about 2θ = 18.5°, 30.4°, 35.7°, 43.5°, 53,8°, 57.6°, 63° and 74.7° confirm the spinal structure of Fe3O4 MNPs. Appearance of the new peaks at 2θ = 12.2°, 19.2°, 23.7°, 33.8°, 38°, 41°, 46.7° and 60° are attributed to the Ni species.
Characterization of the Ni-supported nano-catalyst by EDX
Figure 3 shows the EDX analysis of the Ni-supported nano-catalyst and presence of the anticipated elements in its structure, namely N (3.34 %), O (22.41 %), Si (2.99 %), Fe (11.33 %) and Ni (28.53 %).
Characterization of the Ni-supported nano-catalyst by SEM
For the investigation of the size and surface morphology of the newly prepared catalyst, SEM images were obtained as shown in Figure 4. According to these images, the sizes of the Ni-supported nano‐catalyst particles are in the nanometer ranges (between 31.7‐35.6 nm).
Characterization of the Ni-supported nano-catalyst by the SEM Mapping Images
Also, the SEM elemental-mapping images presented in Figure 5 confirm the elemental composition of the synthesized catalyst and display a nice distribution of elements on the catalyst surface.
Characterization of the Ni-supported nano-catalyst by TGA-DTA
In order to investigate the thermal stability of the Ni-supported nano-catalyst, the TGA-DTA analysis was conducted and the obtained curve is illustrated in Figure 6. The thermo gravimetric analysis curve show the three mass losses of the organic materials as they decompose upon heating. The weight loss beginning at about 85 °C could be related to the loss of water molecules, the weight loss at about 220 °C could be attributed to the decomposition of complex, and the weight loss at about 380 °C could be attributed to the decomposition of the BGA ligand.
Characterization of the Ni-supported nano-catalyst by VSM
The VSM analyses of (A) Fe3O4@SiO2, (B) Fe3O4@SiO2@CPTMS, (C) Fe3O4@SiO2@ CPTMS@BGA and (D) the Ni-supported nano-catalyst (Fe3O4@SiO2@CPTMS@BGA@Ni) were investigated in order to demonstrate their magnetic behaviors (Figure 7). As can be seen, all four compounds have magnetic properties; however, magnetization of B (43.8 emu/g), C (40.7 emu/g) and D (4.7 emu/g) were decreased to some extent in comparison with A (68.4 emu/g). This can be explained by the reduction in the dipole–dipole interactions between the magnetic nanoparticles after their coating with SiO2, functionalization with both the CPTMS and BGA ligands and the complexation with Ni(NO3)2 which cause the more coating of Fe3O4 MNPs.
Characterization of the Ni-supported complex by BET
To obtain the specific surface area, the total volume of the pores and the mean pore diameter of the Ni-supported complex, the nitrogen adsorption (uptake) and desorption analysis was performed at 77 Kelvin and Table 1 shows the results of the Brunauer-Emmett-Teller (BET) measurements.
Table 1 Results of the BET measurements of the Ni-supported complex
|
value
|
Parameter
|
|
15.885
|
as (m2/g)
|
|
3.65
|
Vm (cm3/g)
|
|
0.1275
|
Total pore volume
|
|
32.116
|
Mean pore diameter
|
The Figure 8 is a type III curve and indicates the absence of the hysteresis.
The Figure 9 is the BJH adsorption curve of the Ni-supported complex indicating that the sizes of pores are approximately between 5 and 85 nm.
Optimization of the reaction conditions
After confirmation of the new prepared Ni-supported nano-catalyst, the catalyst capability was investigated for the synthesis of diverse benzimidazoles. To achieve this goal and to find the optimal reaction conditions, the reaction of benzaldehyde and PhenDA was chosen as a model reaction. The obtained data in various temperatures, amounts of the catalyst and solvents are summarized in Table 2. The best result is obtained when the reaction is performed in the presence of 20 mg of the Ni-supported nano-catalyst in CHCl3 at reflux condition (entry 4).
Table 2 Optimization of the reaction conditions for the synthesis of 2-phenyl-1H-benzo[d]imidazole
|
Entry
|
Solvent
|
Temp. (°C)
|
Catal. amount (mg)
|
Time (min)
|
Yield (%)
|
|
1
|
C2H5OH
|
room temp
|
10
|
180
|
83
|
|
2
|
C2H5OH
|
reflux
|
10
|
60
|
85
|
|
3
|
CHCl3
|
reflux
|
10
|
40
|
82
|
|
4
|
CHCl3
|
reflux
|
20
|
30
|
95
|
|
5
|
CHCl3
|
room temp
|
20
|
120
|
84
|
|
6
|
CHCl3
|
reflux
|
no catalyst
|
120
|
Trace
|
|
7
|
n-Hexane
|
reflux
|
20
|
80
|
70
|
|
8
|
CH3CN
|
reflux
|
20
|
75
|
65
|
|
9
|
Toluene
|
reflux
|
20
|
90
|
76
|
Synthesis of diverse benzimidazoles
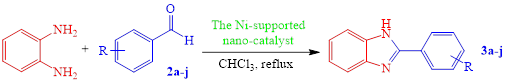
Based on the obtained results and using the optimized model reaction, the synthesis of diverse benzimidazoles (3a-j) were carried out from the reaction of PhenDA with aromatic aldehydes (2a-j) in CHCl3 by the Ni-supported nano-catalyst in reflux conditions (Table 3).
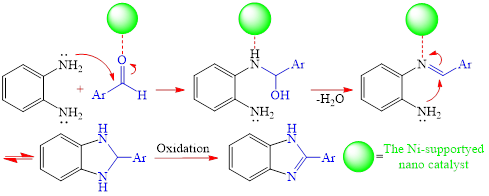
Proposed mechanism for the synthesis of diverse benzimidazoles
According to our suggested mechanism (Scheme 3), the withdrawing groups usually facilitate the reaction rates in the nucleophilic substitution reactions. They pull out the electron density of the electrophilic centers inductively or by resonance, so the electrophilic centers will become more positive, therefore the nucleophilic attack will become easier.
Reusability of the Ni-supported nano-catalyst
In another study, recyclability and reusability of the magnetic Ni-supported nano-catalyst was confirmed on the condensation of benzaldehyde and PhenDA for five runs under the optimized reaction conditions. At the end of each run, in order to dissolve and extract the desired product and unreacted starting materials and after removing the solvent, ethanol was added to the reaction mixture and heated. Thereafter, by using an external super magnet the catalyst was separated from the reaction mixture, frequently washed with ethanol, dried and reused in the next run. As illustrated in Figure 10, catalyst activity investigated is preserved after five consecutive cycles without any significant decrease in yield and reaction time.
Comparison of the catalyst activities
Table 4 shows the comparison of the previous methods (entries 1-10) used for the synthesis of benzimidazoles with our proposed method (entry 11). In general, the disadvantages of the previous methods are: formation of by-products and impurities, tedious work-up, long reaction times and low yields, while our proposed method does not have any mentioned disadvantages, and is easy, applicable and reusable with good to high yields.
Table 4 Comparison of different methods for the synthesis of benzimidazoles.
|
Entry
|
Catalyst
|
Subject
|
Time (h)
|
Yield (%)
|
Ref.
|
|
1
|
Glycerol
|
Synthesis of benzimidazoles
|
2-3
|
70-85
|
[18]
|
|
2
|
AcOH/O2
|
Synthesis of benzimidazoles
|
0.33-1
|
52-92
|
[19]
|
|
3
|
Na2S2O5
|
Synthesis of benzimidazoles
|
16-20
|
43-73
|
[20]
|
|
4
|
[Msim]Cl
|
Synthesis of benzimidazoles
|
6-20
|
79-95
|
[21]
|
|
5
|
H2N-SO3H
|
Synthesis of benzimidazoles
|
1
|
35-69
|
[22]
|
|
6
|
Me2S+BrBr-
|
Synthesis of benzimidazoles
|
4-8
|
72-91
|
[23]
|
|
7
|
KHSO4
|
Synthesis of benzimidazoles
|
Up to 2
|
81-87
|
[24]
|
|
8
|
zeolite
|
Synthesis of benzimidazoles
|
1
|
75-94
|
[25]
|
|
9
|
(ENPFSA)
|
Synthesis of benzimidazoles
|
3-4
|
70-90
|
[26]
|
|
10
|
Cu2O
|
Synthesis of benzimidazoles
|
16
|
40-76
|
[27]
|
|
11
|
Our Method Fe3O4@SiO2@CPTMS@BGA@Ni
|
0.5-1
|
87-95
|
-
|
Biological activities
Antioxidant activity
The electron donation ability of the complexes was evaluated by bleaching of the purple-colored methanol solution of DPPH (2,2-diphenyl-1-picrylhydrazyl). Briefly, 180 μl of 0.3 μM DPPH solution and 20 μl of the synthesized complexes at different concentrations were added in a 96 well microplate, and then the samples were incubated for 30 min at 25 °C in the dark. The reduction process of free radicals was investigated by measuring the absorbance at 517 nm. Ascorbic acid was used as a positive control, while the DPPH-methanol mixture without the synthesized compounds was used as the blank control [59]. The percentage inhibition of DPPH radical (I) was calculated using the formula: %I=[1(Asample-Ablank)/Acontrol]×100, where, Asample is the absorbance of chemicals/ ascorbic acid and Ablank is the absorbance of the reaction mixture containing sample and methanol and Acontrol is the absorbance of the control sample containing DPPH and methanol. The antioxidant activity was expressed as IC50 value, which is defined as the amount of antioxidant that is required to decrease the initial DPPH concentration by 50% [60].
Evaluation of the antibacterial activity
For all the experiments one gram-positive and one gram-negative bacterium were used as Staphylococcus aureus (ATCC 33591), Escherichia coli (ATCC 35218). These strains were kept frozen at -80 °C in appropriate media with 15% of glycerol.
Minimum inhibitory concentration (MIC) determined by serial broth dilution method [60]. Stock solutions of the synthesized compounds were prepared by dissolving dry compounds in solvent to a final concentration of 10 mg/ml. The serial dilutions from the stock solution were made ranging from 5 to 0.30 mg/ml using Mueller-Hinton broth media (Abcam, UK) in 96-well microplates. A bacterial inoculum was prepared with turbidity equivalent to a 0.5 McFarland standard. The bacterial suspension containing almost 1.5×10⁸ CFU/ml was prepared from a 24 h culture plate. Serial dilutions to get the final concentration ranging from 0.3 to 5 mg/ml of chemical compounds in MHB were prepared in a 96-well plate in a volume of 100 μl. Then, 100 μl of bacterial suspension was inoculated into each well. A sterility control well and a growth control well were also studied for each strain. To determine the sensitivity of the microorganisms, ampicillin was conducted as a positive control at a starting concentration of 0.10 mg/ml in sterile water. A negative control experiment was conducted using only DMSO. The microtiter plates were incubated at 37 °C for 18 h, and the MIC values were visually determined by a microplate reader at 620 nm. The lowest concentration of each chemical compound displaying no visible growth was recorded as MIC. MIC values were determined in triplicate and repeated to confirm activity [61].
Anticancer activity assay
Human cancer cell line MG63 (osteosarcoma) was purchased from Bon Yakhteh Company, Tehran, Iran. Cells were cultured at 37 °C, and 5% CO2 in Dulbecco's Modified Eagle Medium/Nutrient Mixture F-12 (DMEM-F12, Gibco, USA) supplemented with 10% fetal bovine serum (FBS, Gibco, USA) and 1% penicillin/streptomycin. At 85% confluence, the cells were harvested using 0.25% trypsin-EDTA. Then cells were seeded at 5×10⁴ density in each well containing 100 μl DMEM-F12 medium supplemented with 10% FBS in a 96-well plate and allowed to attach for 24 h before treatment. Cells were treated with various doses of chemicals (0.3 to 5 mg) dispersed in double distilled water. The identical volume of solvent was used as a control. The effects of the chemical agents on cell proliferation were detected by MTT (3-(4,5-dimethylthiazolyl-2)-2,5-diphenyltetrazolium bromide) assay. After 24 h incubation, MTT solution (5 µg/ml) was added to each well, and the plates were incubated in a CO2 incubator for 3 h. The media was removed, and DMSO was added to each well to solubilize the formazan crystals. The optical density (OD) of each well was measured (570 nm) using a microplate reader (infinite F50, TECAN, Austria), and the growth inhibition was calculated [62]. Cytotoxicity is shown as the concentration of a compound inhibiting cell growth by 50% (IC50). All tests were carried out three times, and the mean values were recorded.
Antioxidant activity
The investigation on the antioxidant properties of chemicals was performed using the DPPH assay at six different concentrations (0.15, 0.30, 0.625, 1.25, 2.5, and 5 mg/ml). Consequently, the antioxidant activity for the catalyst at the concentration of 5 mg/ml was measured as 80%. Result showed that the antioxidant activity was significantly associated with that compound concentration (Figure 11).
Antibacterial activity
The inhibition growth (%) of the benzoguanamine-based nickel complex (nano-catalyst) were investigated at the highest concentration (5 mg/ml) against the two tested bacteria (E. coli (-) and S. aureus (+)) which was 94% and 81%, respectively.
Results showed that the catalyst could impair the growth of both the gram-positive and the gram-negative bacteria in all tested concentrations. Owing to the effect of lipopolysaccharide and other structural features of gram-negative bacterial cell walls, these pathogens are usually more resistant to antibacterial compounds. Antibacterial assay on catalyst determined an inhibitory effect at the concentration of 0.65 mg/ml and higher. Noteworthy to mention, inhibitory activity of catalyst on S. aureus was stronger than that on E. coli (Figure 12).
Anticancer activity
The present study investigated the anticancer activity of the catalyst against the MG63 cell line. The ratio of cell viability under catalyst treatment has shown a considerable decrease compared to Cisplatin as the positive control confirming its anticancer property. The IC50 value determined the growth inhibition of cancer cells, indicating that compound concentration was associated with the half inhibition of cancer cell growth (Figures 13 and 14).