3.1 Effect of chronic CORT exposure on body weight, food intake, plasma CORT and melatonin concentration.
Chronic CORT exposure leads to growth retardation, with significantly lower body weight, as compared with their control counterparts, from the 5th day of CORT injection (D5) to D11 (Fig. 1A). Interestingly, the feed intake was significantly increased on D3, D4 and D7, leading to significantly increased average daily feed intake (Fig. 1B). Both CORT (Fig. 1C) and melatonin (Fig. 1D) levels in plasma exhibited diurnal pattern in CON group (P < 0.05, one-way ANOVA), which was eliminated in CORT group. The mesors of CORT level were significantly elevated (P < 0.01) by CORT injection, while the mesors of melatonin level did not change (Table 2).
Table 2
Circadian rhythm parameters of CORT and melatonin levels in plasma, as determined by cosinor analyses.
|
Index
|
Group
|
CORT
|
melatonin
|
|
Mesor
|
CON
|
18.62 ± 0.26
|
4.37 ± 0.12
|
|
CORT
|
36.10 ± 1.45**
|
4.53 ± 0.10
|
|
Amplitude
|
CON
|
3.13 ± 0.37
|
0.87 ± 0.17
|
|
CORT
|
ND
|
ND
|
|
Acrophase (h)
|
CON
|
23.18 ± 0.46
|
18.97 ± 0.68
|
|
CORT
|
ND
|
ND
|
| Values are means ± SEM. **p < 0.01, compared with CON group. ND represents not determined as there was no circadian rhythm. |
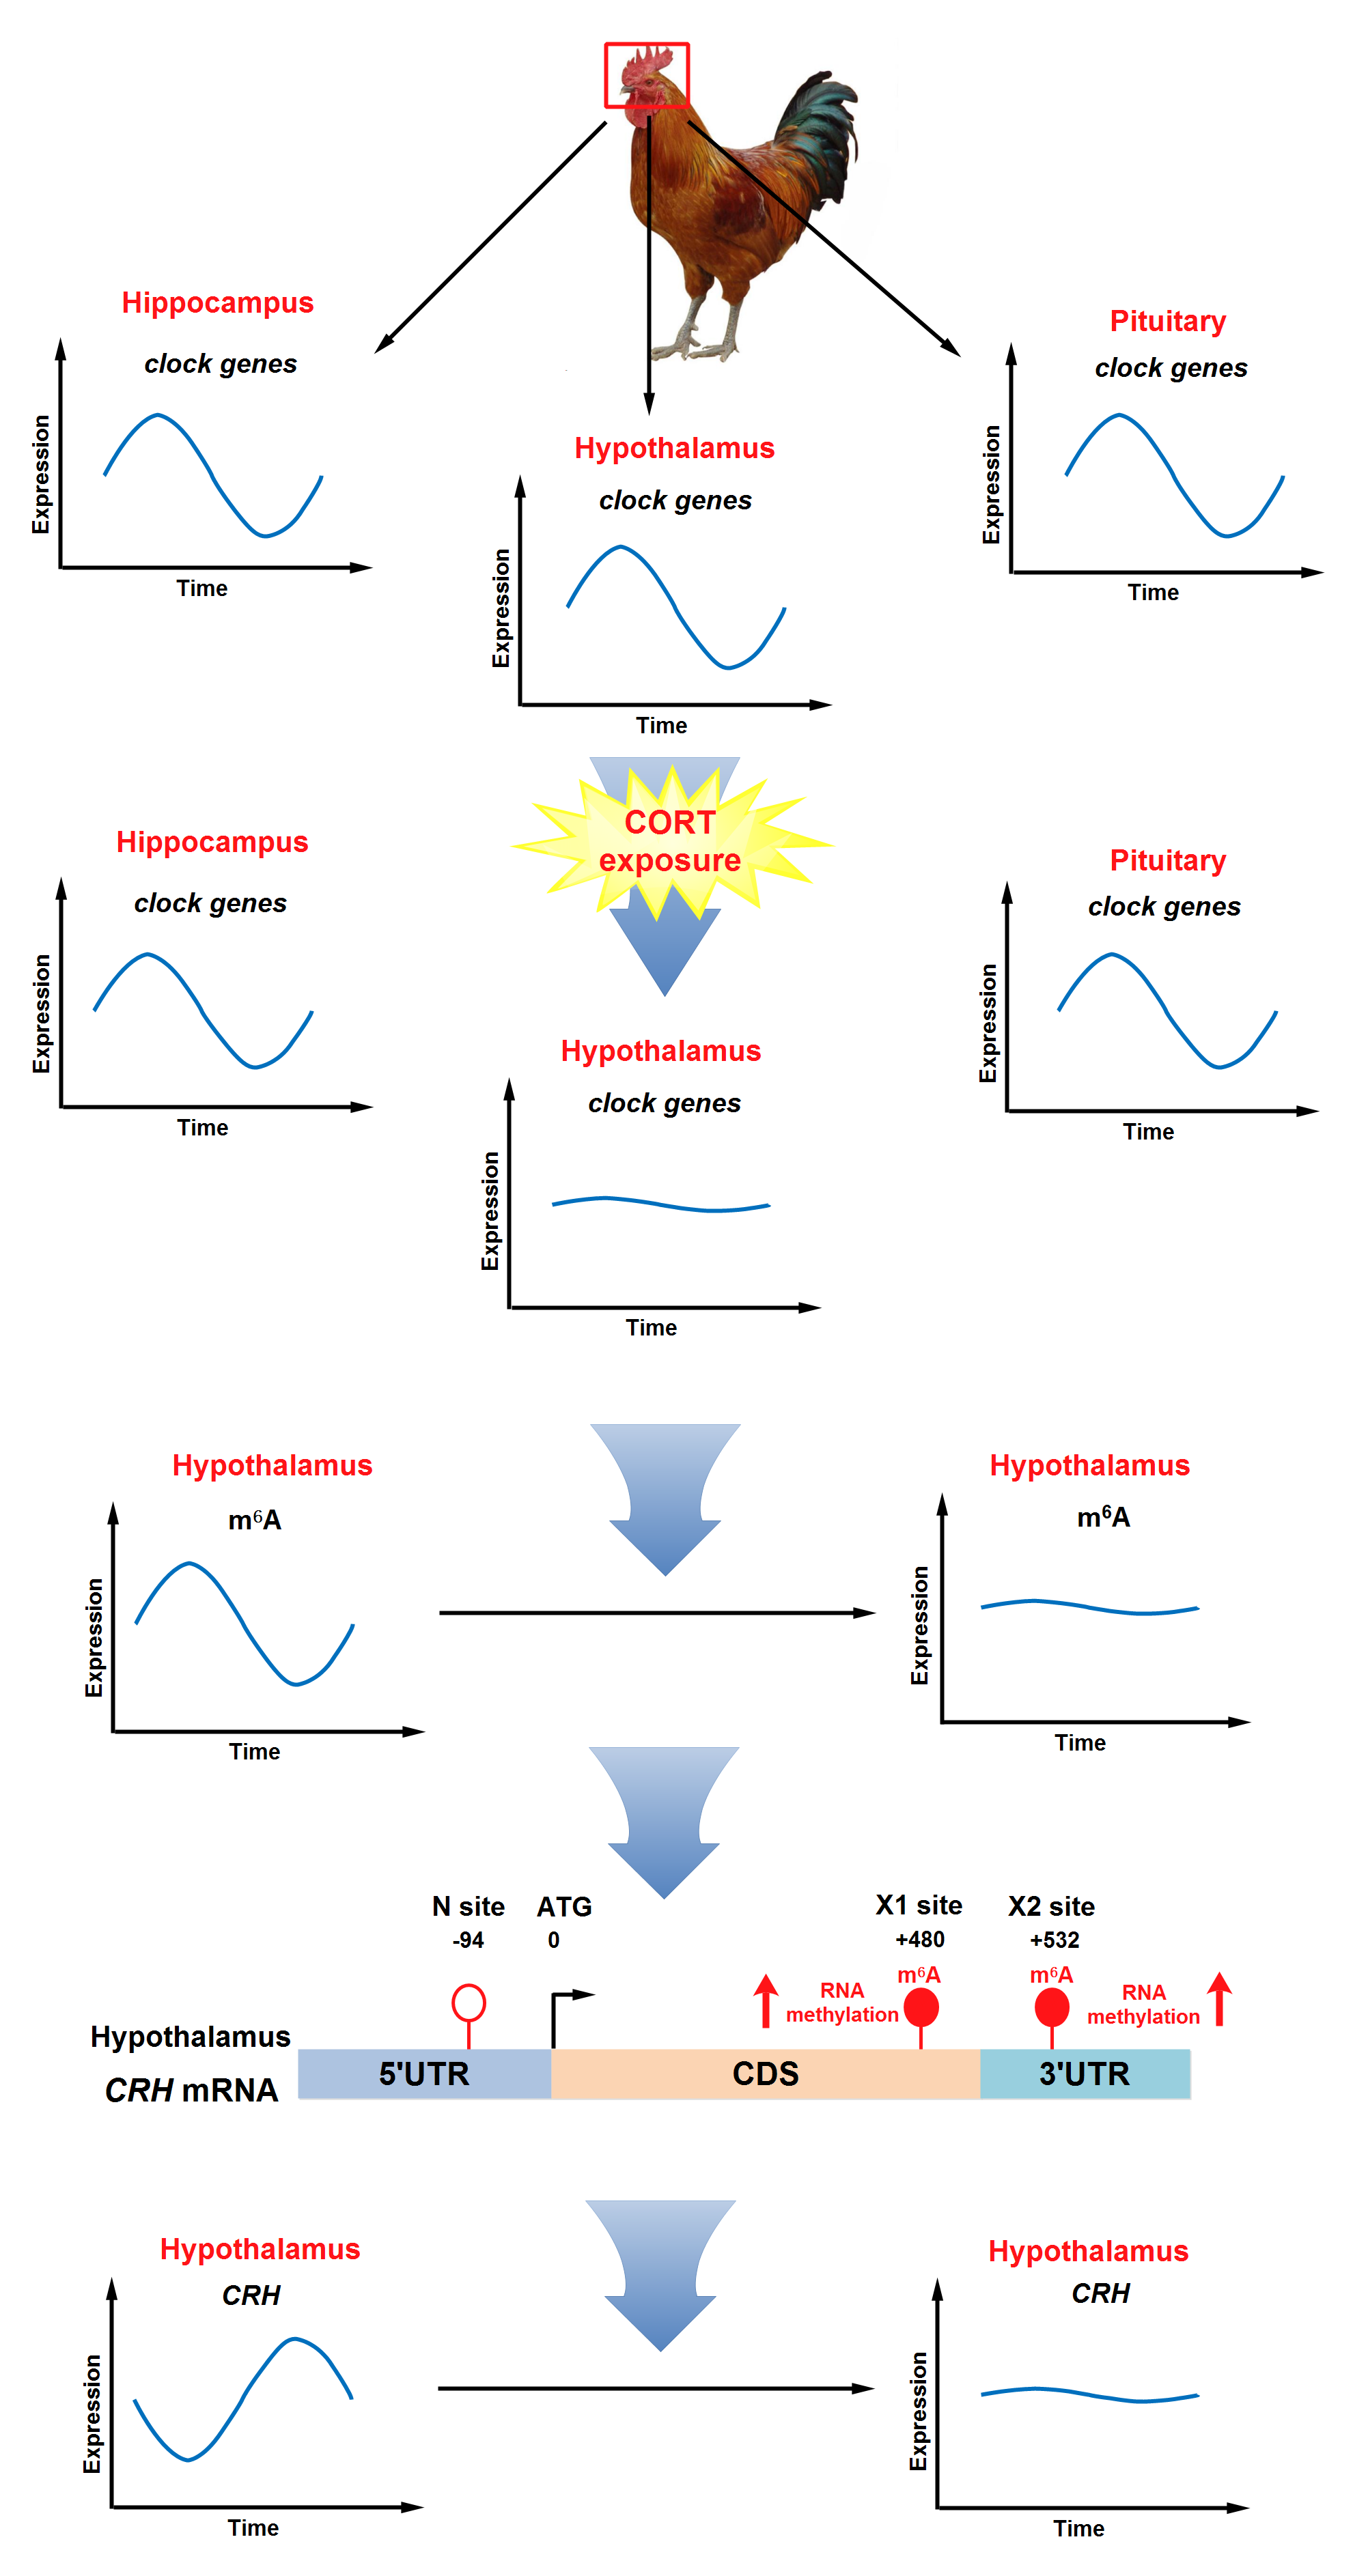
3.2 Effect of chronic CORT exposure on the circadian rhythm of clock genes in hippocampus, hypothalamus, and pituitary.
All the 6 clock genes were expressed in hippocampus (Fig. 2A-F), hypothalamus (Fig. 2G-L), and pituitary (Fig. 2M-R), in gene- and region-specific rhythmic patterns. In CON group, BMAL1, PER2 and PER3 showed more pronounced circadian pattern among 6 clock genes (P < 0.05, one-way ANOVA), regardless of the region. Among 3 brain regions, hypothalamus displayed more clearly circadian patterns for all the 6 clock genes (P < 0.05, one-way ANOVA) as shown in cosinor analysis. Moreover, chronic CORT exposure abolished the circadian rhythms of all the 6 clock genes in hypothalamus, while hippocampus and pituitary were less affected.
Specifically, chronic CORT exposure significantly delayed (P < 0.05) the acrophase of CRY1 mRNA for 2 h (Fig. 2C and Table 3), and significantly decreased (P < 0.05) the amplitude of PER2 mRNA in hippocampus (Fig. 2E and Table 3). However, chronic CORT exposure had no impact on the rhythmicity of CLOCK (Fig. 2A), BMAL1 (Fig. 2B), CRY2 (Fig. 2D) or PER3 (Fig. 2F) mRNA expression in hippocampus (Table 3). By contrast, the circadian rhythms of CLOCK (Fig. 2G), CRY1 (Fig. 2I), CRY2 (Fig. 2J) and PER3 (Fig. 2L) mRNA in hypothalamus were lost in CORT group (Table 4). Meanwhile, the mesor and amplitude of BMAL1 (Fig. 2H) and PER2 (Fig. 2K) mRNA were significantly decreased (P < 0.05) in CORT group (Table 4). In pituitary, chronic CORT exposure significantly decreased (P < 0.05) the mesor of CLOCK (Fig. 2M) and CRY1 (Fig. 2O) mRNA (Table 5). However, chronic CORT exposure had no impact on the rhythmicity of all the clock genes except CRY2 (Fig. 2P, Table 5).
Table 3
Circadian rhythm parameters of all clock genes in hippocampus, as determined by cosinor analyses.
|
Index
|
Group
|
CLOCK
|
BMAL1
|
CRY1
|
CRY2
|
PER2
|
PER3
|
|
Mesor
|
CON
|
1.15 ± 0.03
|
1.50 ± 0.09
|
1.36 ± 0.18
|
0.99 ± 0.08
|
0.49 ± 0.05
|
0.54 ± 0.04
|
|
CORT
|
1.05 ± 0.06
|
1.60 ± 0.08
|
1.26 ± 0.06
|
1.05 ± 0.05
|
0.44 ± 0.05
|
0.58 ± 0.06
|
|
Amplitude
|
CON
|
0.27 ± 0.04
|
0.58 ± 0.12
|
0.86 ± 0.27
|
ND
|
0.44 ± 0.07
|
0.45 ± 0.06
|
|
CORT
|
0.23 ± 0.08
|
0.65 ± 0.12
|
0.45 ± 0.27
|
0.09 ± 0.12
|
0.27 ± 0.02*
|
0.41 ± 0.08
|
|
Acrophase (h)
|
CON
|
10.64 ± 0.55
|
11.14 ± 0.79
|
8.53 ± 0.28
|
5.89 ± 1.87
|
3.27 ± 0.69
|
23.80 ± 0.56
|
|
CORT
|
11.51 ± 1.35
|
11.43 ± 0.69
|
10.51 ± 0.70*
|
ND
|
3.37 ± 0.32
|
23.13 ± 0.78
|
| Values are means ± SEM. *p < 0.05, **p < 0.01, compared with CON group. ND represents not determined as there was no circadian rhythm. |
Table 4
Circadian rhythm parameters of all clock genes in hypothalamus, as determined by cosinor analyses.
|
Index
|
Group
|
CLOCK
|
BMAL1
|
CRY1
|
CRY2
|
PER2
|
PER3
|
|
Mesor
|
CON
|
1.13 ± 0.05
|
1.11 ± 0.04
|
1.13 ± 0.05
|
0.90 ± 0.02
|
0.52 ± 0.06
|
0.63 ± 0.07
|
|
CORT
|
ND
|
0.84 ± 0.06*
|
ND
|
ND
|
0.34 ± 0.02*
|
ND
|
|
Amplitude
|
CON
|
0.45 ± 0.07
|
0.44 ± 0.06
|
0.58 ± 0.07
|
0.17 ± 0.03
|
0.36 ± 0.08
|
0.55 ± 0.09
|
|
CORT
|
ND
|
0.15 ± 0.09*
|
ND
|
ND
|
0.19 ± 0.03*
|
ND
|
|
Acrophase (h)
|
CON
|
8.94 ± 0.53
|
8.43 ± 0.48
|
8.53 ± 0.43
|
6.21 ± 0.72
|
2.53 ± 0.92
|
22.88 ± 0.64
|
|
CORT
|
ND
|
7.51 ± 2.01
|
ND
|
ND
|
2.03 ± 0.63
|
ND
|
| Values are means ± SEM. *p < 0.05, **p < 0.01, compared with CON group. ND represents not determined as there was no circadian rhythm. |
Table 5
Circadian rhythm parameters of all clock genes in pituitary, as determined by cosinor analyses.
|
Index
|
Group
|
CLOCK
|
BMAL1
|
CRY1
|
CRY2
|
PER2
|
PER3
|
|
Mesor
|
CON
|
1.15 ± 0.09
|
1.33 ± 0.06
|
0.86 ± 0.03
|
0.86 ± 0.05
|
0.59 ± 0.02
|
0.64 ± 0.06
|
|
CORT
|
0.88 ± 0.05*
|
1.36 ± 0.08
|
0.66 ± 0.05*
|
ND
|
0.49 ± 0.04
|
0.65 ± 0.07
|
|
Amplitude
|
CON
|
0.24 ± 0.13
|
0.50 ± 0.09
|
0.21 ± 0.05
|
0.21 ± 0.06
|
0.41 ± 0.02
|
0.52 ± 0.09
|
|
CORT
|
0.11 ± 0.08
|
0.66 ± 0.12
|
0.28 ± 0.07
|
ND
|
0.30 ± 0.05
|
0.51 ± 0.11
|
|
Acrophase (h)
|
CON
|
18.25 ± 2.00
|
10.34 ± 0.69
|
5.04 ± 0.84
|
4.81 ± 1.15
|
2.87 ± 0.25
|
22.53 ± 0.66
|
|
CORT
|
19.10 ± 2.60
|
10.57 ± 0.66
|
7.15 ± 0.84
|
ND
|
1.97 ± 0.68
|
21.92 ± 0.76
|
| Values are means ± SEM. *p < 0.05, compared with CON group. ND represents not determined as there was no circadian rhythm. |
3.3 Effect of chronic CORT exposure on the circadian rhythm parameters of CRH in hypothalamus and CRH receptor genes in pituitary
In line with the abolished rhythmicity of clock genes in hypothalamus, the circadian pattern of CRH mRNA (Fig. 3A) in hypothalamus was significantly diminished in CORT group, so was the rhythmic expression of CRHR1 (Fig. 3B) and CRHR2 (Fig. 3C) mRNA in pituitary (P < 0.05, one-way ANOVA). Chronic CORT exposure significantly decreased the mesor (P < 0.05) and amplitude (P < 0.01) of CRH mRNA in hypothalamus, as well as CRHR1 and CRHR2 mRNA in pituitary (Table 6). In general, chronic CORT exposure significantly abolished (P < 0.05) the rise of CRH (Fig. 3A), CRHR1 (Fig. 3B) and CRHR2 (Fig. 3C) mRNA expression in the dark phase after midnight at ZT18 and ZT22.
Table 6
Circadian rhythm parameters of CRH in hypothalamus, and CRHR1, CRHR2 in pituitary, as determined by cosinor analyses.
|
Index
|
Group
|
CRH
|
CRH R1
|
CRH R2
|
|
Mesor
|
CON
|
1.01 ± 0.05
|
0.95 ± 0.04
|
1.01 ± 0.03
|
|
CORT
|
0.78 ± 0.05*
|
0.78 ± 0.05*
|
0.78 ± 0.03*
|
|
Amplitude
|
CON
|
0.40 ± 0.08
|
0.43 ± 0.06
|
0.32 ± 0.05
|
|
CORT
|
0.13 ± 0.07**
|
0.17 ± 0.07**
|
0.15 ± 0.04**
|
|
Acrophase (h)
|
CON
|
20.81 ± 0.65
|
20.35 ± 0.44
|
20.18 ± 0.50
|
|
CORT
|
ND
|
ND
|
ND
|
| Values are means ± SEM. *p < 0.05, **p < 0.01, compared with CON group. ND represents not determined as there was no circadian rhythm. |
3.4. Effect of chronic CORT exposure on the circadian rhythm parameters of feeding related genes in hypothalamus
In accordance with the alterations of CRH mRNA, the diurnal patterns of hypothalamic NPY (Fig. 4A), AGRP (Fig. 4B), POMC (Fig. 4C) and CART (Fig. 4D) RNA expression were also eliminated in CORT group (P < 0.05, one-way ANOVA). The expression pattern of “the hunger genes” NPY and AGRP were opposite to that of the “the satiety genes” POMC and CART, matching the diurnal pattern of feeding behavior in the chicken. Chronic CORT exposure significantly decreased (P < 0.01) the mesor and amplitude of all the 4 feeding regulatory genes in hypothalamus (Table 7).
Table 7
Circadian rhythm parameters of NPY, AGRP, POMC and CART in hypothalamus, as determined by cosinor analyses.
|
Index
|
Group
|
NPY
|
AGRP
|
POMC
|
CART
|
|
Mesor
|
CON
|
1.06 ± 0.03
|
1.12 ± 0.06
|
1.11 ± 0.06
|
1.01 ± 0.03
|
|
CORT
|
0.66 ± 0.02**
|
0.69 ± 0.03**
|
0.69 ± 0.07**
|
0.67 ± 0.01**
|
|
Amplitude
|
CON
|
0.36 ± 0.05
|
0.42 ± 0.10
|
0.46 ± 0.08
|
0.40 ± 0.04
|
|
CORT
|
0.10 ± 0.03**
|
0.10 ± 0.05**
|
0.16 ± 0.10**
|
0.10 ± 0.01**
|
|
Acrophase (h)
|
CON
|
8.25 ± 0.44
|
8.86 ± 0.77
|
18.72 ± 0.63
|
20.03 ± 0.35
|
|
CORT
|
ND
|
ND
|
ND
|
ND
|
| Values are means ± SEM. *p < 0.05, **p < 0.01, compared with CON group. ND represents not determined as there was no circadian rhythm. |
3.5 Effect of chronic CORT exposure on the circadian rhythm parameters of m6 A level and m6 A related genes in hypothalamus
Interestingly, the global RNA m6A levels (Fig. 5A) exhibited diurnal pattern in CON group (P < 0.05, one-way ANOVA), higher m6A levels were detected in light phase. Chronic CORT exposure significantly disrupted this pattern with significantly decreased (P < 0.05) m6A levels in light phase at ZT6 and ZT10, but significantly increased (P < 0.05) m6A levels in dark phase at ZT14, ZT18 and ZT22. Meanwhile, chronic CORT exposure significantly (P < 0.01) decreased the amplitude of m6A levels and delayed the acrophase of m6A levels for 13.48 h (Table 8). Concurrently, chronic CORT exposure significantly increased (P < 0.05) the mesor of FTO (Fig. 5B) mRNA and decreased (P < 0.05) the mesor of YTHDF2 (Fig. 5F) and YTHDF3 (Fig. 5G) mRNA in hypothalamus (Table 8).
Table 8
Circadian rhythm parameters of m6A level and m6A related genes in hypothalamus, as determined by cosinor analyses.
|
Index
|
Group
|
m6A
|
FTO
|
METTL3
|
METTL14
|
YTHDF1
|
YTHDF2
|
YTHDF3
|
|
Mesor
|
CON
|
99.31 ± 3.52
|
0.97 ± 0.04
|
1.13 ± 0.04
|
1.07 ± 0.05
|
0.92 ± 0.02
|
0.83 ± 0.02
|
0.94 ± 0.02
|
|
CORT
|
104.6 ± 1.92
|
1.12 ± 0.03*
|
0.91 ± 0.09
|
ND
|
ND
|
0.54 ± 0.04*
|
0.73 ± 0.05*
|
|
Amplitude
|
CON
|
49.76 ± 5.04
|
0.24 ± 0.06
|
0.31 ± 0.05
|
0.25 ± 0.07
|
0.13 ± 0.03
|
0.18 ± 0.03
|
0.12 ± 0.03
|
|
CORT
|
20.76 ± 2.84**
|
0.28 ± 0.05
|
0.17 ± 0.07
|
ND
|
ND
|
0.11 ± 0.55
|
0.09 ± 0.06
|
|
Acrophase (h)
|
CON
|
4.31 ± 0.45
|
19.82 ± 0.83
|
9.93 ± 0.67
|
9.58 ± 0.95
|
23.73 ± 0.98
|
0.87 ± 0.75
|
3.76 ± 1.10
|
|
CORT
|
ND
|
7.56 ± 0.58**
|
15.10 ± 3.43*
|
ND
|
ND
|
2.12 ± 1.90
|
1.31 ± 2.87
|
| Values are means ± SEM. *p < 0.05, **p < 0.01, compared with CON group. ND represents not determined as there was no circadian rhythm. |
3.6 Effect of chronic CORT exposure on the site-specific m6 A levels in the 3’UTR of CRH mRNA in hypothalamus
To explore the possible link between the site-specific m6A modification on CRH mRNA and CRH mRNA expression in hypothalamus, RNA samples from hypothalamus on ZT18 and ZT22 with significant changes in CRH mRNA were subjected to single-base elongation and ligation-based qPCR amplification method (SELECT) assay. Two specific m6A sites (Fig. 6A) were identified in the coding sequence (CDS) close to 3’UTR (X1) and 3’UTR (X2) of CRH mRNA, respectively, from published MeRIP-seq database [26]. N site located in the 5’UTR without consensus m6A motif was selected as a negative control. Chronic CORT exposure did not change the CT value on N site at either ZT 18 (Fig. 6B) or ZT 22 (Fig. 6E), compared with CON group. However, chronic CORT exposure significantly increased (P < 0.05) the CT value on both X1 (Fig. 6C, F) and X2 (Fig. 6D, G) at both time points (ZT18 and ZT22), which was in accordance with the significant decrease of CRH mRNA in hypothalamus at the same time points.