3.1 Optical absorption study
Figure 1(a) shows the surface plasmon resonance (SPR) band of Ag NPs in the UV-visible energy excitation. Figure 1(b) shows the UV-visible spectrum of silver modified Ag NPs. Figure 1a shows the surface plasmon resonance (SPR) at 413 nm confirms the presence of pure Ag NPs [17]. The silver modified Ag NPs exhibits absorbance band at 408 nm shown in Fig. 1b. From Fig. 1c, it was observed that the SPR arises from the PSA NPs at 403 nm with simultaneous broadened band. The changes in the peak position with simultaneous broadening in the intensity due to the dipole - dipole interaction between PSA NPs. The single and strong SPR band in Fig. 1b confirms the formation of spherically shaped Ag NPs through transverse and longitudinal resonances with the silica particles. In Fig. 1b and 1c, a decreased and broadened intensity of SPR band of Ag NPs is due to the increase in the refractive index of the Ag NPs caused by the presence of SiO2, PVASH and Mie plasmon resonance excitation from the Ag NPs [18]. In addition to that, the changes in the peak position with simultaneous broadening in the intensity were because of reducing interparticle distance between the silica and Ag NPs cores [19]. The reduction in the interparticle distances attributes to the creation of more hotspots leads the substrate acts well in electromagnetic enhancements. Hence, as-synthesized PSA NPs can be proved to be a good SERS analyzer. Further, in Fig. 1, the SPR peak is predominant and single; this confirms that the presence of Ag NPs in the solution is in spherical shape was verified by TEM.
3.2 Structural studies
Figure 2 shows the XRD pattern of Ag NPs, silver modified Ag NPs and PSA NPs respectively. Figure 2a shows the diffraction pattern of Ag NPs with its diffraction peak at 38.18o (111), 44.38o (200), 64.50o (220) and 74.44o (311) [17, 18]. In Fig. 2b, addition to the diffraction peaks of Ag NPs with characteristics of the diffraction peak between an angle 15o to 35o, which belongs to amorphous silica, confirms the presence of silica phase in the as synthesized silver modified Ag NPs [22]. This clearly reflects the strong complex formation between them. Figure 2c represents the presence of PVASH diffraction peaks addition to the silicon and Ag peaks. The diffracted pattern of thiol was observed at 35o (180), 41.7o (26 − 2), 46.89o (28 − 2) and 48o (321) confirms the presence of SH group [19]. In addition, an average crystallite size of Ag NPs, silver modified Ag NPs and PSA NPs were estimated using Scherrer formula is approximately 17 nm, 12 nm and 13 nm respectively.
3.3 Morphological studies
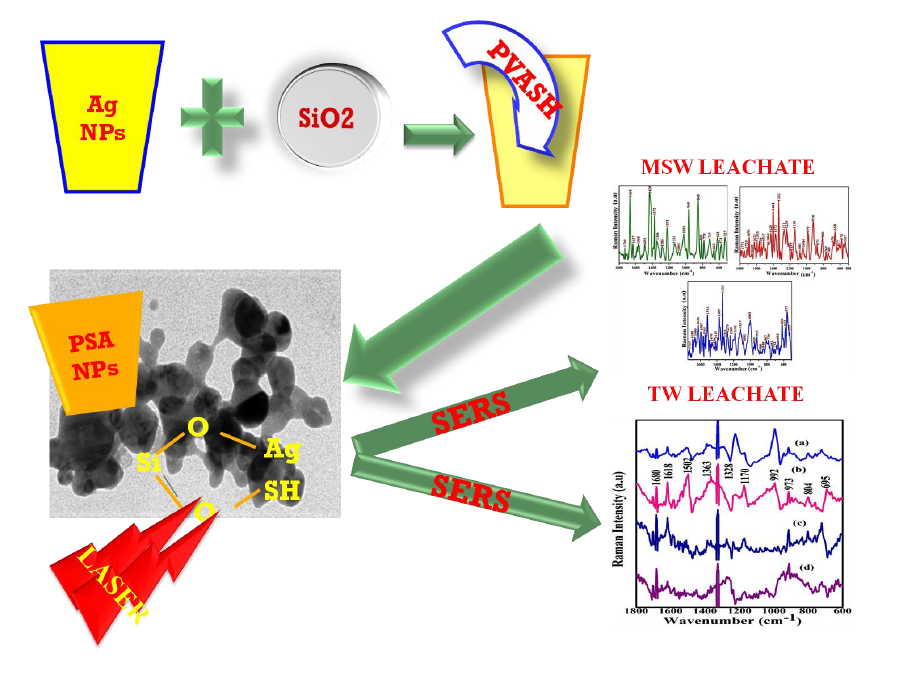
The morphology of Ag, silver modified silica NPs and PSA NPs was investigated by TEM and shown in Fig. 3. Figure 3a shows the spherical profile of Ag NPs. In Fig. 3b, aggregated Ag NPs were obtained in the presence of SiO2. From the Fig. 3c, PSA NPs shows the immense aggregation of Ag NPs due to the assistance of SH. Figure 3d shows the energy dispersive X-ray spectroscopy (EDAX) analysis represents the appearance of silica and sulfur element in addition to strong Ag peaks confirms the Ag NPs and sulfur were successfully embedded with the SiO2. This has been demonstrated that the assembled nanostructures possess strong surface plasmon coupling, creating amplified electromagnetic fields at the nanogaps [19, 23]. Hence, Raman signals of analyte (leachate) molecules can be significantly enhanced by keeping them at the nanogaps of PSA NPs [23]. Since, SiO2 possess negative surface charges, SH group and Ag NPs were strongly bind to the surface of silica through electrostatic interactions [16]. Therefore, SERS afford the interaction mechanism of PSA NPs and the analyte, as well as the strength of S – Ag – O – Si – O – Ag – S nanostructure. Also, observed conjoined morphology in the PSA NPs is the source of hotspot makes the substrate to be a good SERS analyzer of the targeted leachate.
3.4 SERS activity of the substrate using MSW leachate
The active sensing capability of silver modified silica NPs and PSA NPs were studied by selecting MSW landfill leachate as a target molecule. SERS spectrum of targeted leachate from the Ag modified silica NPs and PSA NPs substrates were demonstrated on the Fig. 4a and 4b. This was clearly shows that more number of highly intensed peaks was exhibited from PSA NPs compared to Ag modified silica NPs. This was clearly confirms the presence of SH group increases the sensitivity of Ag modified silica NPs [24, 25]. Hence, the strength of positively charged S–Ag – O – Si – O –Ag –S assembled nanostructures has proven to its SERS sensing ability by the adsorption of MSW landfill leachate with high sensitivity. This positively charged compact and conjoined PSA NPs with fine roughness which acts as a nucleation sites to the negatively charged organic pollutants were adsorbed onto surface via electrostatic forces. Hence, observation showed that PSA NPs has used for the further sensing of leachate in the nearest water samples.
3.5 SERS sensing of MSW landfill leachate in groundwater
SERS sensing of MSW landfill leachate in groundwater was recorded and shown in Fig. 5. The SERS spectrum of groundwater samples of the nearest sites to the MSW landfill viz., G1, G2 and G3 were shown in Fig. 5a, Fig. 5b and Fig. 5c) respectively. From the observation, vibrational bands of groundwater samples exhibit similar vibrational bands of MSW leachate the region 1691–1664 cm− 1, 1622 − 1618 cm-1, 1593 − 1568 cm− 1, 1491–1464 cm− 1, 1430–1428 cm− 1, 1372 − 1313 cm− 1, 1271–1251 cm− 1, 1131–1182 cm− 1, 1093–1003 cm− 1, 979 − 916 cm− 1, 880 − 806 cm− 1, 778 − 712 cm− 1, 682–622 cm− 1, 578–527 cm− 1. SERS of PSA NPs in water represents vibrational frequencies of aromatic hydrocarbon (AH), phenols, phthalates, pesticide and heavy metal. AH in MSW leachate contains the series of benzene derivatives includes toluene, xylene, ethylbenzen, napthalene etc., [26–29]. The presence of AH were recognized with the vibrational assignments in the region 979 − 916 cm− 1 shows the ring stretch of aromatic hydrocarbon, CH bend in the region 1131–1182 cm− 1 and the ring deformation in the region 682–622 cm− 1 revealed the peak of mono aromatic hydrocarbon [26–29]. Phenols are commonly employed worldwide pollutants, they have involved in the contamination of groundwater as endocrine disruptor. Hence, chlorophenol and cresol were recognized with their vibrational assignment as with the characteristics peaks in the region 1388–1313 cm− 1 assigned to C-H deformation and CH3 symmetric, 1593–1562 cm− 1 assigned to the ring stretching, 682 − 622 cm− 1 assigned to C-Cl stretching, 1491–1464 cm− 1 assigned to CH3 asymmetric, 1372cm− 1, 1044–1003 cm− 1 assigned to CH2 scissor vibration and the rocking strong band in the region 778–712 cm− 1 revealed the presence of phenols. Zane Arp and co-workers [26, 31] reported ,symmetric skeletal stretching mode of the phenyl moiety to produce the Fermi doublet with components near 820 and 842 cm− 1 in cresol liquid and strong hydrogen-bond acceptance by the phenolic oxygen atom of p-cresol were diagnosed with the canonical maximum value
I2 /I1 = 2.5 [31]
I2 and I1 are the peak intensities of the higher and lower wave number of the doublet respectively. From the Fig. 5, SERS spectrum of PSA NPs in water resembles the symmetric stretching mode of phenyl moiety near 820 cm− 1 and 840 cm− 1 recognized the cresol presence and strong hydrogen bond of phenolic oxygen atom is not involved describe the absence of p-cresol. Existence of phthalates in ground water samples was confirmed by the vibrational bands of NH deformation in the region 1626–1637 cm− 1 [32]. The vibrational bands of ring mode with C-Cl stretching, ring mode 14 with CH2 twisting and ring stretching with sharp band in the region 806–880 cm− 1, 1593 − 1568 cm− 1 and 1271 − 1251 cm− 1 were confirmed the presence of pesticide (simazine) in the ground water [30]. But, the most expected νs(Cr-O) vibrational band of Cr(VI) was not exhibited in water.
3.5 SERS analysis of TW landfill leachate
Based on the high sensitivity of PSA NPs, leachate of TW landfill was analyzed shown in Fig. 6a. A SERS spectrum of TW waste leachate has shown in Fig. 6b, 6c and 6d shows the SERS of G1, G2 and G3. In Fig. 6a, the major bands in SERS spectrum of leachate located at 1680 cm− 1, 1618 cm-1, 1502 cm− 1, 1363 cm− 1, 1328 cm− 1, 1170 cm− 1, 992 cm− 1, 973 cm− 1, 804 cm− 1, in the region 761–695 cm− 1. The band in the region 761–695 cm− 1 with very strong (vs) vibration is attributing the CH out-of plane deformation of mono benzenes [26–29]. The band at 738 cm− 1 denotes the –(CH2)n –of hydrocarbons presence in the leachate [26–29]. The strong (s) band at 761 cm− 1 attribute the NH2 wag in amines [26–29]. According to the literature by jing et al., the presence of chromium (VI) in the TW leachate has analytically identified with the Raman band at 804 cm− 1 [26–29]. Aromatic amines were observed at 1170 cm− 1 with “vs” vibration and its COO group was vibrated in the region 1363 − 1328 cm− 1 (vs) [26–29]. Vibrational bands in the region 1585 cm− 1 to 1682 cm− 1 attributes the NH2 and NH3 deformation of amines [26–29]. Hence, the observed vibrational bands in the Fig. 6 concludes the TW leachate and its active concentration in groundwater. Furthermore, the SERS of water samples from the nearest TW landfill leachate exhibited the similar SERS spectrum of TW leachate which confirms the occurrence of leachate in water sites. The observation shows, among the water samples referred here, water samples (G1, G2 and G3) exhibits the exact similar Raman peaks of TW leachate. In general, SERS of TW leachate takes place by the chemisorptions of organic molecules trapped at the hotspots of dimeric junctions. In particular, major pollutant of TW leachate is Cr6+ has expected to bind with PSA NPs in the way of metal-ligand interaction shows that it can be an good analyte for the metal detection in the practical way [6, 17, 18].