Man-made climate change remains unabated, and CO2 release is widely not controlled, with often poor, lacking, or failing future outlooks [26], [27], [28], [29]. Using open access BIG DATA here, we were able to look at the best predicted SDM summary for over 230 squirrel species – a group that is somewhat ignored and marginalized with lacking science-based management, funding, and efforts; even the taxonomy is not agreed on [2a], [3].
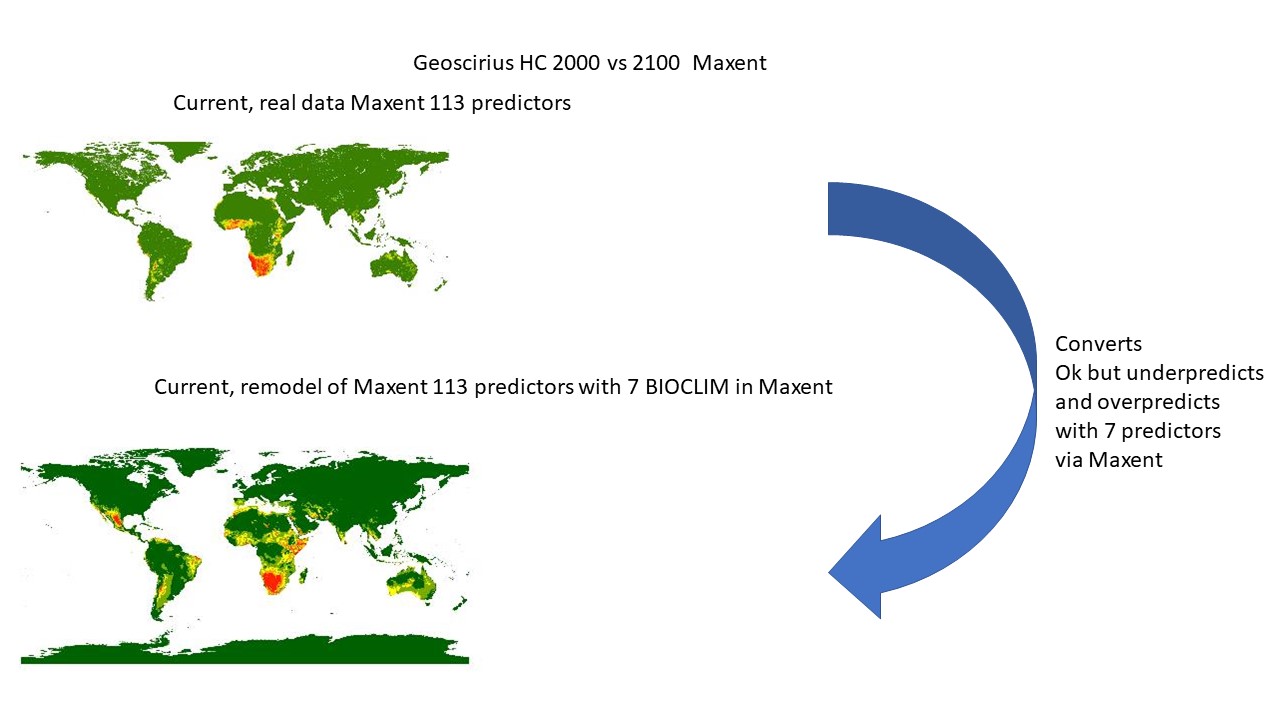
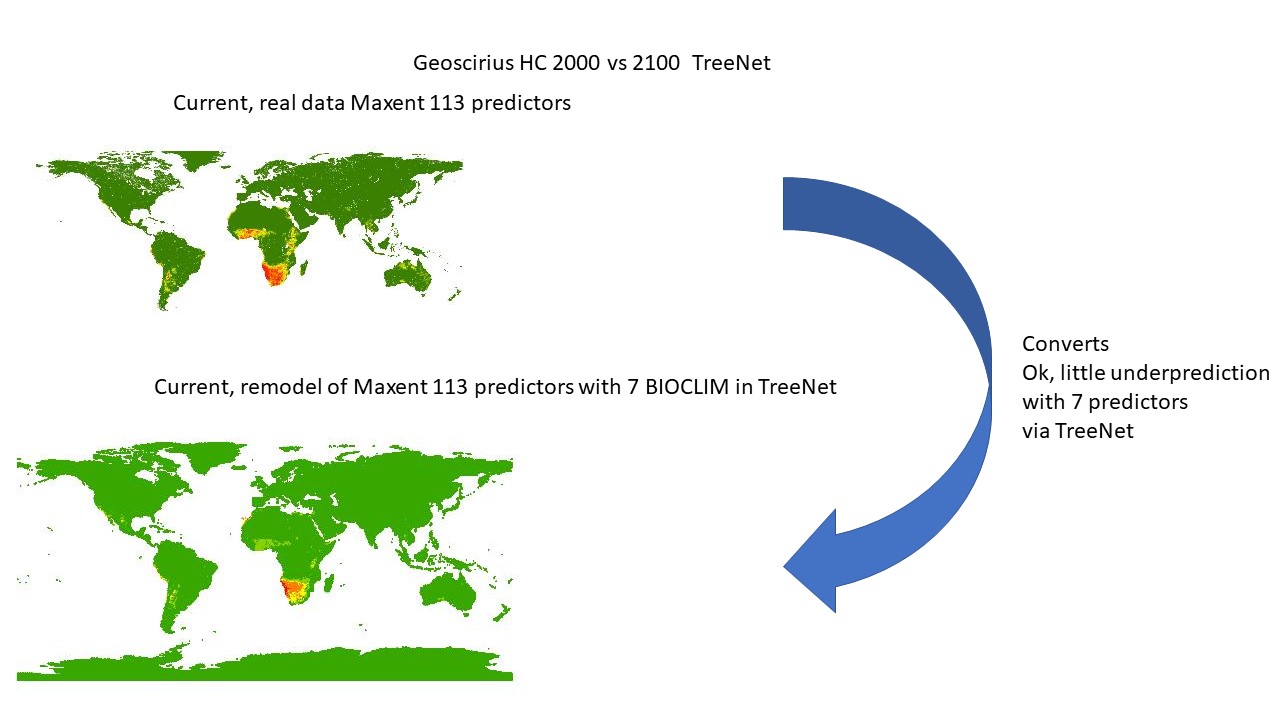
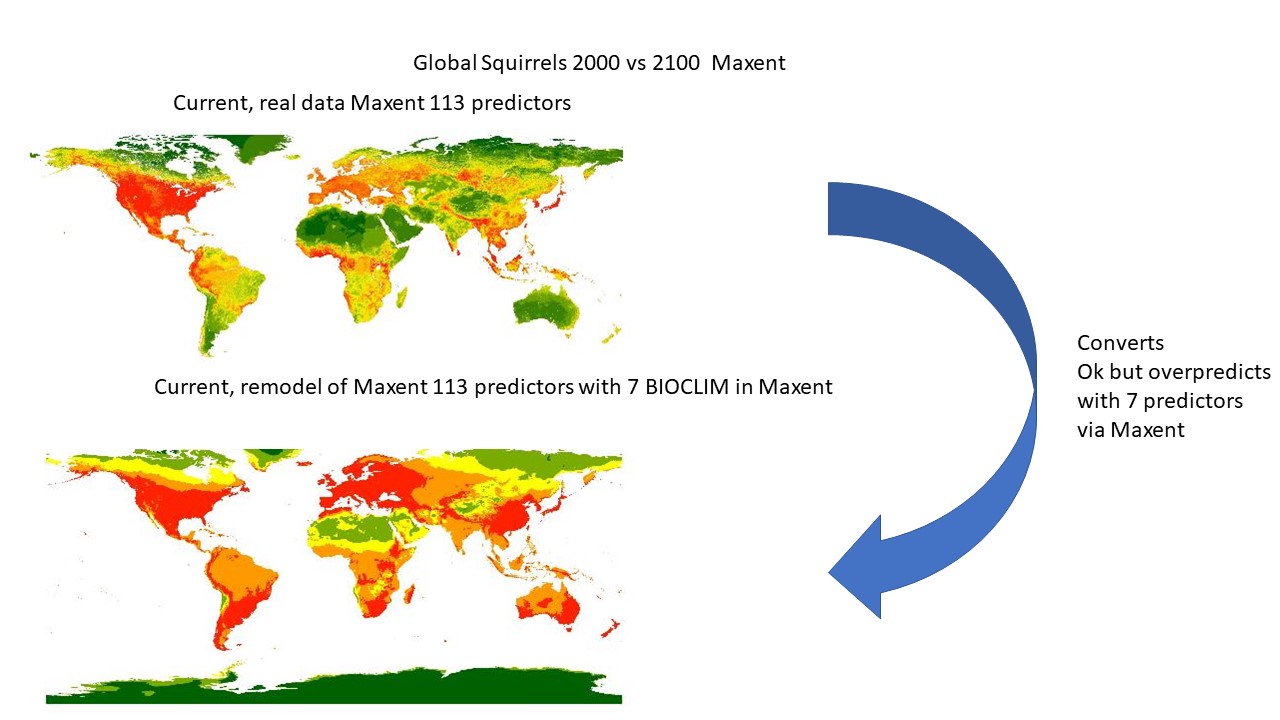
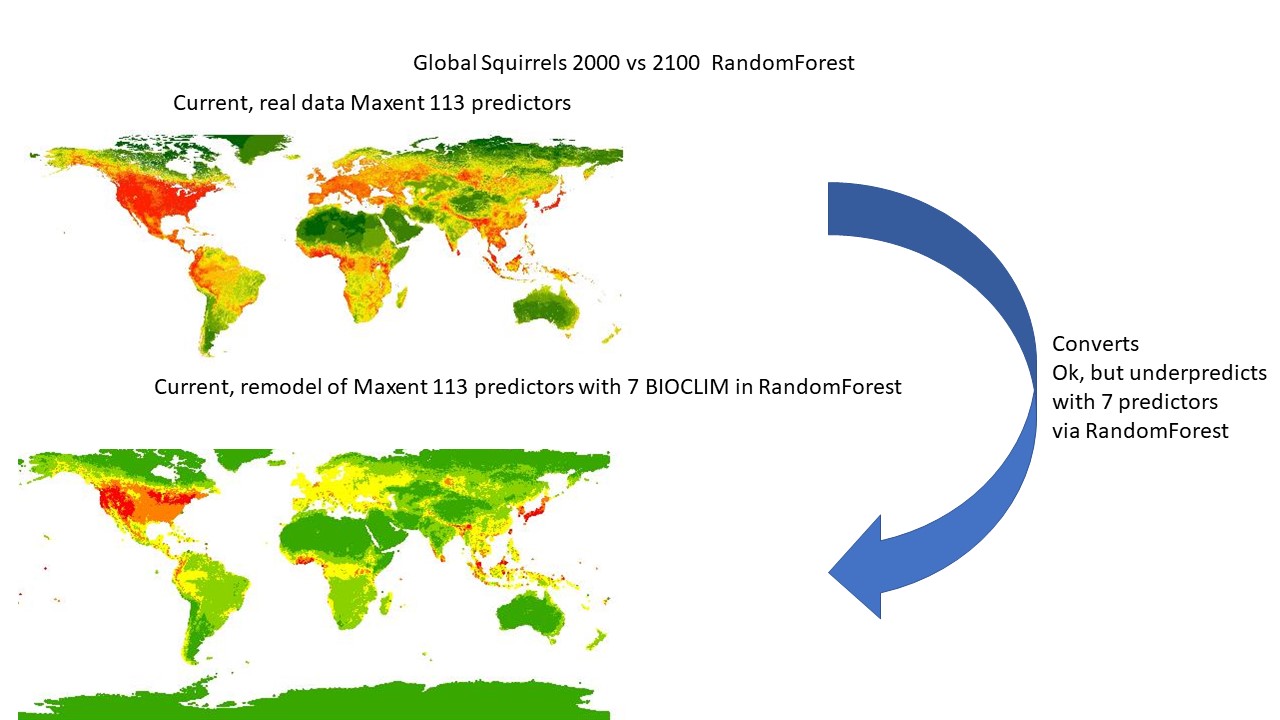
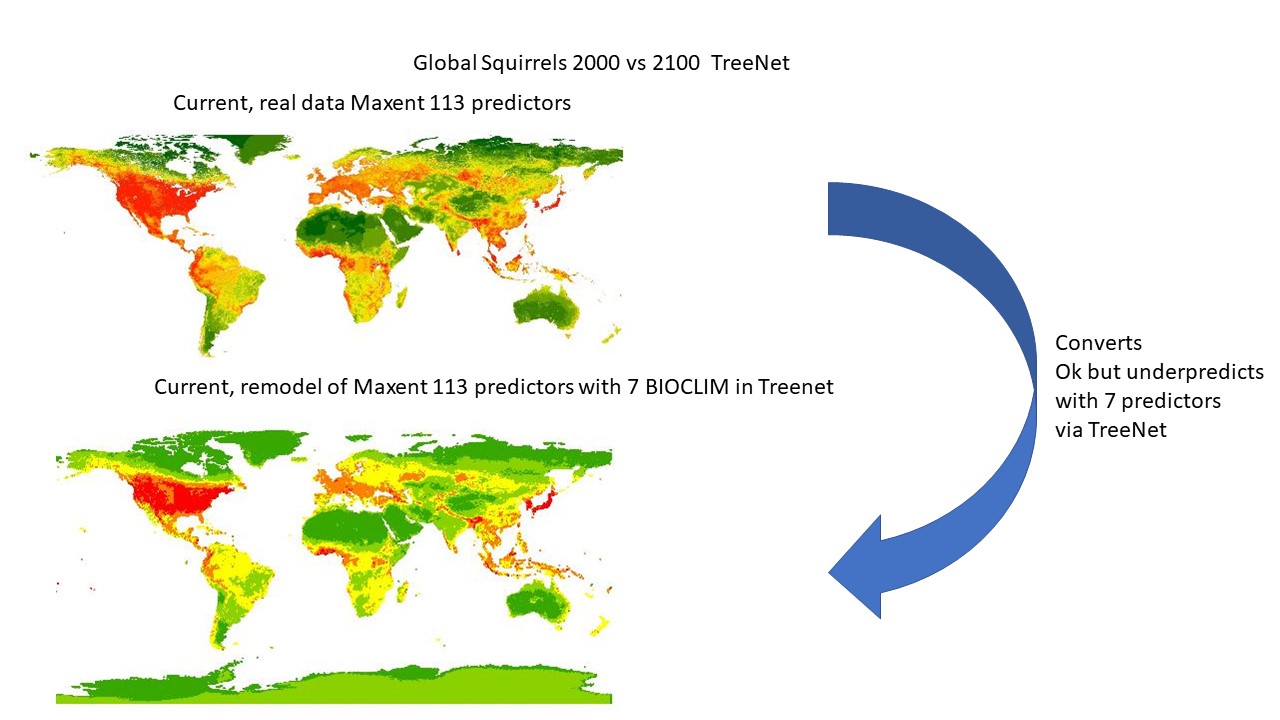
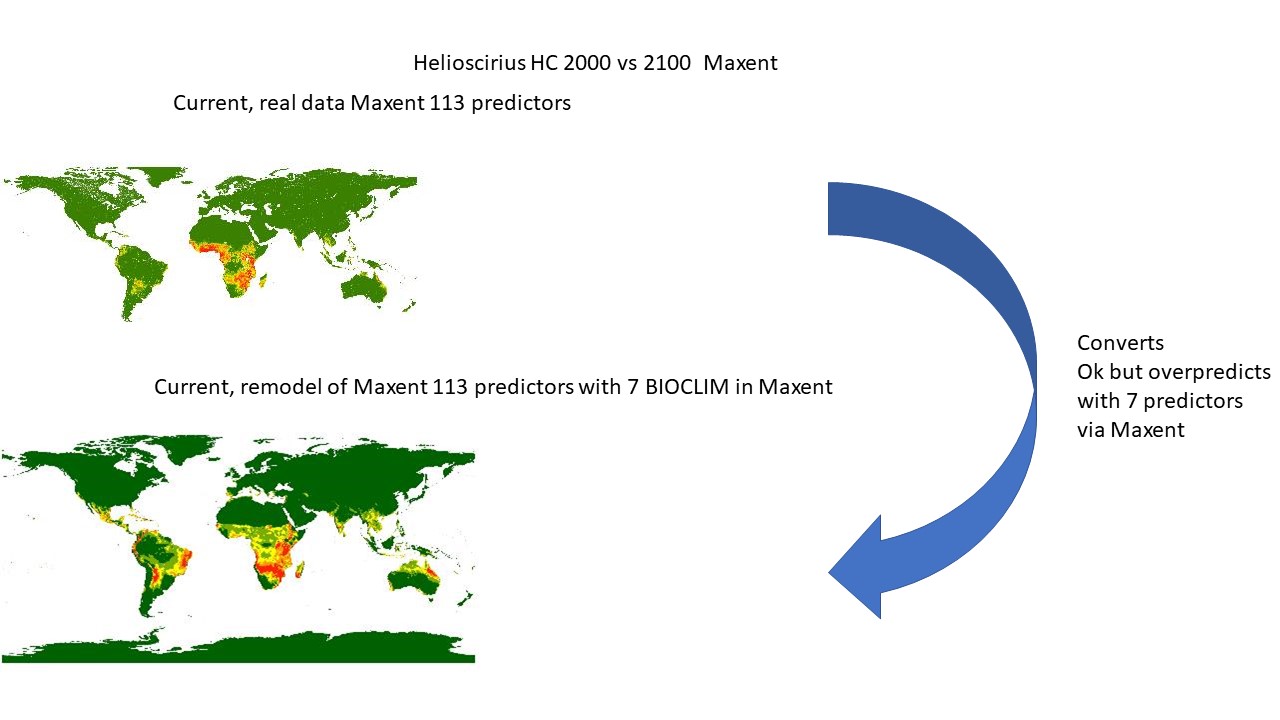
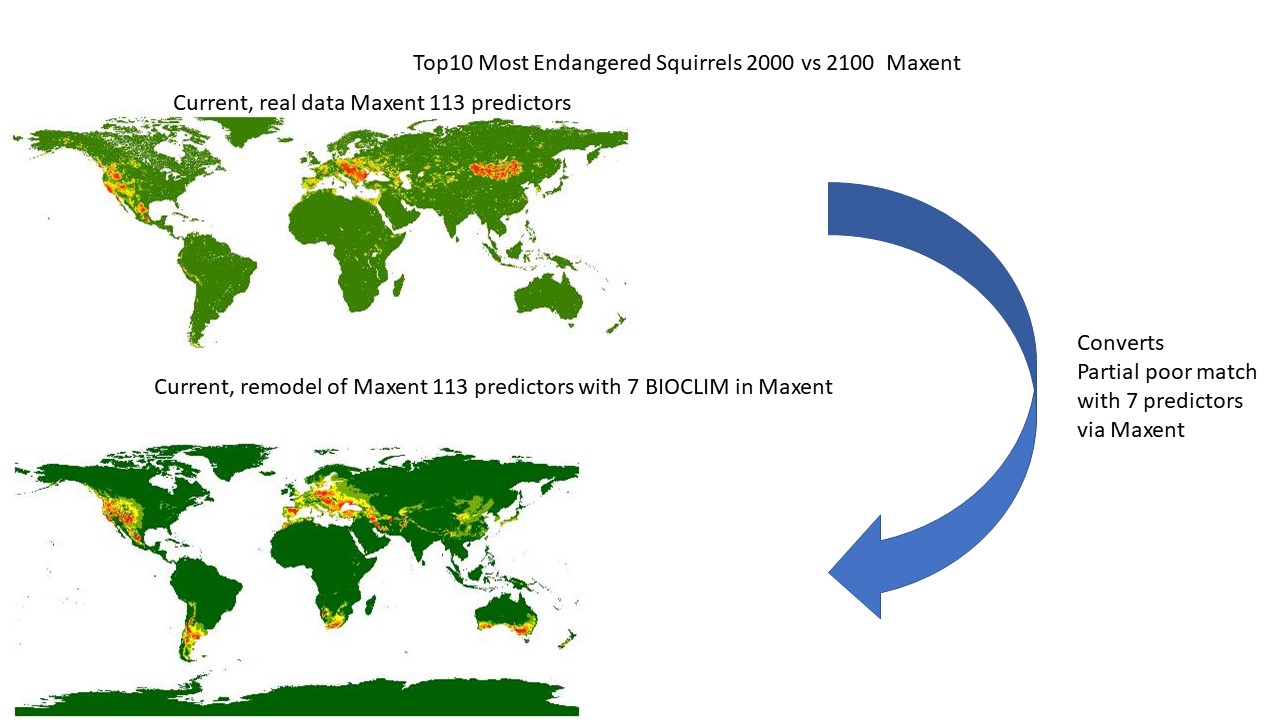
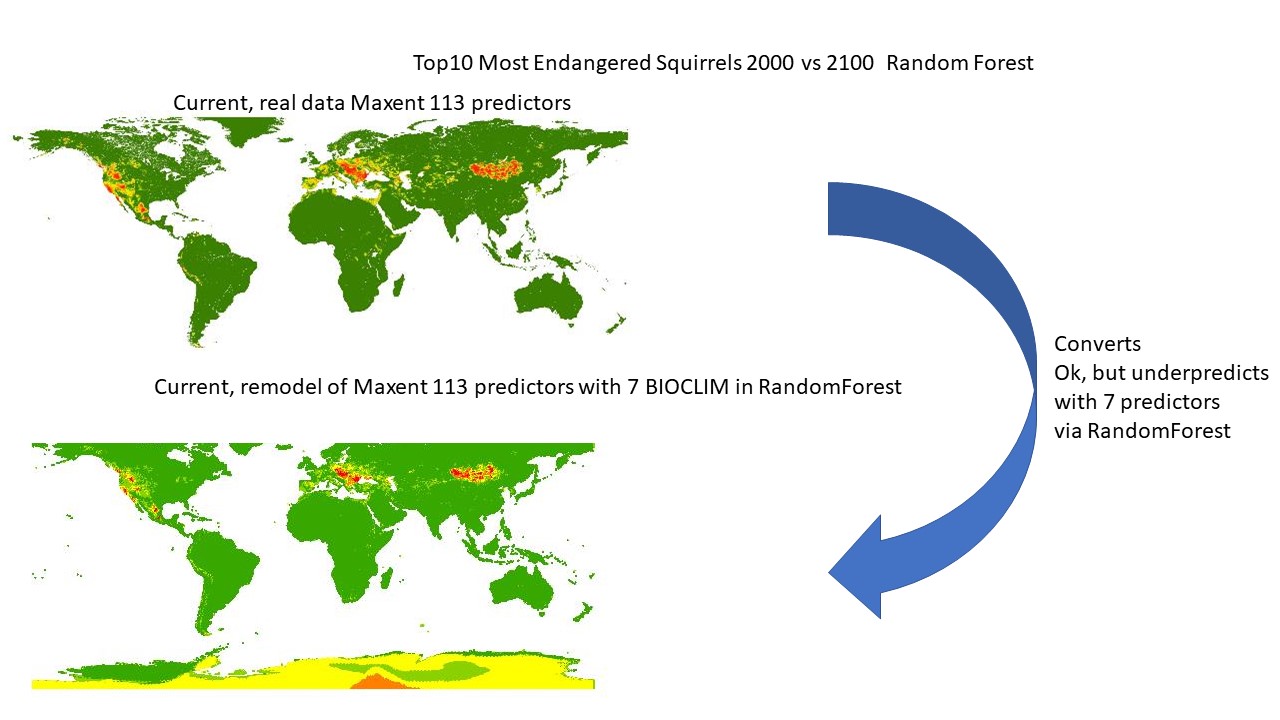
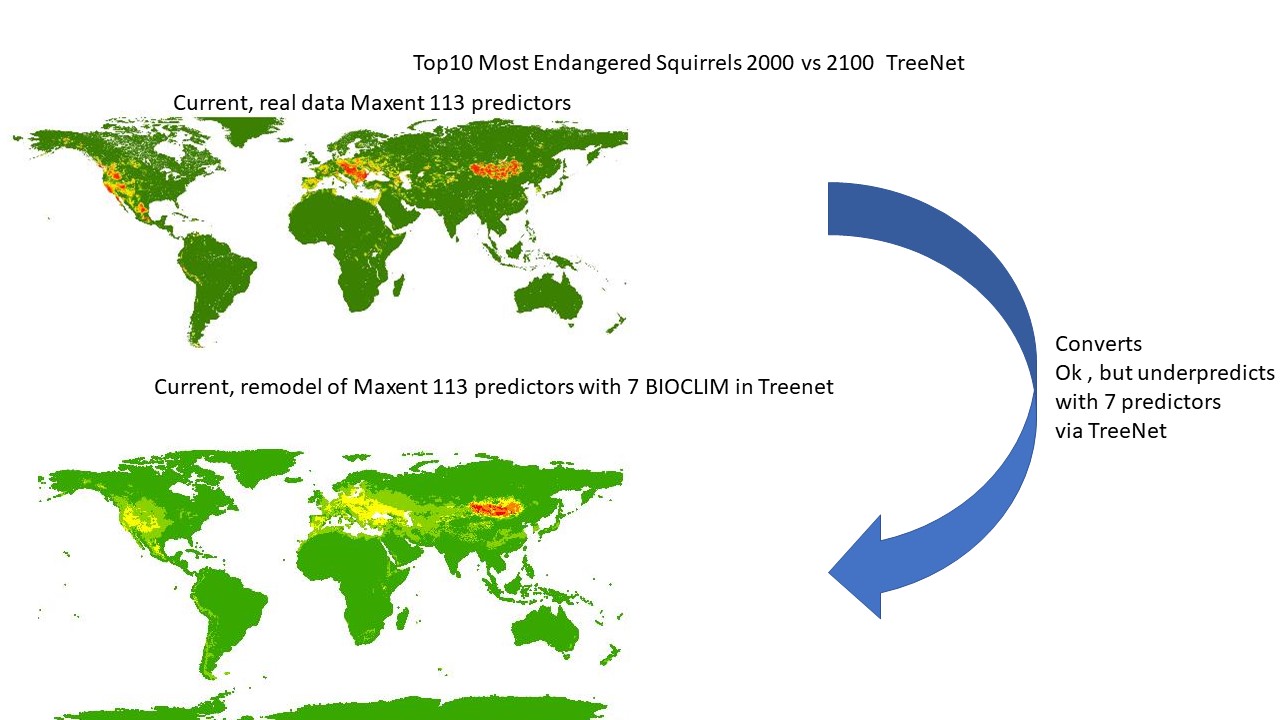
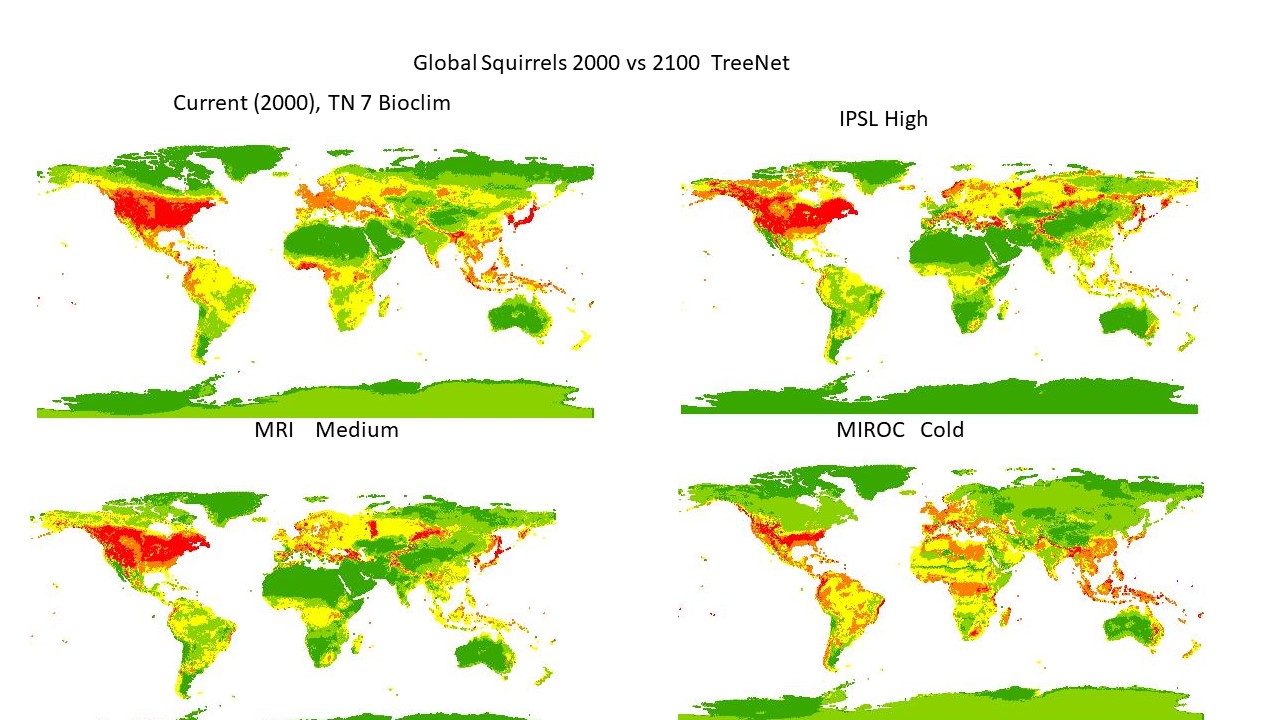
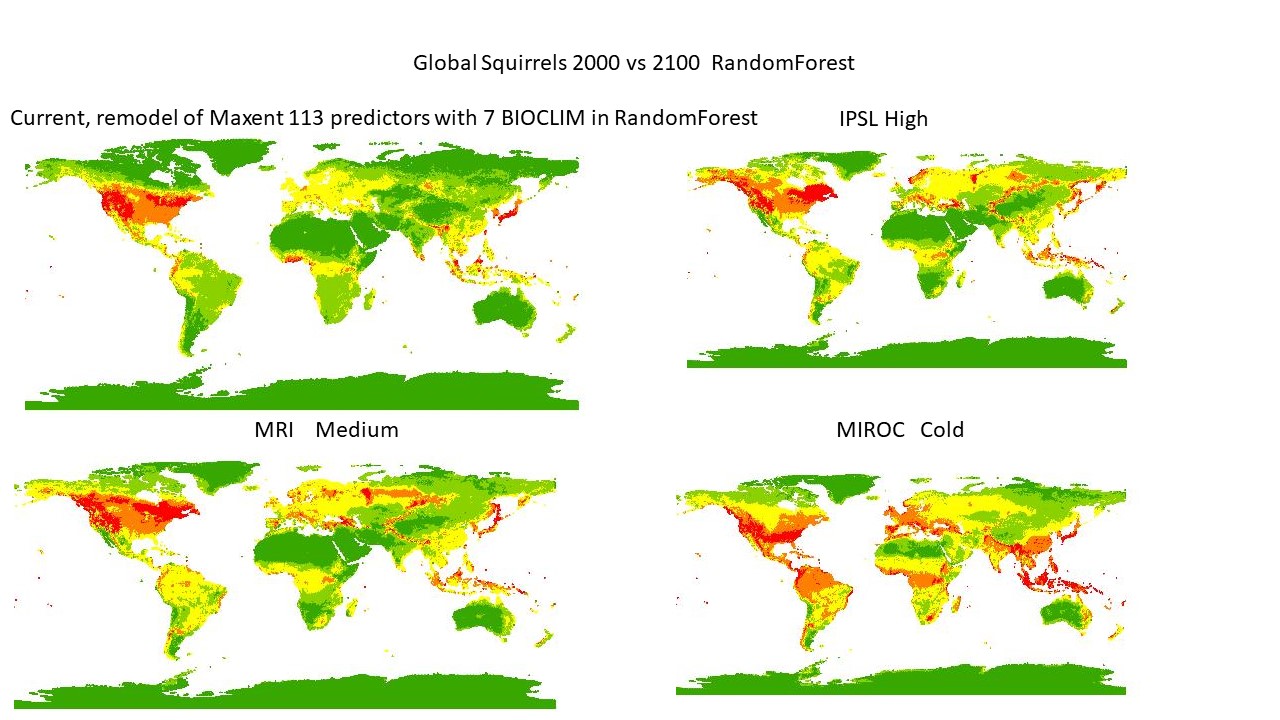
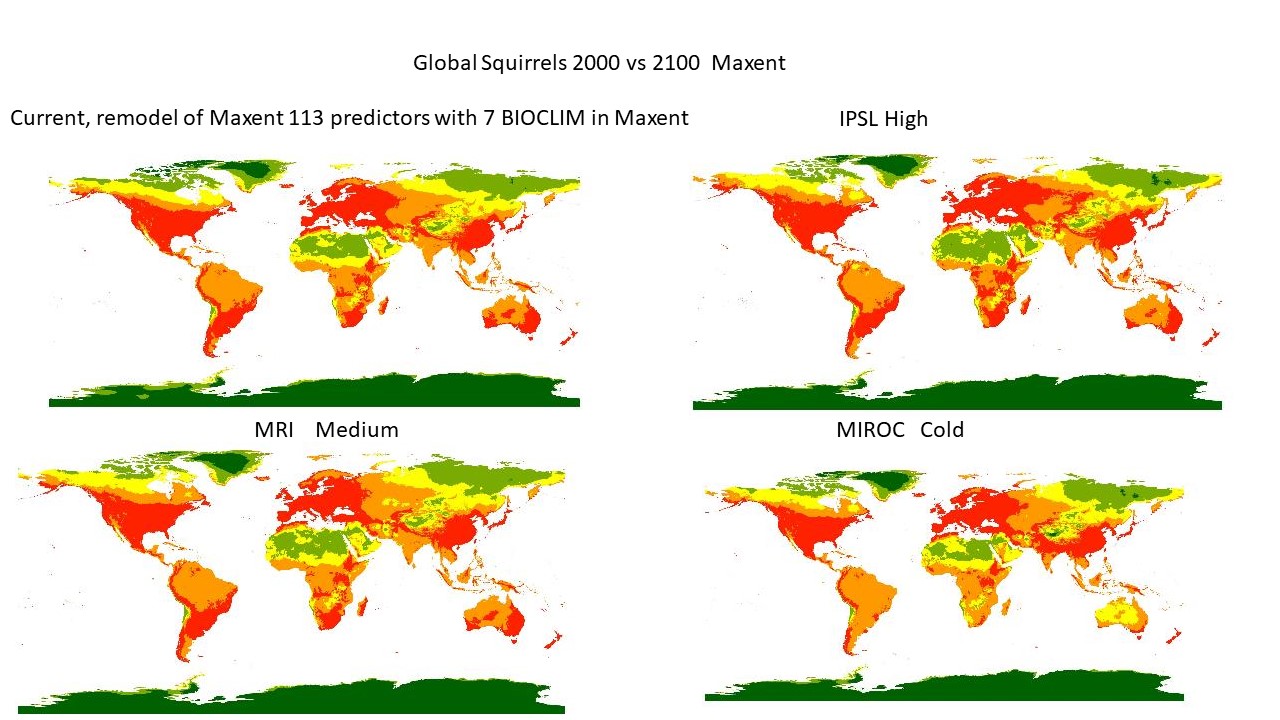
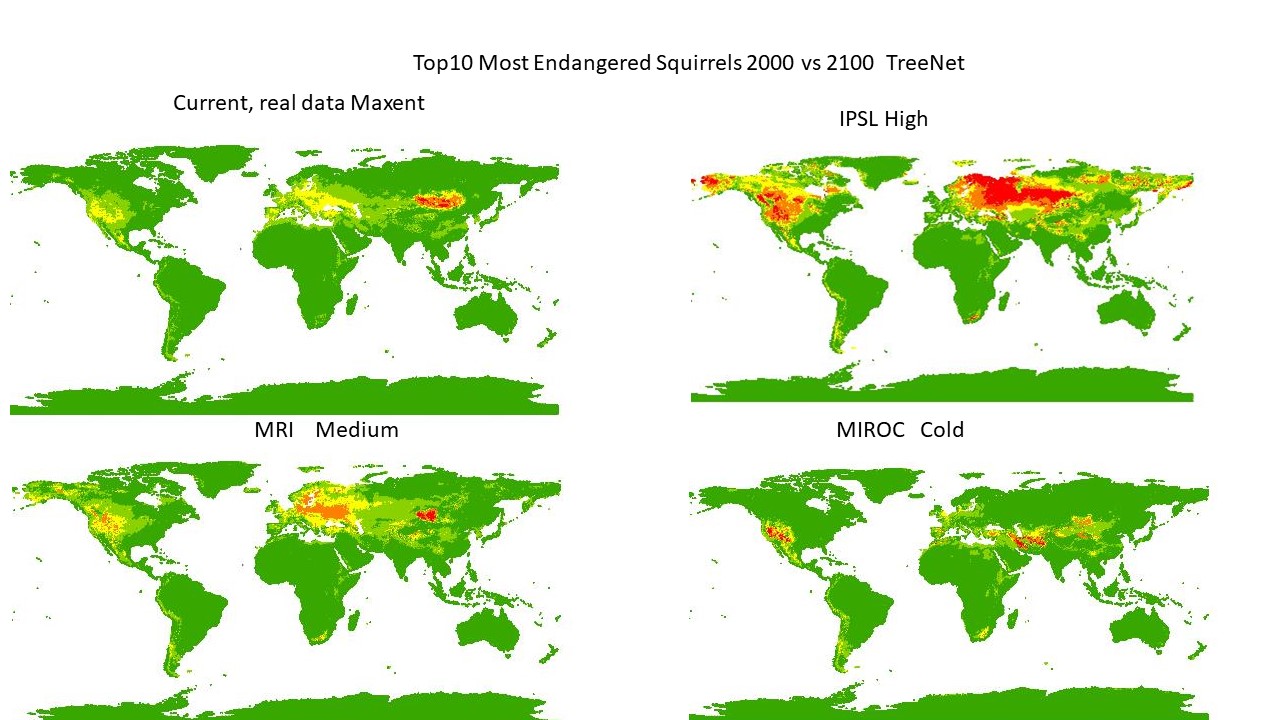
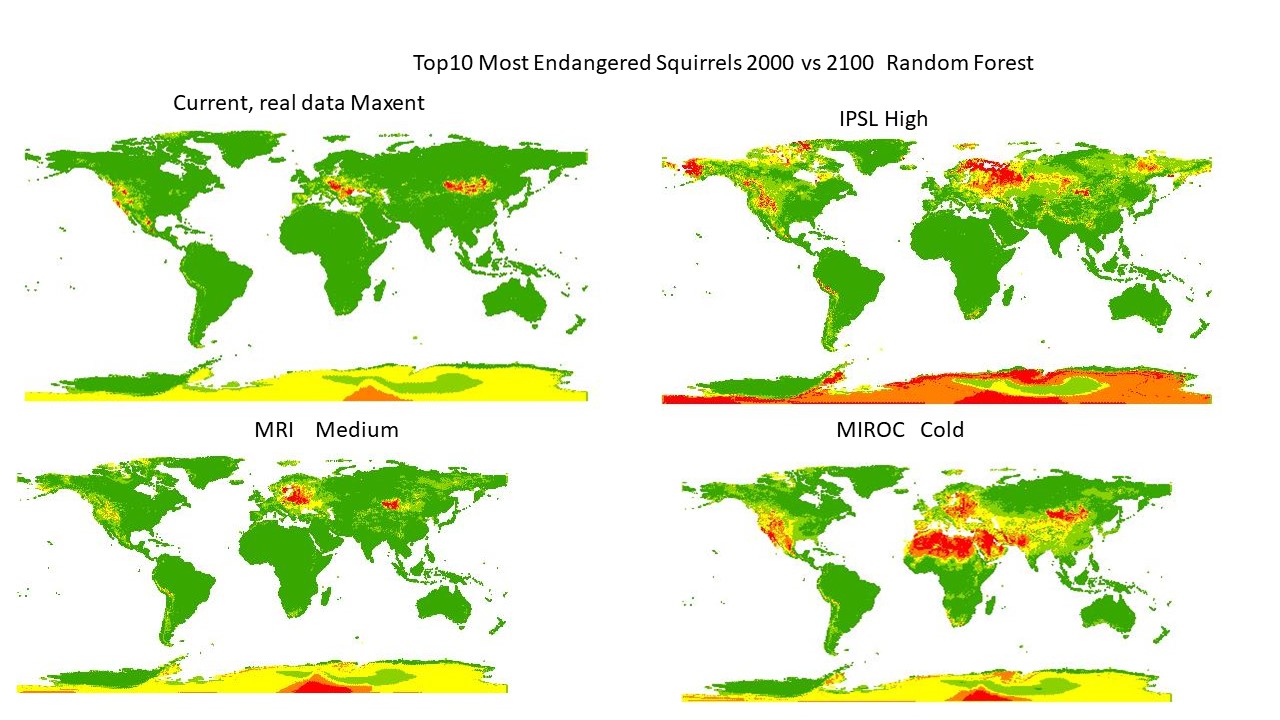
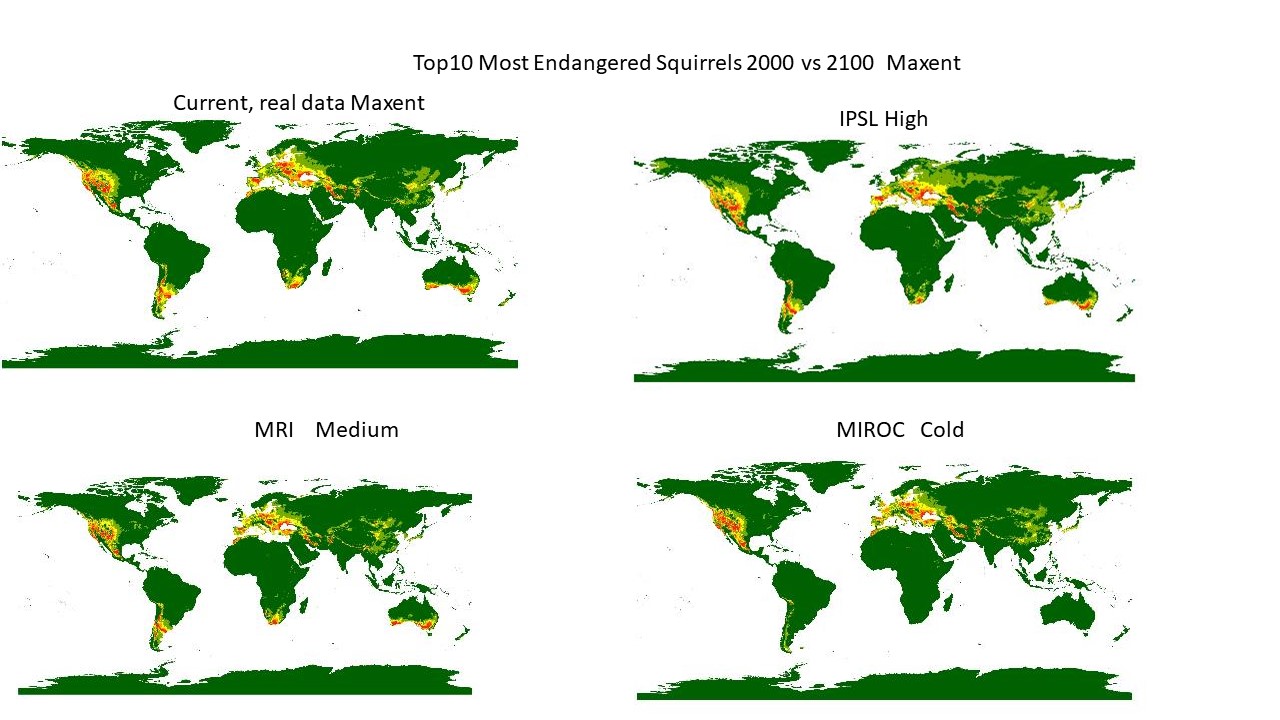
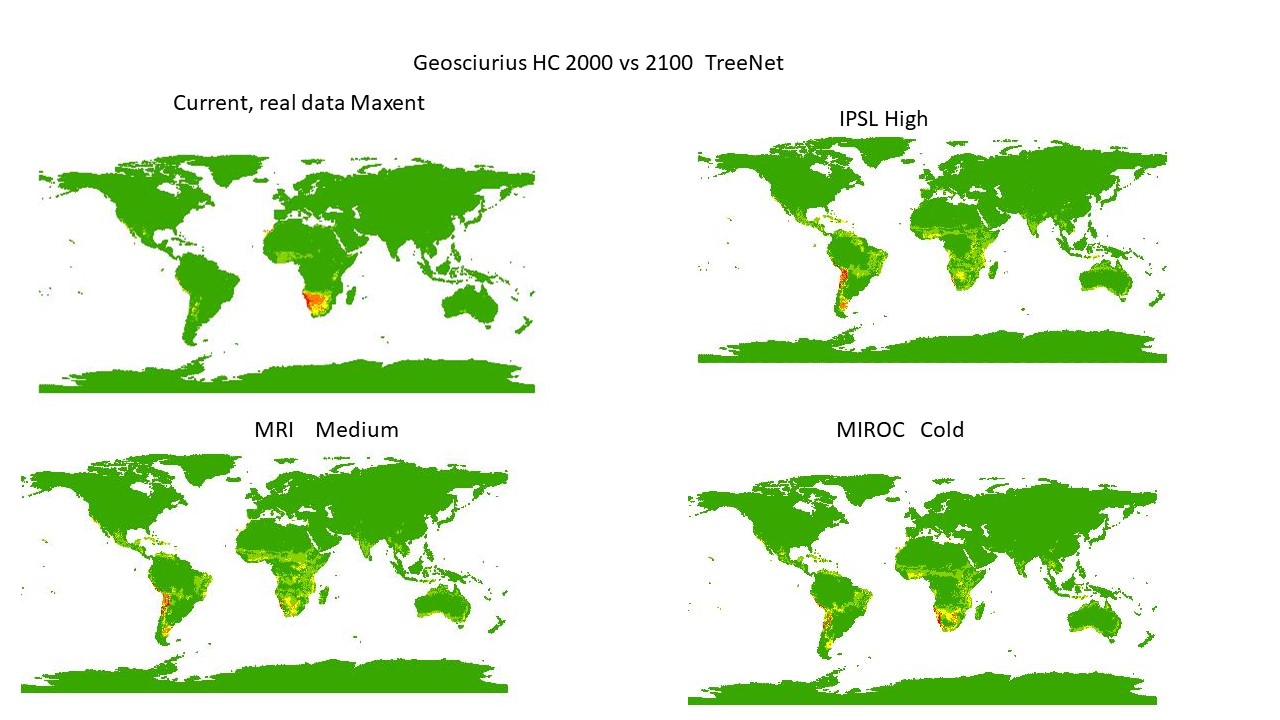
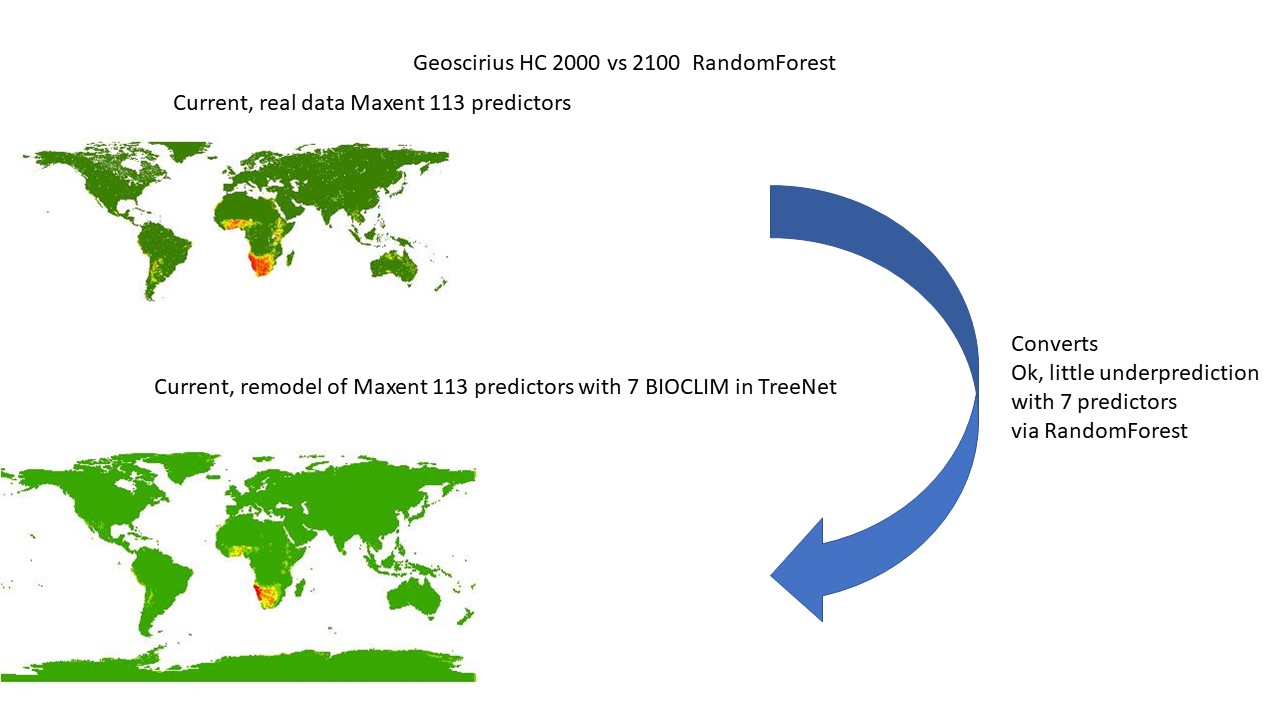
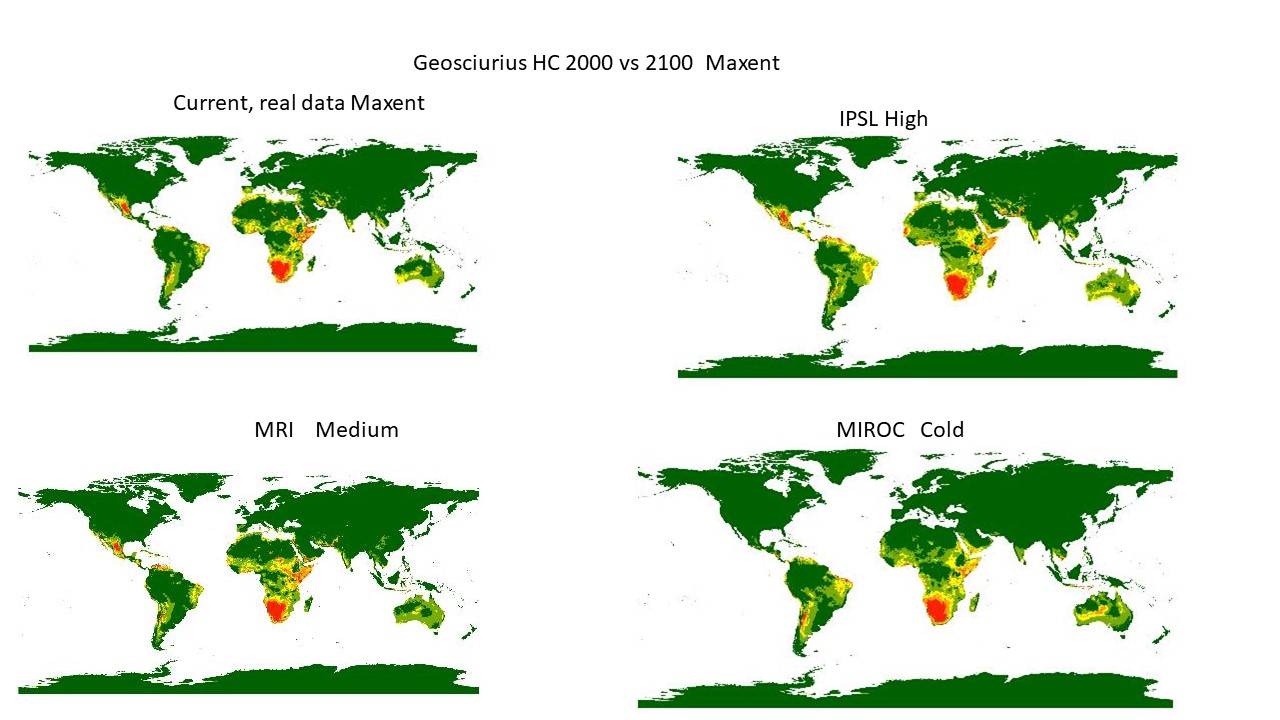
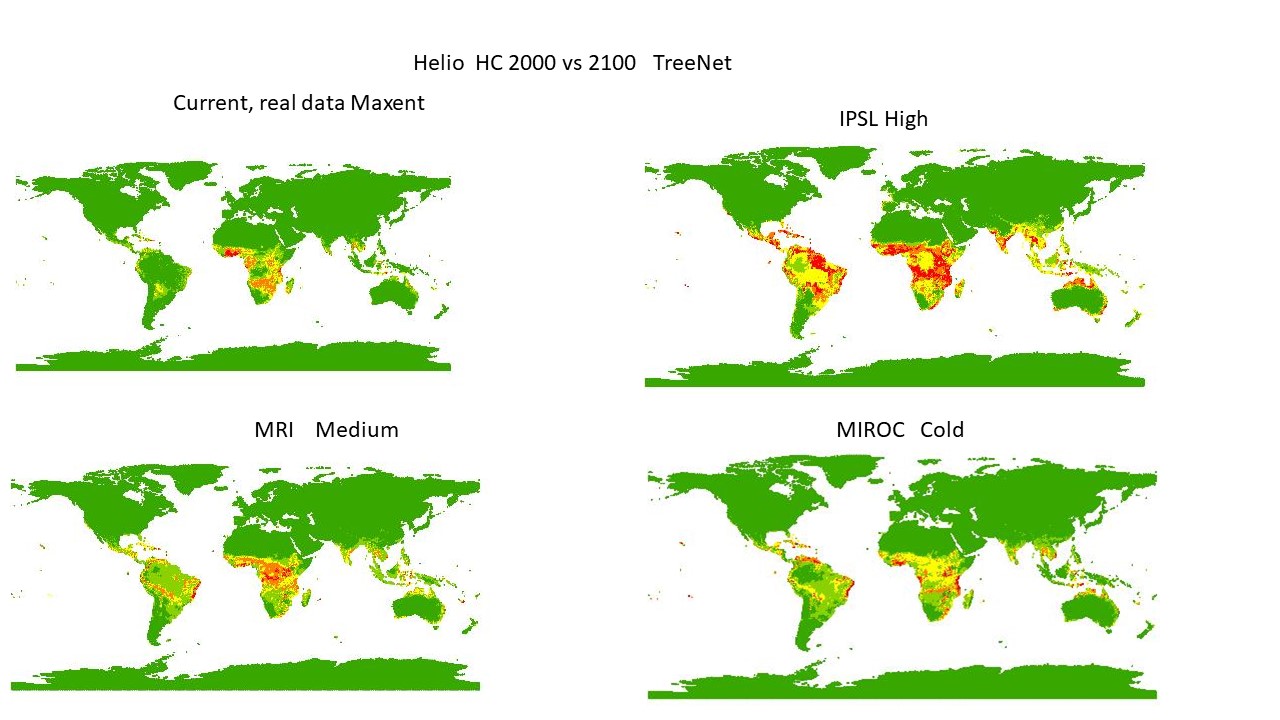
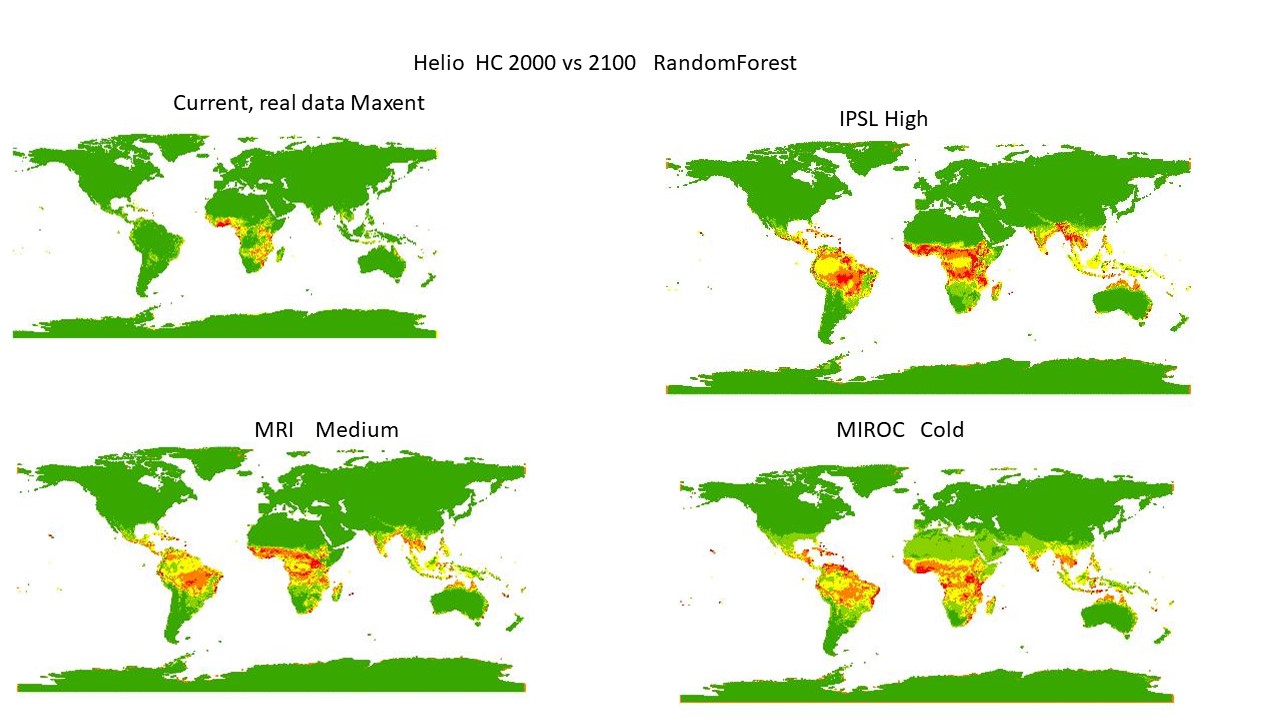
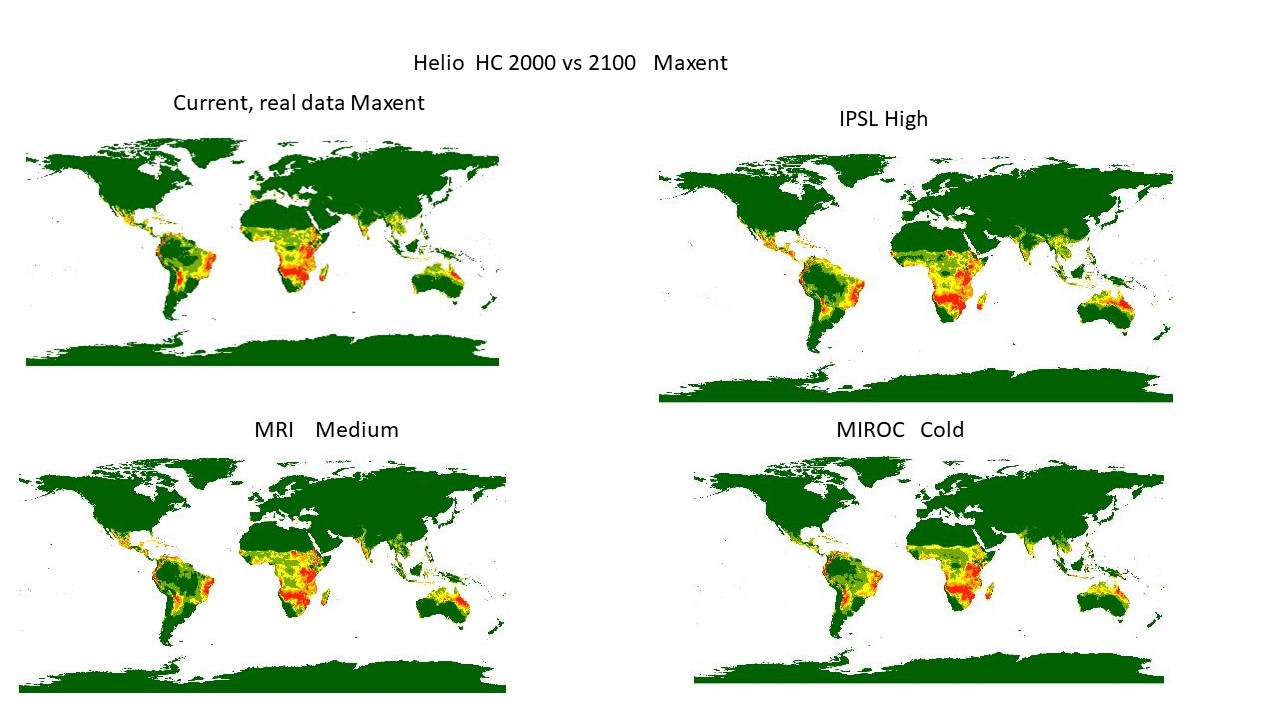
We created globally important hotspot and coldspot maps and modeled them forward with bioclimatic variables from Worldclim.org (BIOCLIM), using 3 machine learning algorithms (for TreeNet, Random Forest, and Maxent), globally with 0.5-degree pixel accuracy.
We used three climate scenarios, namely MRI, ISPL, and MIROC. Those come from a wide variety of possible climate scenarios. To start the rapid assessment here, we tried to show three scientifically accepted climate scenario models and apply them to the world’s squirrels and some genera belonging to them. Our results indicate underpredictions but already show a generic distribution shift for the majority of squirrel species, especially for the World’s Top Ten Squirrel species. Most importantly, we see a shift of the core ranges, as well as a fragmentation of the distribution for squirrels. Such patterns are known to result in population stress, often extinction, especially in island environments [30], [31], [32], [33], [34]. To summarize, an overview of some globally observed trends has been created (Table 3).
Table 3
Selection of landscapes and habitats affected for squirrels by our 2100 models
| Landscape/habitat | Selection of countries affected | Comment |
| Europe | Germany, France, Switzerland, UK, Italy, etc. | A heavy fragmented squirrel habitat and clear shift to Scandinavian/ North-Eastern countries |
| Western North America | U.S. | A key region for squirrel biodiversity with high abundance |
| Latin America | Brazil, Ecuador | A key region for squirrel biodiversity |
| Central America | Costa Rica, Panama | A key region for squirrel biodiversity |
| Central Asia | Kazakhstan | A key region for squirrel range expansion with higher squirrel density and diversity |
| North Africa | Algeria, Morocco, Tunisia | Becomes less interesting for an increased warming scenario (MRI, IPSL), but more interesting for cooling scenarios (MIROC). |
| South Africa | South Africa | Becomes a habitat less desired and populated by squirrels |
| S.E. Asia | Indonesia, Malaysia | A very diverse landscape with high squirrel biodiversity, but also extinction |
| Islands | | A key area affected by climate change shifts |
| Mid-elevation mountains | Austria, Switzerland, Alps | A key region for squirrel refugium |
| Tropics | Brazil, Congo, Indonesia, Malaysia | A key region for squirrel biodiversity |
| Boreal Forest | Russia, Canada, Alaska | A key region for northern squirrel species |
As seen in the maps and a selection presented in Table 3, for landscapes and habitats affected, it is clear that Central America, as well as Latin America, are future conservation hotspots for squirrels, even genera that currently do not occur in this part of the world would flourish there well. The same can be said for Central Europe, parts of western North America, Central Asia, and parts of North and South Africa, and the entirety of South-East Asia. Islands should receive the most attention, as well as some mid-elevation mountain areas, the tropics overall, and also the boreal forest and parts of Patagonia.
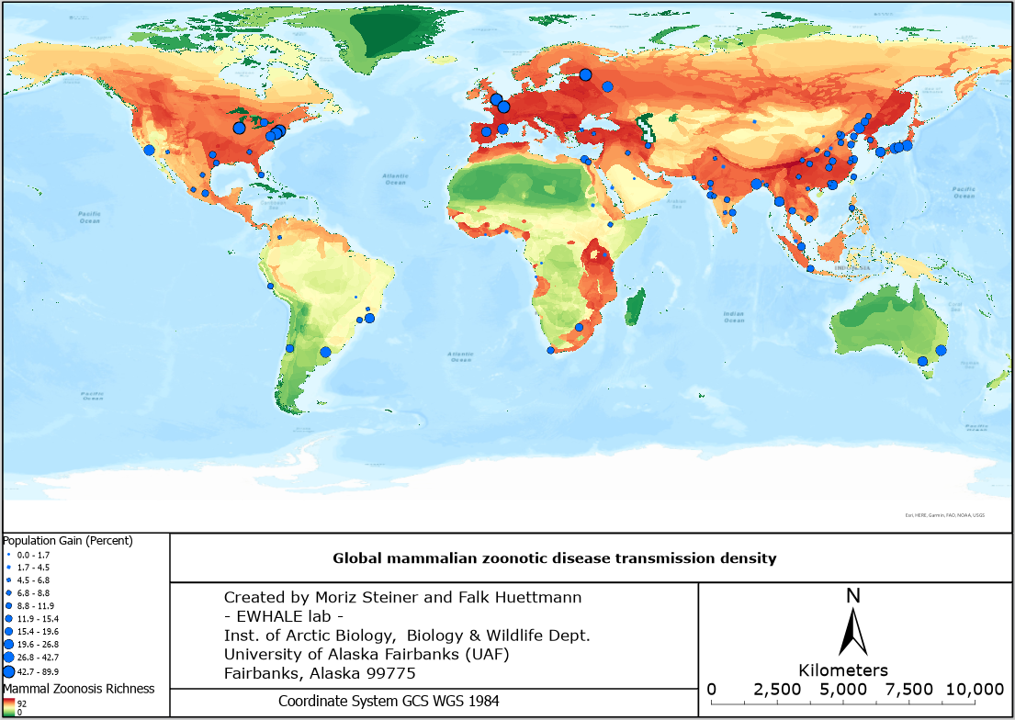
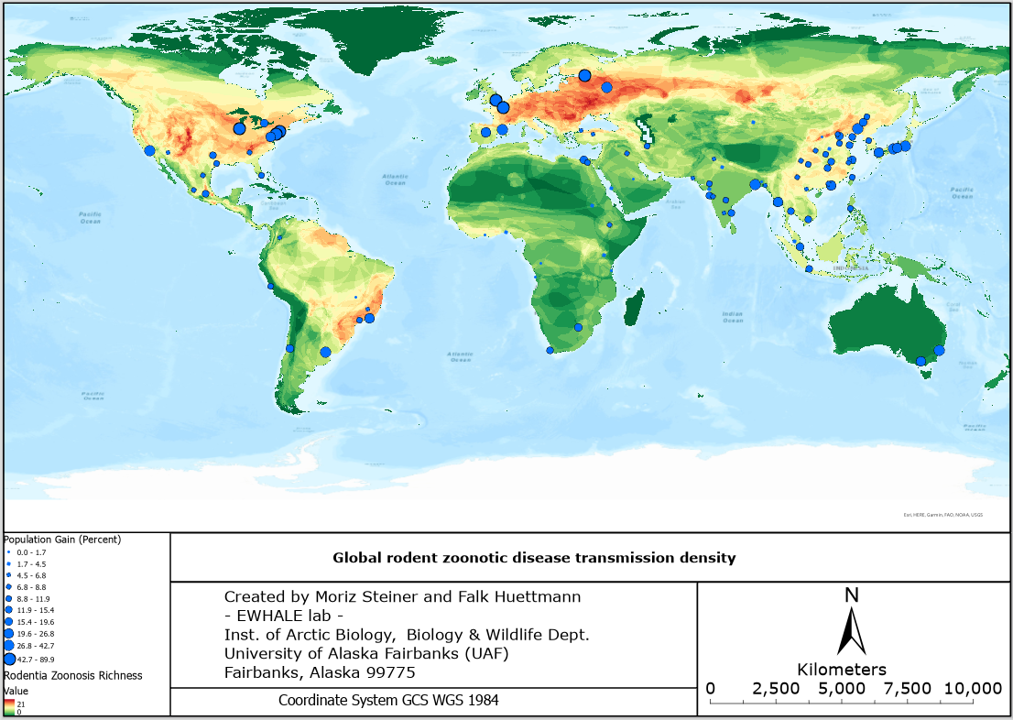
These indicated squirrel hotspot regions correlate not surprisingly with the global hotspots of zoonotic disease transmission recently published by [35]. Especially the disease transmission for rodents correlates with the squirrel hotspots. Within these squirrel hotspots, one can find rural, and suburban areas, but also urban areas with a high human density. All this together indicates that the frequency of zoonotic disease transmission between rodents (squirrels) and humans is on the rise, negatively influencing both parties -[36], [37], [38].
This approach here aims to utilize holistic assessment methods and to initiate/ present a workflow with data [39]. We here tried to present the global species trend and some rough subdivisions in order to publish a global big-picture of the situation for rapid assessment actions. In depth-analyses are always a follow-up option that can be achieved starting with the data and methods used and presented here, e.g. by using a regional or species-specific approach (see the Tropics [2d] and Islands [2e]). The rapid assessment methods used here, primarily aim to present and start such views and initialize debates and discussions on this topic. Without acknowledging a marginalized and undesired scenario/ outlook, no betterments can be expected.
While our models just deal with bioclimatic predictors as proxies for the future, the real-world changes in the next 100 years are likely bigger, more complex, and severe. For instance, human population increase is expected, more consumption of natural resources, increased contamination, more pandemics, and loss of wilderness. We believe that our models represent a minimum estimate of what is to come and what squirrels are facing, and those findings should present a good foundation for sustainable action.
We acknowledge that the true future remains unknown; there is no single solution to knowing what 2100 will be like. Here we had to use a narrow and parsimonious approach still. But arguably, the patterns and trends we see are robust, and they are already a concern and most of them are not in favor of a good future for these species in the Anthropocene [40], [41], [42], [43], [44].