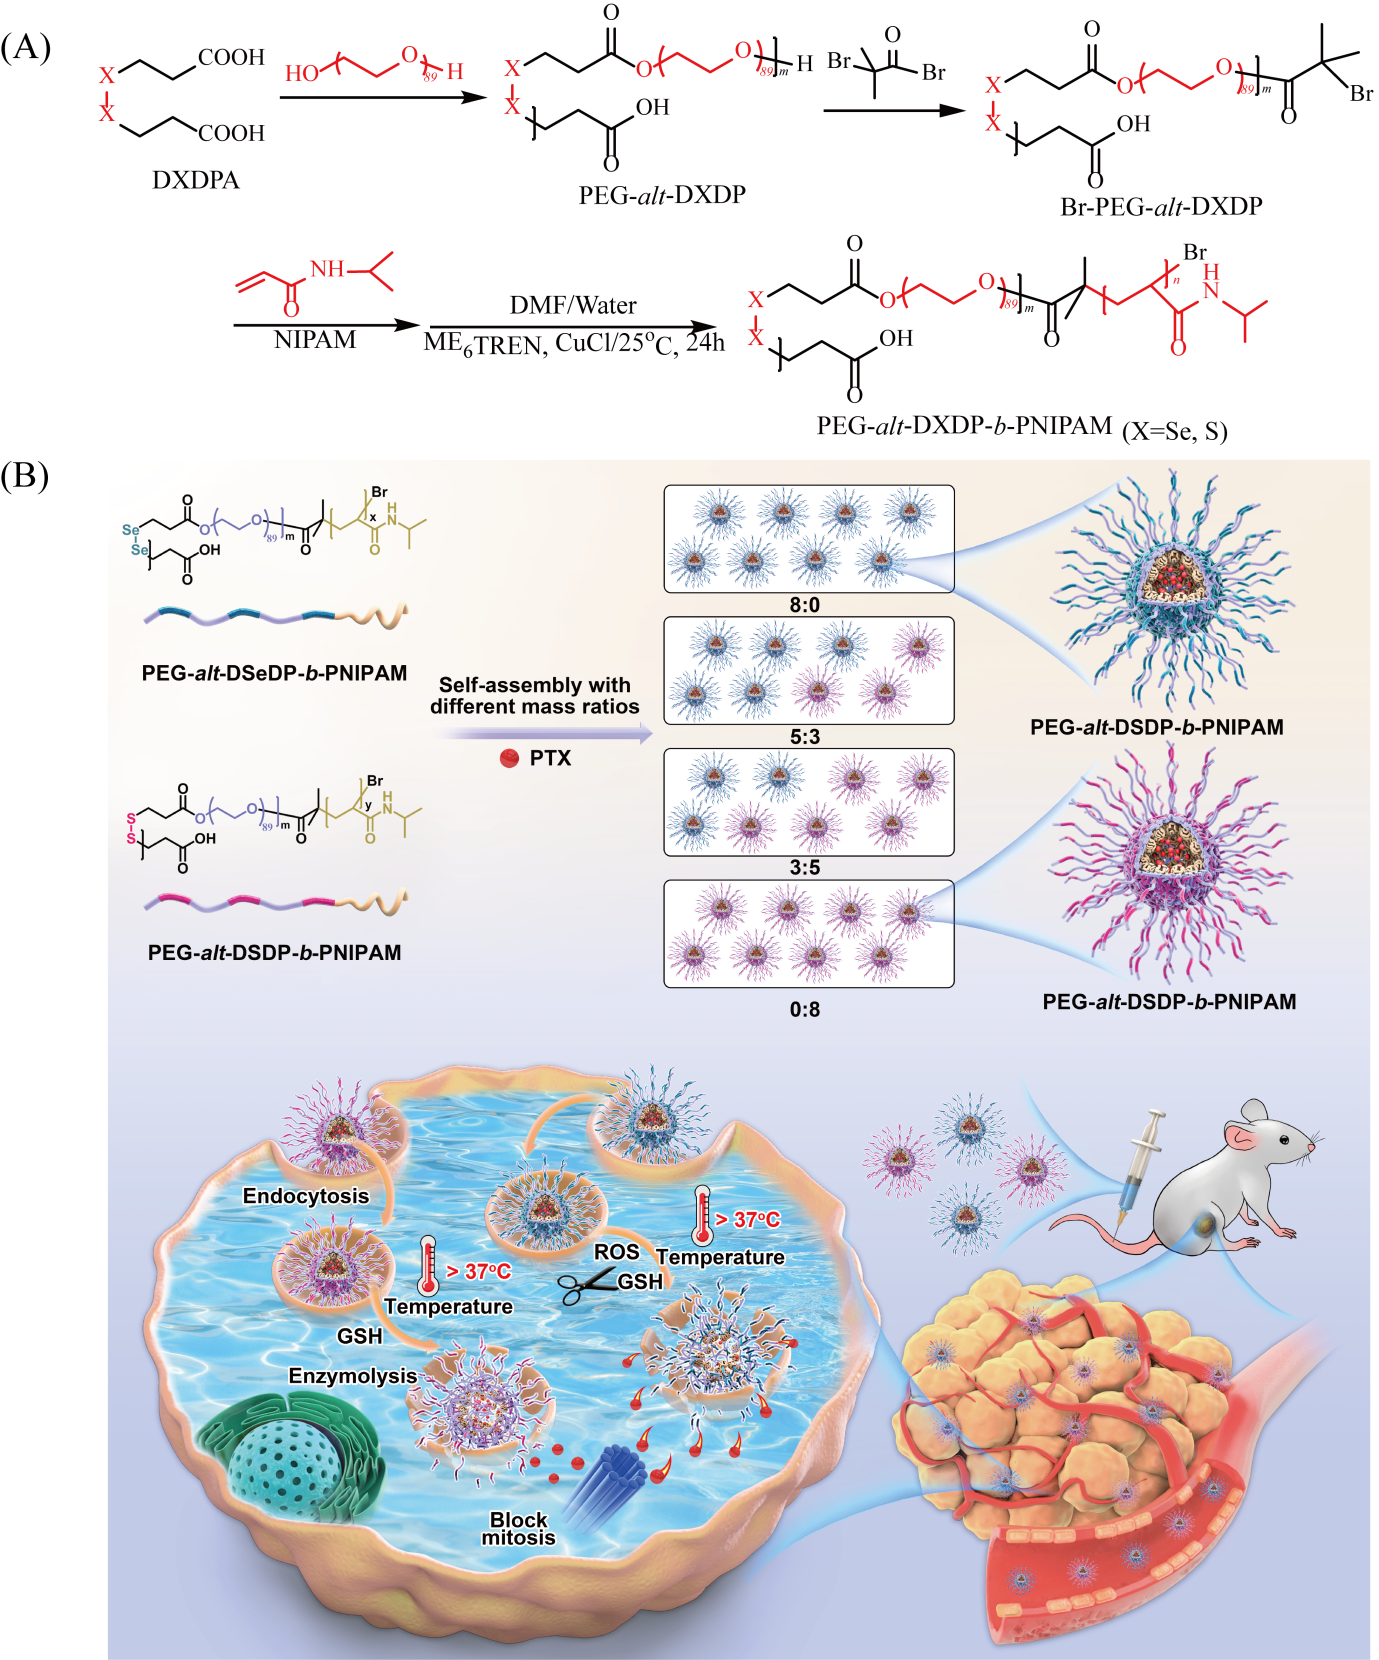
3.1 Synthesis and characterization of PEG-alt-DXDP-b-PNIPAM
The dually responsive copolymers PEG-alt-DXDP-b-PNIPAM (X = Se, S) with diselenide/disulfide linkages were synthesized via alternative esterification and ATRP polymerization.
The chemical structures of copolymers and their intermediates were confirmed by 1H NMR and FTIR spectra. The results were shown in Fig. 1(a-c) and Figure S1-S3. 1H NMR and FTIR spectra of DSeDPA as shown in Figure S1 indicated that the chemical shifts of –SeCH2CH2-, –SeCH2CH2- and -CH2CH2COOH emerge at 2.85, 3.10, and 12.37 ppm, respectively. In addition, the characteristic peaks at 527, [25] 797, 1700, 2894–2944 and 3330–3630 cm-1 were successively attributed to –C-Se, -Se-Se-, -C = O, –C–H vibration band and –OH in –COOH. After PEG introduction, the peaks at 2.85, 3.10 ppm still existed. By contrast, almost no difference could be observed except for the chemical shifts of at 2.90, 2.75 ppm in Figure S3(a) ascribed to –SCH2CH2-, –SCH2CH2-, respectively, chemical shifts of methane protons in PEG appear at 3.65, 4.25 ppm, suggesting the formation of PEG-alt-DXDP. Further, the preparation of PEG-alt-DSeDP was also proved by the characteristic peaks including 527 cm-1 for –C-Se, 797 cm-1 for -Se-Se-, 1112 cm-1 for –C-O-C-, 1738 cm-1 for ester –C = O, 2892 cm-1 for –C-H vibration and 3293–3666 cm-1 for –OH belonged to free terminated –COOH in Figure S2(b). The position of characteristic peaks of PEG-alt-DSDP was similar to PEG-alt-DSeDP, as shown in Figure S3(b).
Some chemical shifts including –CH2– repeated units at 3.65 ppm in PEG, –CH2– near to diselenium bond at 2.85 and 3.10 ppm, –CH2– connected with PEG at 4.25 ppm, methyl proton in –CH(CH3)2 belonged to NIPAM at 1.17 ppm, –CH2– in main chains at 1.36–1.74 ppm, methyne proton in –CH(CH3)2 at 4.03 ppm and amide proton at 6.48 ppm are clearly visible in Fig. 1(a), indicating the formation of PEG-alt-DSeDP-b-PNIPAM. Similarly, almost no significant difference was observed between Fig. 1(a) and 1(b), except the chemical shifts that emerged at 2.90 and 2.75 ppm in Fig. 1(b) that associated with –CH2– in DSDPA, suggesting the successful synthesis of PEG-alt-DSDP-b-PNIPAM. Afterward, in Fig. 1(c), the characteristic peak of –C-Se, -Se-Se-, -C-O-C- bond in PEG, –C = O, –C–H vibration band appear at 527, 797, 1110, 1730 and 2875–2925 cm-1, respectively, in addition, the features peaks at 1550, 1652 and 3072 cm-1 were allocated to the amide II, I and III band, respectively, ester –C = O appear at 1735 cm-1. Due to the hydrogen bonding association, the peak at 3450 cm-1 was caused by the stretching vibration of –NH– in PNIPAM blocks. The tagged peaks of PEG-alt-DSDP-b-PNIPAM were basically consistent with PEG-alt-DSeDP-b-PNIPAM, further signifying that the formation of the two copolymers.
As an important parameter, molecular weight is of great importance to the properties and applications of copolymers. It was observed that the monomodal and quasi-symmetrical elution curves in Fig. 1(d) after PEG and NIPAM introduction, indicating good control during all synthesis procedures. The products were with high purity for PDI was lower than 1.50. Approximately 8 DSeDPA and 8 DSDPA were esterfied with 8 PEG, respectively, yielding (PEG-alt-DSeDP)8 and (PEG-alt-DSDP)8. It could be calculated that 78 and 91 NIPAM units were copolymerized in (PEG-alt-DSeDP)8-b-PNIPAM78 and (PEG-alt-DSDP)8-b-PNIPAM91, respectively. The above results are listed in Table 1.
Table 1
Molecular weight of polymers
| Polymers | Molercular weight from GPC |
| Mn | Mw | PDI | Monomer conversion ratio (%) |
| PEG-alt-DSeDP | 18,566 | 26,549 | 1.48 | |
| PEG-alt-DSDP | 18,000 | 21,420 | 1.19 | |
| PEG-alt-DSeDP-b-PNIPAM | 27,380 | 35,046 | 1.28 | 52.00 |
| PEG-alt-DSDP-b-PNIPAM | 28,283 | 35,303 | 1.39 | 60.67 |
3.2 Self-assemble behavior of copolymers
In view of hydropathy differences between PEG-alt-DXDP segment and PNIPAM blocks, the nanomicelles with PNIPAM core and PEG-alt-DXDP shell were formed, in which diselenide and disulfide bonds served as linkages on the hydrophobic and hydrophilic interfaces. To identify the generation of nanomicelle, pyrene probe was introduced to assemble with prepared nanomicellar solution with different concentrations (5×10− 5~5×10− 1 mg L− 1) for CMC measurement. The curves of pyrene fluorescence intensity ratio I383/I372 versus logarithm of nanomicellar concentration were presented in Fig. 2(A). S4 has a lower CMC value of 37.88 mg L− 1 than other nanomicelles, which were ascribed to more hydrophobic NIPAM units contained than that in other copolymers. Thus, S3 and S4 nanomicelles are liable to form at relatively low concentrations and maintain micellar structure during blood circulation, implying the potential as a carrier for drug sustained release. By contrast, S1 and S2 have fewer NIPAM units, leading to higher CMC value (97.60 and 58.89 mg L− 1) and weaker protection for PTX. Even so, the rapid response of diselenide bond makes S1 and S2 good carrier candidates for explosive drug release.
The enhanced hydrophobicity of cores after PTX encapsulation results in the decreased CMC compared with blank nanomicelles (Table 2 and Figure S4), including 57.91, 44.49, 25.30, and 9.78 mg L− 1, corresponding to PTX-loaded S1, S2, S3 and S4, respectively. It was suggested that PTX could be sheltered by PEG-alt-DXDP shell.
Zeta potentials indicated that all nanomicelles were positively charged. High absolute zeta potential values indicated the system stability by the exclusion and dispersion degree of adjacent particles. The higher potentials caused by a fine balance of attraction and repulsion can result in a jarless dispersed system, while the lower potentials indicated destroy and flocculation deposition of the system. [27] It was reported that positively nanomicelles were more likely to be absorbed into the negatively charged cell membrane. In this work, zeta potential of nanomicelles was in the range of 24.93 ~ 29.29 mV, indicating good stability and the possibility of uptake and internalization into cells.
3.3 Thermo, redox responsive behaviors of nanomicelles assembly
As the incorporation of PNIPAM, the LCST of polymers was determined by UV-vis spectrums and shown in Fig. 2(B). The LCST obviously decreased with the increase of NIPAM number and reached 40.83, 38.75, 38.47, and 37.56 oC corresponding to S4, S3, S2, and S1, respectively. The similar LCST of S3 and S4 nanomicelles was ascribed to the equivalent NIPAM content. When the temperature was above LCST, PNIPAM blocked undergo hydrophilic-hydrophobic conversion and become nanomicellar core. It was noteworthy that all LCSTs were higher than 37oC, and the prepared nanomicelles were expected to realize temperature controlled release.
To investigate whether the diselenide and disulfide linkages could be cracked under reduced or oxidized physiological microenvironment, the as-prepared S1 and S4 nanomicellar solution was incubated with 10 mM GSH within 0.5, 4, 24 h before DLS measurement, while the nanomicelles were treated without GSH as control. After the reduction of diselenide bond into selenol by GSH, the enhanced hydrophilicity of selenol strengthens the swelling effect of the nanomicellar shell, [28] yielding gradually larger nanomicelles size from 127.1, 143.8 to 254.3 nm (Fig. 3A(b-d)) along with GSH incubate time, which far exceed 106.2 nm of nanomicelles without reduction (Fig. 3A(a)). Afterward, diselenide bonds were oxidized to seleninic acid by 100 µM H2O2, obtaining nanomicelles with 86.9 nm of average Dh (Fig. 3A(e)), thereby the redox-responsive property was confirmed. Further, the morphologies and size distribution for the above nanomicelles were also observed by TEM and illustrated in Fig. 3(B-E). As exhibited in Fig. 3(B), the anticipated core-shell structure with 60 nm of average diameter was formed preliminarily. After GSH reduction for 24 h, a large number of alveolate holes were visible in nanomicelles and their size presented a sharp increase to 232 nm from Fig. 3(C), consistent with the DLS results in Fig. 3(A). However, under the oxidization of 100 µM H2O2, the damaged nanomicelles with blurred boundaries appear at first, then converted into irregular aggregation and even disassemble into tiny debris with the size of about 44 nm in Fig. 3(D), signifying that the oxidation trigger had indeed lead the diselenide bond cleaved into seleninic acid. It was thereby concluded that S1 nanomicelles possess the redox-responsive property under GSH, H2O2 triggers. The smaller nanomicellar size monitored by TEM than DLS was caused by PEG dehydration during the sample preparation. [29] The core-shell appearance was still maintained, and the selenium granules were squeezed to the margin of nanomicelles. With the introduction of PTX into the nanomicellar core, the size of PTX-loaded S1 nanomicelles increased to 112 nm in Fig. 3(E) compared with 60 nm of blank S1 nanomicelles. Moreover, PTX was released under the condition of pH 5.6 PBS containing 10 mM GSH at 40 oC (above LCST) for 82 h as exhibited in Fig. 4A(b). The morphology of PTX-loadedloaded S1 nanomicelles released in pH 5.6 PBS containing 10 mM GSH at 40 oC (above LCST) for 82 h was shown in Fig. 3(F), the sharply increased size of the new-formed alveolate core-shell nanomicelles is clearly visible, which might be caused by the continuous reduction from GSH and the leftover PTX. Moreover, the jaggy reduction degree yielded the uneven nanomicellar size. Likewise, the changes of Dh and morphology of S4 nanomicelles in the presence of GSH and H2O2 were in agreement with S1 nanomicelles, see in Figure S5.
3.4 Thermal and redox induced PTX release
As one of the widely used anticancer drugs in clinic applications, PTX was selected for drug encapsulation and release investigation through dialysis method. The multifactor including hydrogen bonding, electrostatic and hydrophobic interactions between PTX and PNIPAM blocks yield a 13.67%, 11.11%, 10.58% and 12.11% of LC, 54.63%, 40.00%, 42.32% and 48.14% of EE value for PTX-loadedloaded S1-S4 micelles, respectively. In fact, there were no obvious differences between both LC and EE for PTX-loaded S1-S4 nanomicelles, on account of the synergistic effects including the same feed ratio of DXDP, PEG and NIPAM during copolymer preparation, as well as the mass ratio between copolymer and PTX. Taking CMC, zeta potentials and other factors into consideration, lyophilized PTX loaded S1 and S4 nanomicelles were selected for further drug release.
Then, the thermo and redox triggered drug release behavior of PTX-loaded S1 and S4 nanomicelles were separately assessed under the condition of (a) pH 7.4 PBS at 37 oC, (b) pH 5.6 PBS containing 10 mM GSH at 40 oC, (c) pH 5.6 PBS containing 100 µΜ H2O2 at 40 oC and (d) pH 5.6 PBS with 100 µΜ H2O2 at 40 oC for 82 h, the results were shown in Fig. 4. Only 32.91% of PTX was released from S1 nanomicelles in normal physiological signals from Fig. 4A(a), while 17.17% of PTX was release from S4 nanomicelles at pH 7.4 (Fig. 4B(a)). Approximately 76.90% of PTX were released within 23 h from S1 nanomicelles after the reduction of GSH at 42 oC in Fig. 4A(b), respectively, which was 2.33 times than that in pH 7.4 at 37 oC and ascribed to the fast demicellization and rearrangement of PTX loaded nanomicelle, together with phase transformation of PNIPAM stimulated by temperature. However, not until 82 h was PTX released from S4 and reached the peak of 64.53%, suggesting that PTX sustained release has realized in Fig. 4B(b). Meanwhile, the cumulative PTX release was 59.18% under synergistic trigger of 100 µΜ H2O2 and temperature, see in Fig. 4A(d). However, the fast and even burst release rate of PTX from S1 nanomicelles in Fig. 4A can be ascribed to only diselenide bond possessed in nanoformulations and its higher bonding energy and fast response mechanism. As expected, the more desirable PTX release performance of the well-prepared S2 and S3 nanomicelles composed of S1 and S4 copolymers than that of pure S1 and S4 nanomicelles is illustrated.
3.5 In vitro cytotoxicity of nanomicelles
MTT assay was performed for evaluation of the cytotoxicity of free PTX, blank and PTX loaded S1-S4 nanomicelles against L929 and HCT116 cells. The cell viability of the cells cultured with free PTX at a different concentration of 0.01 ~ 20 µg mL− 1 and blank, PTXloaded loaded nanomicelles at varied concentrations of 1 ~ 500 µg mL− 1 for 24 h. IC50 of PTX against L929 cells is 1.5 µg mL− 1 in Figure S6, and the cell viability of L929 cells treated with blank nanomicelles are over 84%, and some even surpass 100%, which may be ascribed to selenium microelement contained in nanomicelles, thereby having a great potential in tissue damages repairing caused by PTX and cell growth to some extent. Moreover, the death of a small number of L929 cells in Fig. 5(B) predicted the negligible cytotoxicity of PTX loaded S1-S4 nanomicelles, indicating the biocompatibility of nanoformulations. Due to the presence of diselenide and disulfide bond in the scaffold of copolymers, the combinations of S1 and S4 nanomicelles have a great potential in the recognition of normal and cancerous cells.
3.6 Cellular uptake and apoptosis
A confocal laser scanning microscope (CLSM) was selected to qualitatively investigate celluar uptake behavior of the PTX loaded S1-S4 nanomicelles and free PTX. The cell nucleus, scaffold and nanomicelles were separately stained by DAPI, FITC and Dil. Figure 6 exhibits the fluorescence photos of Colon26 cells cultured with free PTX and PTX loaded nanomicelles for 6 h. Since PTX itself is not fluorescent, there was no fluorescence observed in free PTX group. In contrast, Dil-stained nanomicelles with varied red fluorescence could be seen in all groups and mainly accumulated around the nucleus, which is due to the similar size of nanomicelles. It is noteworthy that the fluorescence intensity decreases gradually in the order of S1, S2, S3 and S4, which is caused by the different content of diselenide and disulfide linkages contained in nanomicelles, and resulting in varied amount of PTX released from nanocarriers. loadedWith the regulation of the diselenide linkages, PTX loadedloaded S1-S3 nanomicelles released more PTX, while the S4 nanomicelles containing only disulfide linkages showed a slow release rate.
In addition, the celluar uptake was also confirmed quantitatively using flow cytometry, as shown in Fig. 7. After incubation with free PTX and PTX loaded nanomicelles for 6 h, as presented in Fig. 7(A-G), the parent of internalized nanomicelles against Colon26 cells was 95.1%, 90.5%, 91.0%, 89.6% corresponding to S1, S2, S3 and S4, respectively, which is almost in agreement with the changing trend of fluorescence intensity in Fig. 6. These results imply that the internalization of PTX loadedloaded S1-S4 nanomicelles occur through EPR effect, following dispersion, accumulation and PTX specific release. The apoptotic ratio of cells treated with free PTX and PTX loadedloaded micelles was also monitored through flow cytometry and shown in Fig. 7(H). 23.17%, 75.93%, 69.41%, 58.50% and 45.92% of apoptotic ratio are corresponding to PTX and PTX loadedloaded S1-S4, respectively, suggesting that the poor water solubility of PTX restrict indeed its ability to kill Colon26 cells. In contrast, the prepared S1-S4 nanomicelles could solubilize and realize controlled, targeted PTX release. Moreover, the increased cytotoxicity and PTX release rate of PTX loaded S1-S4 nanomicelles is proportional to the content of diselenide linkages.
3.7 In vivo anticancer evaluation and histological analysis
The biotoxicity and antitumor efficacy of PTX loadedloaded S1-S4 nanomicelles were assessed using Balb/c mice bearing 4T1 tumor. PTX loadedloaded S1 nanomicelles showed significantly tumor suppression and weight growth at a dosage of 5 mg kg−1 of PTX (Fig.8(A) and 8(B)), especially for S1, compared with the limited inhibition from PTX. Tumor inhibition ratio of free PTX, PTX loadedloaded S1, S2 is 18.24, 45.27 and 36.49%, respectively. It is obviously observed that the different therapeutic effect of PTX
Figure 8 In vivo inhibition tumor efficacy of nanomicelles. Tumor volume (A) and body weight (B) of mice bearing 4T1 tumor treated with free PTX, normal saline, PTX-loaded S1 and S4 nanomicelles at a dose of 5 mg kg− 1 over 15 days. Excised 4T1 solid tumors from different treatment groups on day 15 (C). H&E stained major organ sections after 15d treatment from different groups. (D)
-loaded nanomicelles with diselenide and disulfide bonds against 4T1 tumor, indicating the burst and controllable PTX being released from nanomicellar assembly upon triggered by GSH, ROS and thermal stimulus. The excised tumor size from Fig. 8(C) is basically consistent with tumor volume using PTX and nanomicelles treatment.
The histological study in the H&E staining method revealed that there is no obvious lesion can be observed in the group treated with PTX loaded nanomicelles, while the serious cardiotoxicity exhibited from PTX treated mice in Fig. 8(D), [30] reflecting that PTX entrapped nanomicelles are biocompatible in vivo and can release its cargo at the tumor site.