Physiochemical Properties
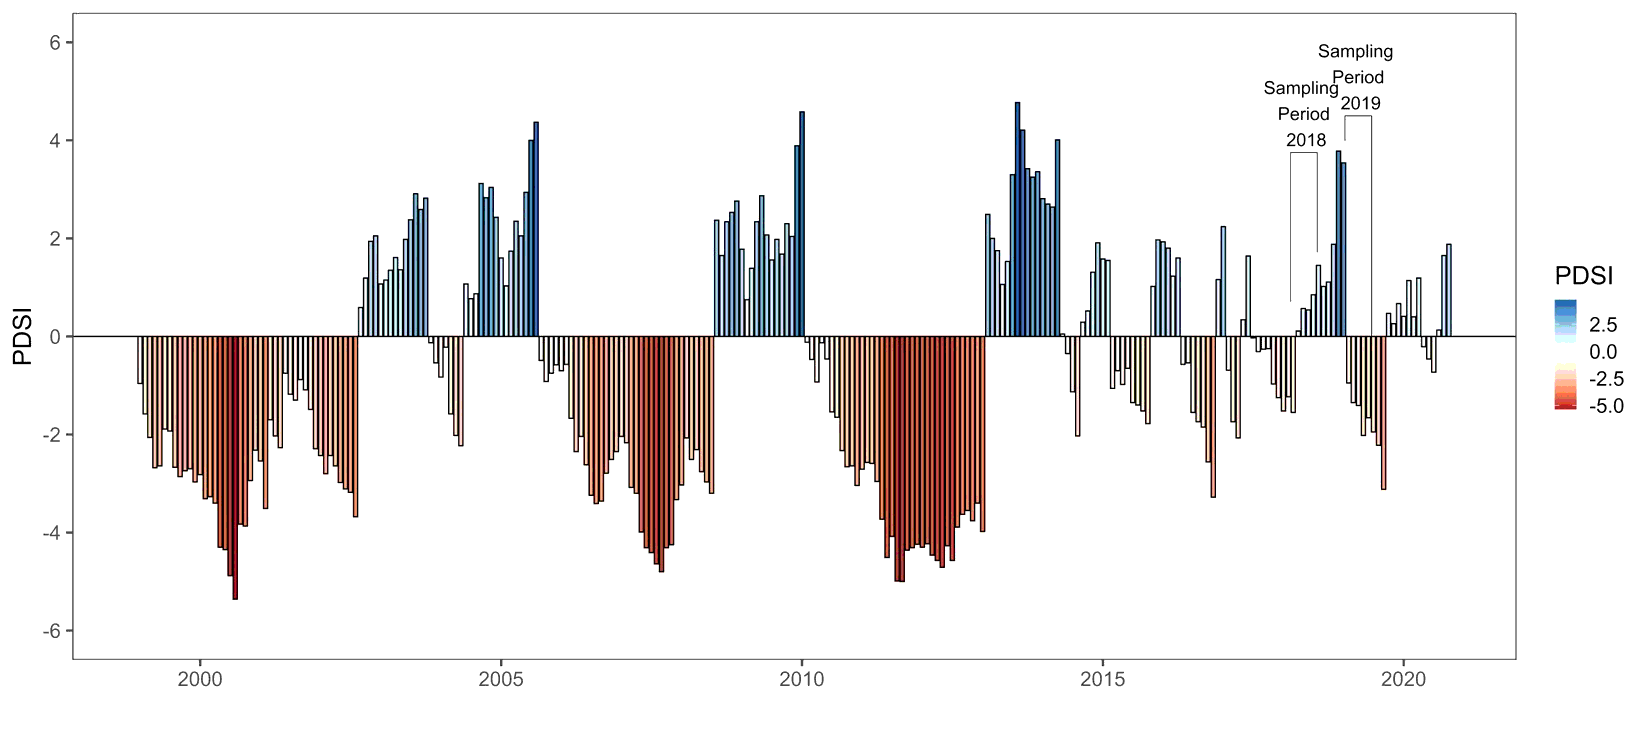
Wetland conditions differed between years with 2018 having a relatively short hydroperiod (~ 120 days) compared to 2019 (~ 365 days). While rainfall totals were similar between water years 2018 and 2019, at 1259 and 1420 mm respectively, the timing was different (Fig. 1b). Litter bags inundated in February of 2018 and most wetlands were dry at the deepest location by late June, though our litter sites tended to dry in late April to early May 2018. Because many of our litter sites within wetlands never inundated during 2018, a subset that did inundate were chosen for analysis between wetland types (5 locations across 3 wetlands of each type). Heavy rains in mid-July 2018 refilled the wetlands and they maintained water levels through the following water year. Intermittent flow from agriculture fields was established for a short period at the start of 2018 sampling but only connected to W69, the most upstream wetland along the path. Because of generally wetter conditions in 2019, flow connected to all wetlands from the start of sampling through early April and all litter sites were inundated for the sampling period.
Water quality patterns differed between years with generally greater concentrations seen across all parameters upon initial filling in 2018 as compared to increasing values over the sampling period in 2019. We found that dissolved organic carbon (DOC) varied by sampling date (F16, 149=33.44, p < 0.001) and due to the interaction of wetland type and date (F16,149=2.95, p < 0.001), but not between wetland types (F1,149=2.16, p = 0.216). Post hoc comparisons revealed that DOC levels were similar between wetland types in 2018 and at the start of sampling in 2019 but diverged in late April and marginally in late May with greater levels in unconnected wetlands before becoming similar on the final sampling date (Fig. 2a). TDN varied significantly across sampling date (F16,149=12.46, p < 0.001) and the interaction of wetland type and sampling date (F16,149=346, p < 0.001), but not due to wetland type alone (F1,149=1.97, p = 0.233). Upon filling, unconnected wetlands had a TDN pulse resulting in greater initial values, followed by similar levels between wetland types for the remainder of the sampling year. In 2019, unconnected wetlands tended to have greater TDN values, but a significant difference was only detected in late April (Fig. 2b). TDP only varied by sampling date (F16,149=8.43, p < 0.001). Though no significance was detected, TDP levels in the connected wetlands declined from the most upstream wetland downstream (Fig. 2c). Dissolved inorganic carbon (DIC) varied by wetland type (F1,149=32.21, p = 0.004), date sampled (F16,149=15.63, p < 0.001) and their interaction (F16,149=6.05, p < 0.001). DIC values were similar upon initial filling in 2018 followed by a significant increase in connected wetlands that remained for the sampling year. In 2019, levels generally remained similar in the first month of sampling followed by a significant increase in connected wetlands for the remainder of the year. NH4-N varied across date sampled (F16,149=16.05, p < 0.001) and marginally due to the interaction (F16,149=1.65, p = 0.064), but not across wetland type (F1,149=0.19, p = 0.691). We saw similar trends with NO3-N with concentrations varying across date (F16,149=19.20, p < 0.001), but not across wetland type or their interaction (F16,149=0.70, 1.57, p = 0.448, 0.084). In 2018, an initial NO3-N pulse occurred in unconnected wetlands upon filling followed by similar levels between wetland types for the remainder of sampling. In 2019, NO3-N levels began low and tended to increase over time. Sampling date (F16,149=3.03, p < 0.001) and the interaction of wetland type and date were significant for SRP (F16,149=2.53, p = 0.002). SRP concentrations in connected wetlands were significantly greater than unconnected wetlands on the first sampling date and again in late May just before most sites dried in 2018. This difference was largely due to high SRP levels detected in the most upstream wetland, W69. In 2019, while connected wetlands tended to have greater SRP values, there was no significant difference (Supplement Table 1).
Leaf-Litter Decomposition and Nutrient Composition
Leaf litter decomposition did not vary as a result of litter bag mesh size (F1,39=1.74, p = 0.200) or wetland type (F1,39=1.9, p = 0.195). However, litter decomposition varied by year (F1,39=37.20, p < 0.001) and the interaction of wetland type and year (F1,39=17.47, p < 0.001). In 2018, no significant difference in breakdown rates were observed between wetland types, while in 2019, connected wetlands had significantly faster breakdown rates (k = 0.0052 day− 1) compared to unconnected wetlands (k = 0.0030 day− 1) (Fig. 3a). Connected wetlands also had significantly faster breakdown rates in 2019 compared to 2018 (k = 0.0018 day− 1).
Final molar C: N ratios were significantly greater in unconnected wetlands compared to connected wetlands (F1,40= 7.01, p = 0.021) with no significant difference due to year, mesh size or the interaction. Overall, increased reduction in C:N over the experiment in connected versus unconnected wetlands was the due to greater reduction in C in connected wetlands (Fig. 3b). Final molar C: P ratios were greater in unconnected wetlands (F1,40=5.83, p = 0.031) and marginally greater in 2018 compared to 2019 (F1,40=3.92, p = 0.056). In 2018 this difference among wetland types were largely driven by W69, while a greater period of flow in 2019 increased P immobilization in both W69 and W04 sequentially along the flow path (Fig. 3c). Final molar N: P ratios were significantly greater in 2018 than 2019 (F1,40=15.21, p < 0.001) and were marginally greater in unconnected wetlands (F1,40=3.56, p = 0.081) (Fig. 3d). Temporal patterns of litter nutrient content showed net immobilization of nitrogen (N) across all wetland types and mesh sizes with some difference between years. In 2019, litter in fine mesh of unconnected wetlands showed N mineralization in the first few months followed by immobilization resulting in differences between wetland types until the final sampling (Fig. 4a). Phosphorus (P) revealed more distinct patterns in both years. In 2018, coarse and fine mesh leaves accrued greater P in connected wetlands compared to unconnected, though this trend was largely driven by W69, the most upstream wetland. In 2019, only coarse mesh litter showed distinct differences with connected wetlands having a greater rate of P immobilization (Fig. 4b).
Macroinvertebrate Community
Many of the macroinvertebrates present in the wetlands were small enough to gain access to our fine mesh litter, including many Chironomidae and ostracods resulting in fine mesh having an overall greater total abundance than coarse mesh bags (F1,117=26.69, p < 0.001) (Fig. 5a). The interaction of sampling date and wetland type was significant (F5,117 = F = 6.24, p < 0.001). In 2018, the total abundance was marginally greater in unconnected wetlands within one day of filling, similar on day 7 and marginally less by the late colonization point. In 2019, connected wetlands had greater abundances on all sampling dates. This increased abundance was largely the result of ostracods and non-tanypodinae chironomids. When shredder abundance was compared, the interaction of sampling date and wetland type was only marginally significant (F5,117=113.59, p = 0.090) and no difference was seen between mesh sizes, indicating that our dominant shredders were able to gain access to fine mesh litter bags (Fig. 5b). No significant differences were seen between wetland types on differing sampling dates in 2018. In 2019, wetlands were similar until the late colonization point when connected wetlands had marginally greater shredder abundances (Fig. 5b).