De novo assembly and Illumina sequencing of P. vietnamensis transcriptomes
Transcriptome sequencing of P. vietnamensis, a total of 7,083,775,547 bases were generated and after a stringent quality check 23,741,783 paired-end, high quality, clean reads were obtained with 97.52% Q20 and 93.5% Q30 bases, while the GC contents were 51.43%. De novo assembly was further checked through Trinity and as a result, 153,074 transcripts with 117,954,630 bp were detected, while N50 value was1,268bp with an average length of 770.572 bp. Among total number of transcripts, 48,314 (31.56%) transcripts were between 200 and 300 bp; 35,174 (22.98%) transcripts ranged from 301 to 500 bp; 32,031 (20.93%) transcripts ranged from 501 to 1000 bp; 25,800 (16.85%) transcripts ranged from 1001 to 2000 bp and 11,755 (7.68%) transcripts were larger than 2000 bp. Meanwhile, the assembly produced 89,271 unigenes having a N50 length of 942 bp (average length = 598.319 bp) were assembled and retained for analyses. In these unigenes 39,947 (44.75%) were between 200 and 300 bp; 22,049 (24.70%) ranged from 301 to 500 bp; 13,669 (15.31%) ranged from 501 to 1000 bp; 9,048 (10.14%) ranged from 1001 to 2000 bp and 4,558 (5.11%) were larger than 2000 bp (Fig. 1, Table 1).
Functional annotation of assembled unigenes
For functional annotation analyses the unigenes were blasted against the seven databases (COG, GO, KEGG, KOG, Pfam, Swissprot and NR), a total 31,686 matched sequences was found (Table 2). Among the 89,271 unigenes, resulted successful annotation of 7,647 (8.57%) in the COG databases, 14,568 (16.32%) in the GO database, 5,838 (5.42%) in KEGG database, 16,860 (18.89%) in KOG database, 18,600 (20.845) in Pfam, 19, 228 (21.54%) in the Swiss-Prot protein database and 16,659 (18.66%) unigenes in the NR protein database (Table 2). For the species distribution BLASTx was used to search against Nr databases, the P. vietnamensis transcriptome shows highest similarities with Elaeis guineensis (25%) followed by Phoenix dactylifera (22%) and Musa acuminata (9%) (Fig. 2).
Based on Nr annotations, we used the GO system to categorize the possible functions of the unigenes. A total of 72,183 (80.86 %) unigenes was successfully grouped into three classes (biological process, molecular function and cellular component) and 51 subclasses (Fig. 3). The biological process was the top category (28,653; 39.69%), while subcategories were "metabolic process" (8,016; 27.98%) "cellular process" (7,528; 26.27%) and "response to stimulus" (2,347; 8.19%). The cellular component unigenes were 27,232 (37.72%), classified into "cell part" (6,645; 24.40%) "cell" (6,596; 24.22%) and "organelle" (5,269; 19,35%). The 16,298 (22.58%) unigenes were related to "molecular function" in which prominent subcategories are "binding" (7,459; 45.77%) and "catalytic activity" (7,130; 43.75%). It was also observed that the few genes are enriched in the terms of "nutrient reservoir activity", "molecular carrier activity", "protein tag" and "translation regulator activity".
A total of 7,647 unigenes were assigned to Clusters of Orthologous Groups (COG), to check the reliability of the transcriptome library and effectiveness of the annotation process, for functional prediction and classification (Fig. 4). COG-annotated putative proteins were functionally classified into 25 categories. The top groups were "general function prediction only" (9,089), "translation, ribosomal structure and biogenesis" (3,388) and "transcription" (977), respectively. However, only few unigenes were annotated as "extracellular structures" and "nuclear structure.”
The KEGG pathway analysis was used to explore the biological pathways in P. vietnamensis that might be active with an E value cutoff < 10-5. The 5,838 unigenes was significantly matched in the KEGG database and assigned to 118 KEGG functional pathways (Fig. 5). The specific pathways, including plant hormone signal transduction, purine metabolism, ribosome, RNA transport spliceosome and many more pathways. In addition, 45 unigenes were in the terpenoid backbone biosynthesis pathway.
EST-SSR markers development and characterization from the P. vietnamensis transcriptome
To develop new molecular markers and to check the assembly quality, the 89,271 unigenes were used for microsatellites mining that were well-defined as di- to hexa-nucleotide motifs. The SSRIT was used and identified 11,343 EST-SSRs. The 6,949 sequences contained one SSR, while 2,763 sequences have more than one SSR. The EST-SSRs frequency was 12.71%, and one EST-SSRs distribution density was 5.98 kilobases (kb) in the unigenes.
The potential EST-SSRs were analyzed for frequency, type, and distribution. The most common repeat motif was mono-nucleotide (5004; 44.12%), followed by di-nucleotide (4648; 40.98%), tri-nucleotide (1563; 13.78%), tetra-nucleotide (66; 0.58%), hexa-nucleotide (29; 0.26%), and penta-nucleotide (32; 0.28%) repeats (Fig. 6; Table 3). EST-SSRs with ten repeat motifs (2040; 20.50%), six repeat motifs (1363; 12.02%), five repeat motifs (925; 8.15%), seven repeat motifs (862; 7.6 %), eight repeat motifs (594; 5.24%), and nine repeat motifs (428; 3.77%) were the most common, respectively. The dominant motif in di-nucleotide repeats was AG/TC (90.06%), followed by AT/TA (5.34%) and AC/TG (4.43%). In type 10 of tri-nucleotide repeats, the highest motif distribution was CCG/GGC (22.65%), while the common motif in tetra-nucleotide repeats was ACTG/TGAC (19.30%) (Fig. 7). Additionally, 16 and 17 different types of penta and hexa-nucleotides repeats of EST-SSRs were detected, respectively.
Genetic structure and diversity of population
A total of 98 individuals from three P. vietnamensis populations produced 27 different alleles, ranging from 120 to 265 bp at the nine loci (Table 4). In the current study, the polymorphism information content (PIC) value ranged from 0.325 (L111) to 0.493 (L145), with an average of 0.361. The number of detected alleles per locus (A) in overall 98 individuals ranged from two at two loci (L119 and L145) to four at two loci (L37 and L111) with an average value of three. The lowest detected heterozygosity (HO) was found at locus L73 (0.178) and the highest at locus L111, with an average of 0.422. Similarly, the lowest expected heterozygosity (HE) was recorded for locus L73 (0.208) and the highest for locus L37 (0.65), with an average of 0.479. The value of fixation index (F) in overall population for each locus, average 0.14, ranging from -0.185 (L111) to 0.386 (L115).
At population level, the values of genetic diversity are shown in Table 5, including the alleles mean number (A = 2.6), the effective alleles numbers (AE = 2.2), the proportion of polymorphic loci (92.59%), the observed heterozygosity (HO = 0.422) and expected heterozygosity (HE = 0.479). The fixation index (F) was positive for all the populations (F = 0.13). Therefore, these results showed heterozygosity deficiency and significant inbreeding (p < 0.05). Seven loci of the nine loci had positive fixation and indicating high homozygosity and inbreeding. However, among the loci, five loci had significant inbreeding (p < 0.05). Two loci had negative values.
During the Bottleneck analysis using Stepwise mutation model (SMM) and two phase model (TPM) models (p < 0.01) shows that targeted population is significantly heterozygote deficient (Table 5). This suggests sign of the bottleneck in all population.
The analysis of molecular variance (AMOVA) showed that total variation was highly significant (p < 0.001) within individuals i.e. 63.17% (Table 6). The FST were significant (p < 0.05), values range was from 0.072 to 0.182 (average = 0.133) and with 1.63 gene flow. Low genetic differentiation value (FST = 0.072) was found between DT and TN population, while high value (FST = 0.182) was between DT and KT population (Table 7).
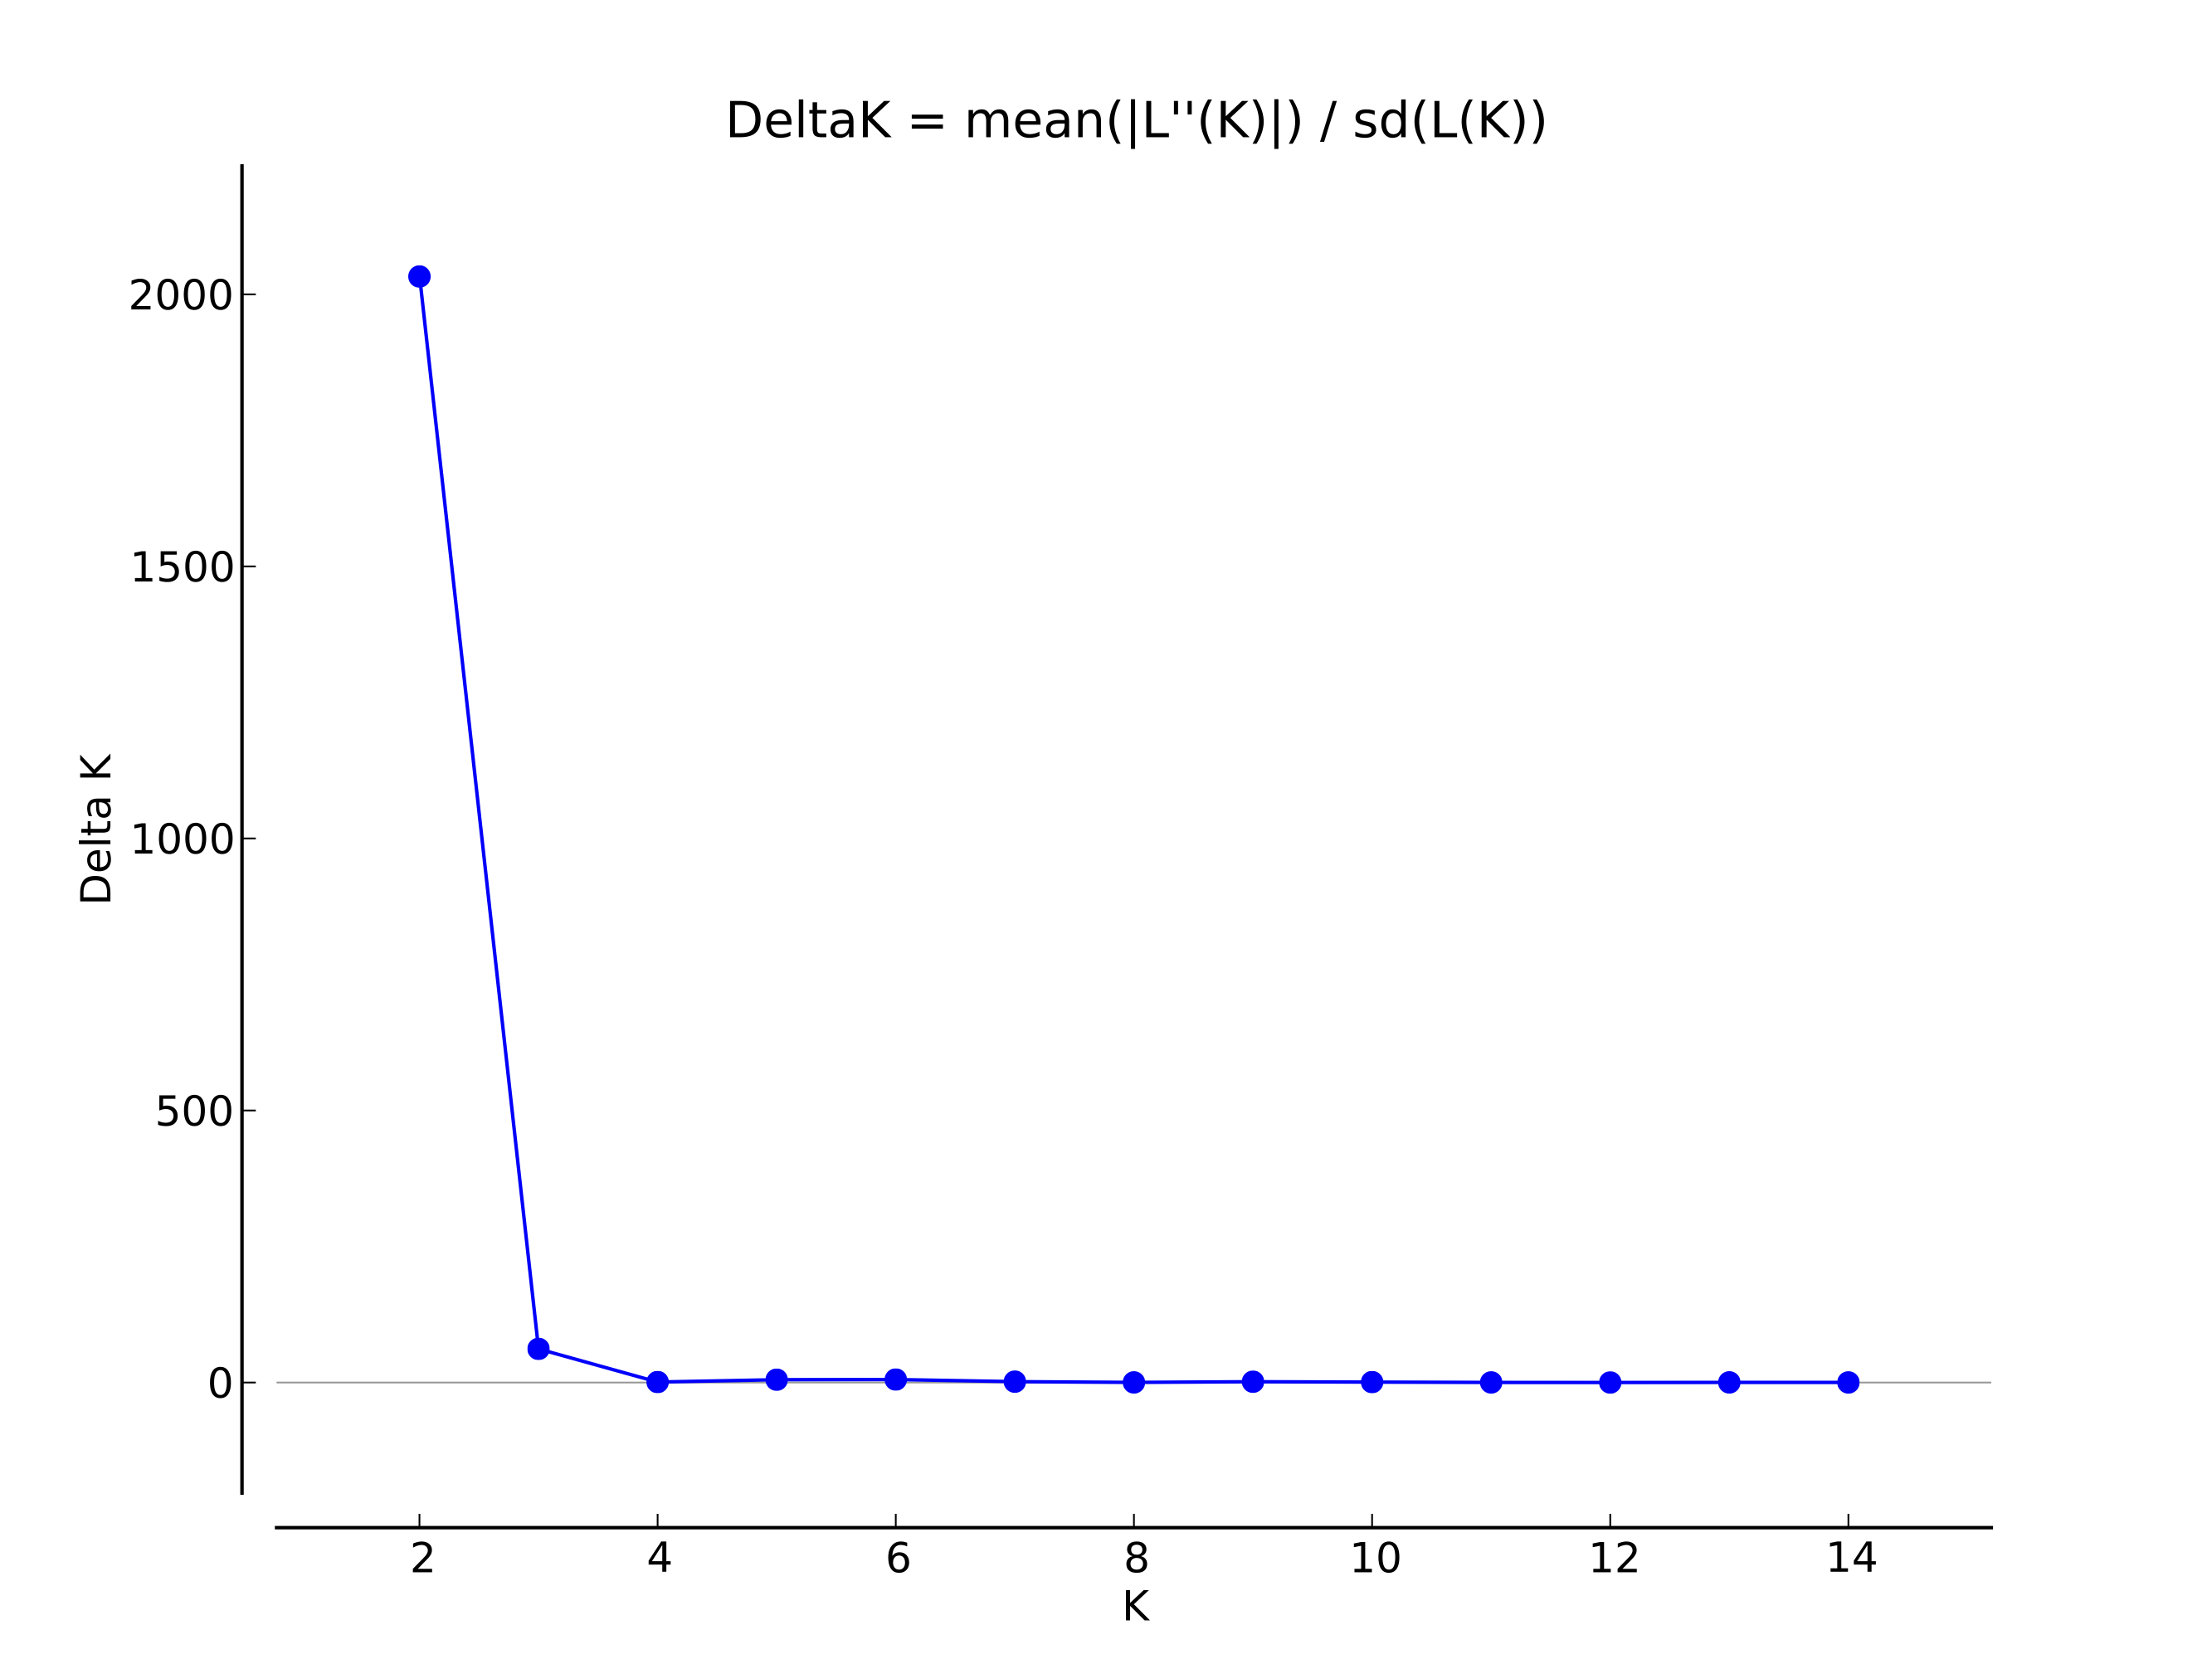
The genetic relationship of P. vietnamensis populations are expressed in figure 8. The DT and TN populations were grouped together and firmed one cluster with the bootstrap value of 100%. In the STRUCTURE analysis, the highest ∆K value (2032.81) (Fig. S1) for 98 individuals revealed K = 2 to be the optimum number of genetic clusters and indicated that all the studied plants exhibited admixture from two clusters. The percentage of ancestry of each population and individuals in two genetic groups shows that one group (red) was predominant in two populations (DT and TN) and second group (green) was predominant in one population i.e. KT (Fig. 9).