Chemical composition of the Orange Essential Oil
OEO was analyzed using GC-SQ-MS, the results show the main constituents of OEO are d-limonene (64.33%), β-myrcene (8.84%), α-pinene (5.01%), α-phellandrene (2.82%), linalool (2.77%), decanal (1.89%), and octanal (1.28%) in 18.83, 17.29, 15.27, 16.72, 20.94, 24.2, and 17.68 (min), respectively, Table 1 and Fig. S1. These 7 compounds account for 86,94% of the total compounds identified. Limonene was also observed as the main component in the peel of sweet orange in several previous reports (Golmohammadi et al. 2018; Liu et al. 2019; Yang et al. 2017). Among 36 volatile organic compounds detected, including monoterpenes, sesquiterpenes, aldehydes, alcohols, and esters, D-limonene is the major contributor to the orange aroma.
Table 1
GC-SQ-MS analyzed chemical compounds of orange essential oil (OEO)
| No. | Retention Time (min) | Compounds | Composition (%) |
| 1 | 15.27 | α-Pinene | 5.01 |
| 2 | 16.72 | α-Phellandrene | 2.82 |
| 3 | 17.29 | β -Myrcene | 8.84 |
| 4 | 17.68 | Octanal | 1.28 |
| 5 | 18.83 | D-Limonene | 64.33 |
| 6 | 20.69 | 2-Carene | 0.57 |
| 7 | 20.94 | Linalool | 2.77 |
| 8 | 21.45 | p-Cymene | 0.13 |
| 9 | 21.7 | 2-Caren-4-ol | 0.34 |
| 10 | 22.14 | cis-p-Mentha-2,8-dien-1-ol | 0.93 |
| 11 | 22.27 | (+)-(E)-Limonene oxide | 0.42 |
| 12 | 22.61 | Citronellal | 0.37 |
| 13 | 23.26 | 1-Indanone, 4,5,6,7-tetrahydro | 0.28 |
| 14 | 23.92 | α-Terpineol | 0.71 |
| 15 | 24.2 | Decanal | 1.89 |
| 16 | 24.73 | 2-Cyclohexen-1-ol, 2-methyl-5 | 0.63 |
| 17 | 25.08 | Carveol | 0.32 |
| 18 | 25.32 | Neral | 0.32 |
| 19 | 25.52 | (-)-Carvone | 0.74 |
| 20 | 26.14 | Citral | 0.76 |
| 21 | 26.45 | 2-Caren-10-al | 0.31 |
| 22 | 28.15 | Limonene oxide, trans- | 0.16 |
| 23 | 29.37 | Copaene | 0.41 |
| 24 | 29.71 | γ-Muurolene | 0.46 |
| 25 | 29.88 | Dodecanal | 0.39 |
| 26 | 30.63 | Caryophyllene | 0.31 |
| 27 | 30.83 | Copaene | 0.43 |
| 28 | 32.47 | Caryophyllene | 0.82 |
| 29 | 32.71 | Butylated Hydroxytoluene | 0.86 |
| 30 | 33.1 | Cadina-1(10),4-diene | 0.42 |
| 31 | 33.72 | α-Acorenol | 0.18 |
| 32 | 37.04 | α-Longipinene | 0.39 |
| 33 | 38.24 | α-Sinensal | 0.22 |
| 34 | 39.76 | Nootkatone | 0.15 |
| 35 | 42.35 | m-Camphorene | 0.16 |
| 36 | 43.05 | 1-Heptatriacotanol | 0.1 |
| Total | | | 99.23 |
Morphology study of nanofiber membranes
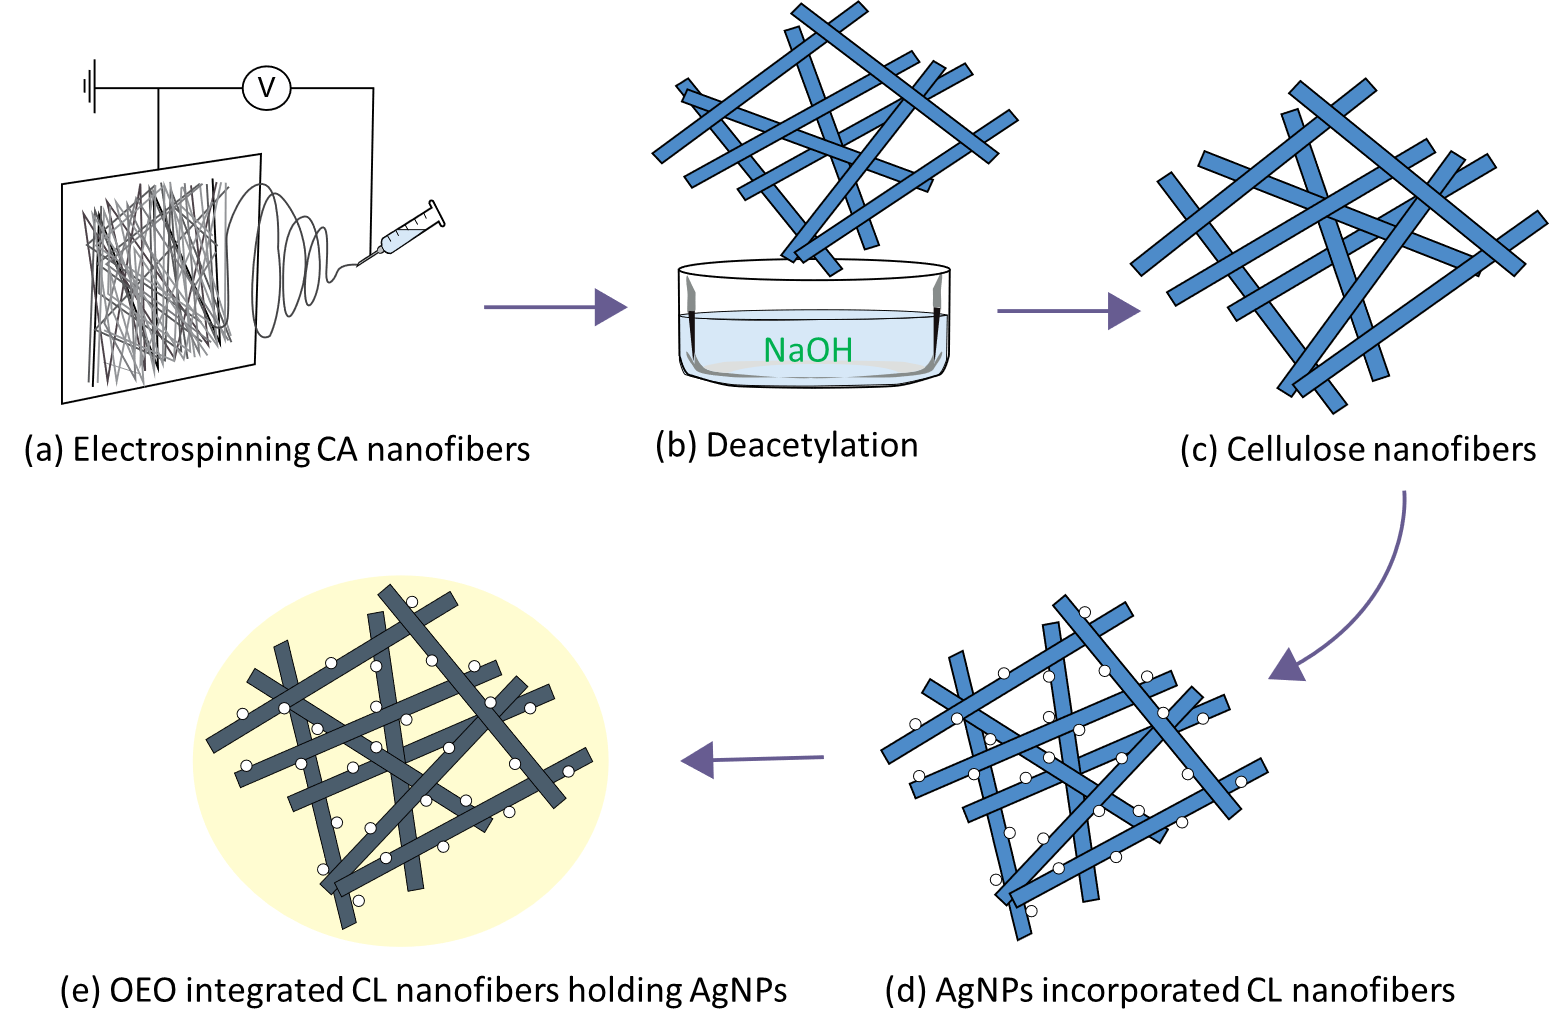
In Fig. 1 (a), CA nanofibers is observed to be diverse in size, the average diameter value with deviation is 409 ± 157 nm. With the concentration of 15 wt% CA in bi-solvent system of acetone and DMF, the polymer chains entangle enough with each other to form a smooth and bead-free nanofibers. After treatment with NaOH, CL nanofibers present similar morphology with slightly larger in diameter, 469 ± 143 nm, due to the mercerization effects. Similarly, OEO-CL nanofibers did not present any significant difference compared to CL nanofibers, the presence of OEO could not detected due to the evaporation of essential oil in vacuum chamber of SEM equipment. In Fig. 1 (d), (e), and (f), the silver nanoparticles could also be spotted attached to CL nanofibers. The average diameters of these nanofibers increased to 480 ± 109, 476 ± 128, and 482 ± 85 nm due to the AgNPs physically attached to the nanofibrous network structure. The morphology of Ag-OEO5%-CL and Ag-OEO10%-CL present alike morphology compared to Ag-CL sample because OEO was completely removed in vacuum environment of the microscope chamber.
FT-IR spectral analysis
Figure 2 presents the FTIR spectra of pristine CA and CL nanofibers, and composite CL nanofibers after various steps of treatment. For CA spectrum, the strong absorbance peaks at 1735 cm− 1, 1365 cm− 1, and 1225 cm− 1 correspond to C = O vibration, C-CH3 vibration, and C-O-C stretching vibration, respectively. After the deacetylation reaction, the complete disappearance of the peaks at 1735 cm− 1 and 1225 cm− 1 and the raising band at 3400 cm− 1 prove the successful conversion of CA to CL. The addition of OEO give raise to the peaks at 2920 and 2860 assigned to -C-H stretch, and 1735 cm− 1 attributed to carbonyl stretch of alkanes, Fig. 2 (A) (Cebi et al. 2021). The peak at 872 of AgNO3-CL spectrum was assigned to -NO3 bending, which can be referred to the penetration of silver nitrate into the cellulosic polymer matrix. This peak was removed after the redox reaction between AgNO3 and NaBH4, Fig. 2 (B), attesting to the conversion from silver salt to silver nanoparticles.
X-ray diffraction study
The XRD patterns of CA and CL nanofibers, and AgNPs were identified using XRD technique. CA nanofibers exhibits two typical diffraction bands centered at 2θ of 9° and 22.5°, which correspond to the semi-crystallinity of cellulose acetate polymer, Fig. 3 (A)-(a). The deacetylation process transformed CA to CL nanofibers completely, which show typical bands of cellulose II. With the addition of OEO into the CL nanofibers, no characteristic bands or peaks could be detected. The presence of AgNPs attached to CL nanofibers can be confirmed by diffraction peaks at 2θ values of 38°, 44.5°, 64.5°, and 77.5° indexed to (111), (200), (220), and (311) crystal planes of the standard metal silver pattern. The reduction of silver ions to silver nanoparticulate formation from the nucleation thus are successfully conducted. In Fig. 3 (B), The TEM image of Ag-CL illustrated the adhesion of AgNPs on to the surface of CL nanofibers. In contrast, neat CL nanofibers present a particle-free morphology. The coating of Ag-CL nanofibers with OEO did not affect the X-ray diffraction, Fig. 3. (A)- (e) and (f).
EDS analyses
The elemental analysis was carried out by EDS study, Fig. 4. The characteristic results verified that CA and CL nanofibers are composed majorly of carbon and oxygen. For the Ag-CL nanofibers, beside the presence of carbon and oxygen, the detection of silver demonstrated the loading of silver in the samples. Moreover, the nitrogen was not detected in Ag-CL, which verified the complete conversion of AgNO3 to AgNPs during the reducing reaction. The elemetal composition was obtained in Table 2, CA and CL nanofibers are comprised of carbon, oxygen, and hydrogen elements. In the case of Ag-CL the silver element was 3.64%, clarifying the success of AgNPs synthesis.
Table 2
Elemental composition of CA, CL, and Ag-CL nanofibers using EDS analysis
| Sample | Element (at.%) |
| Carbon | Nitrogen | Oxygen | Ag |
| CA | 54.67 | - | 41.90 | - |
| CL | 52.44 | - | 47.56 | - |
| Ag-CL | 44.09 | - | 52.28 | 3.64 |
Mechanical properties
Table 3 and Fig. 5 show the mechanical properties of CA, CL, OEO-CL, Ag-CL, Ag-OEO5%-CL, and Ag-OEO10%-CL. The deacetylation process and mercerization effect increased the strength at break and Young’s modulus of as-spun nanofibers from 3.32 ± 0.84 MPa and 144.31 ± 37.74 MPa to 8.51 ± 1.93 MPa and 315.51 ± 45.81 MPa, which are the values of CL nanofibers, respectively. The effect was due to the -OH groups of CL nanofibers, which form hydrogen bonding between inner polymer chains and possibly bind different nanofibers together. The bonding formation led to the void space reduction and tightly packed effect, increasing crystallinity and making the nanofibrous mats stronger and tougher (Maroufi et al. 2021). The incorporation of OEO to CL nanofibers decreases the tensile strength but increases the elongation at break of nanofibrous samples, possibly the integration of essential oil loosens the intermolecular interactions between the polymer chains. Besides, it could also be explained as the coating effect of OEO freed the linking nodes between different nanofiber strands and helped them move more easily in the tensile tests. However, after treating CL nanofibers with AgNO3 and NaBH4, the Ag-CL nanofibers present poorer mechanical strength and elongation at break. The adverse observation demonstrated the negative effect of AgNPs formation on the interconnective fiber network and the mobility.
Table 3
Tensile strength, elongation at break, and Young’s modulus of CA, CL, OEO-CL, Ag-CL, Ag-OEO5%-CL, and Ag-OEO10%-CL nanofibers
| Sample | Tensile strength (MPa) | Elongation at break (%) | Young’s modulus (MPa) |
| CA | 3.32 ± 0.84 | 17.33 ± 5.79 | 144.31 ± 37.74 |
| CL | 8.51 ± 1.93 | 3.85 ± 0.98 | 315.51 ± 45.81 |
| OEO-CL | 7.83 ± 3.08 | 5.23 ± 2.38 | 254.95 ± 50.16 |
| Ag-CL | 6.32 ± 2.81 | 3.63 ± 1.25 | 220.27 ± 66.08 |
| Ag-OEO5%-CL | 5.91 ± 0.93 | 4.5 ± 1.91 | 215.94 ± 30.15 |
| Ag-OEO10%-CL | 5.6 ± 1.03 | 4.96 ± 1.65 | 204.9 ± 40.48 |
Water absorption and silver release profile
Water absorption was evaluated to quantify the water amount can be absorbed into CA nanofibers, and CL nanofibers before and after the incorporation of silver and OEO, Fig. 6. (A). The water holding capacity of CL nanofibers after deacetylation process improved significantly and reached to 1126% compared to CA nanofibers just 124%. For composite nanofibers, the quantification of water absorption gives insight into the influence of AgNPs and OEO to the hydrophilicity of treated CL nanofibers. The percentage of weight gain of CL nanofibers and Ag-CL nanofibers show slight difference which means the adhesion of AgNPs did not change significantly the hydrophilic properties of the CL nanofibers, AgNPs were considered hydrophobic but the low percentage of silver content proved to be insufficient to change the absorption properties of CL nanofibers. By contrast, OEO addition reduced the water absorption of the CL nanofibers from 1126–923% for OEO-CL, and from 1133–847% and 776% of Ag-CL, Ag-OEO5%-CL and Ag-OEO10%-CL, respectively. These findings were in line with other publications (Sharma et al. 2021; Ullah et al. 2021).
The mechanisms of AgNPs toxicity are well related to Ag+ ion release from the polymer matrix into the cell, and controlling the release of silver over time is desirable in wound dressing and other medical applications. Long-term silver release can lead to long-lasting antibacterial activity. The silver release has been reported to correlate to silver content, AgNPs size, water chemistry, and the surface coating of AgNPs. In Fig. 6. (B), AgNPs dissolution was studied over a time course of 48 h. Ag-CL present a speedy release at first and followed by a gradual release curve. The silver discharge of Ag-OEO5%-CL is slower at first 6 h compared to Ag-CL and followed by a stable increase, whereas, the discharge profile of Ag-OEO10%-CL shows first-order linear. It is surmised that the phenomenon was ascribable to surface passivation happened in the case of Ag-OEO5%-CL and Ag-OEO10%-CL due to the OEO coating effects. The rapid discharge of Ag at the 6 h time point of Ag-CL were in accordance with other already published articles, which could be explained as the discharge of chemisorbed Ag+ and the oxidative process with O2 (Dobias and Bernier-Latmani 2013). The coating effects of OEO cause the slow and sustained release of Ag from the composite nanofibers.
Antibacterial activity of composite CL nanofibers
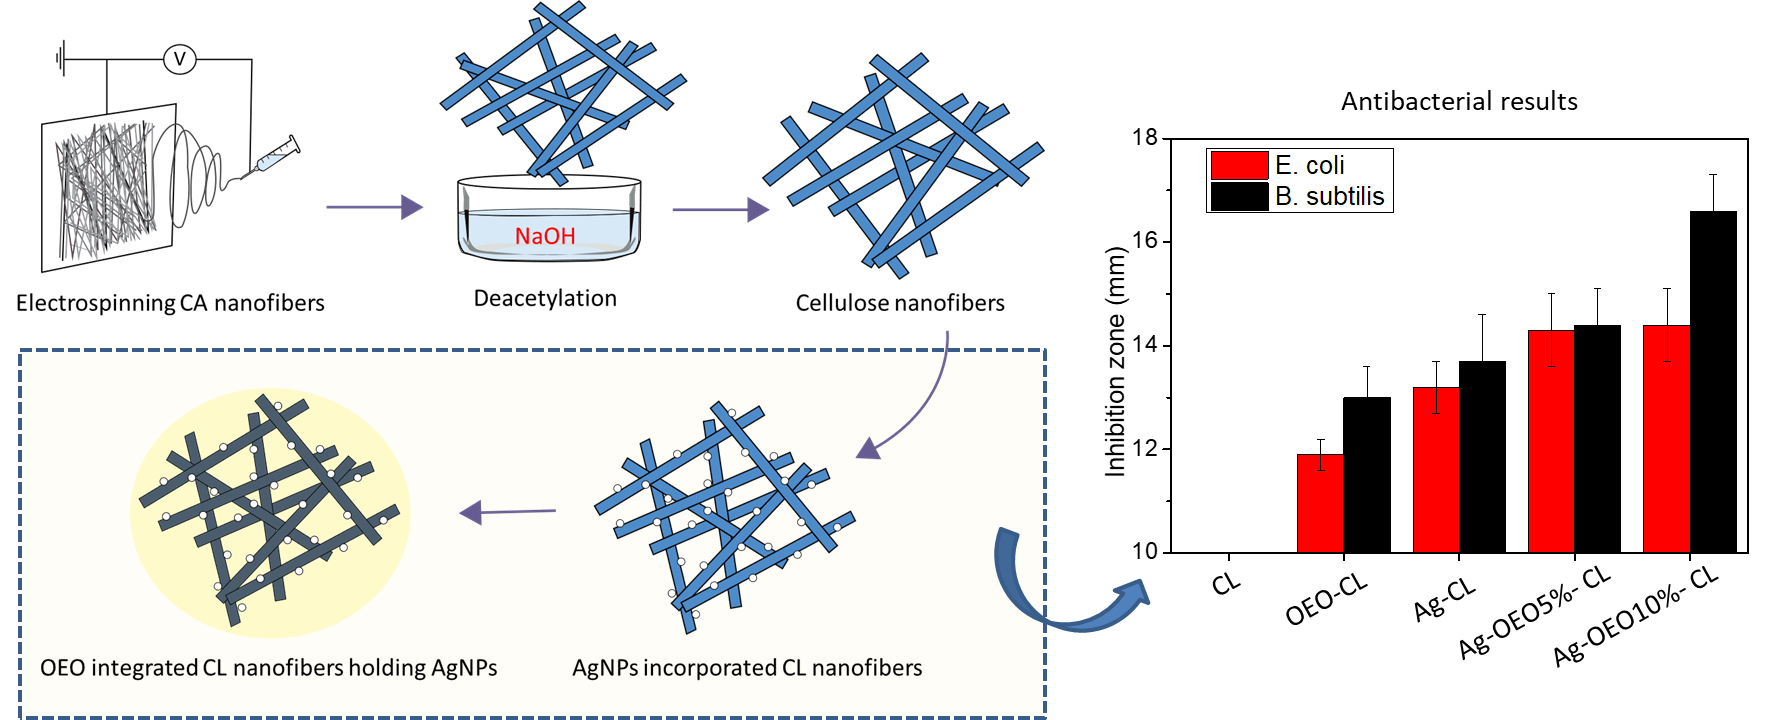
The antibacterial effects of CL, OEO-CL, Ag-CL, Ag-OEO5%-CL, and Ag-OEO10%-CL were evaluated against common microorganisms, E. coli and B. subtilis. The photos of the inhibition zones were taken after incubation time and measured using ImagesJ software. Figure 7 and Fig. S2 show the diameters of the halo area, generated by the disruption of bacterial growth around the nanofibrous specimens. The CL nanofiber sample or negative control sample presents no antibacterial activities. For all other samples containing AgNPs or OEO, the inhibitions zones were clear and visible, demonstrating the antimicrobial properties against both gram-positive and gram-negative bacteria. In the case of B. subtilis, the zone diameters were 13 ± 0.6, 13.7 ± 0.9, 14.4 ± 0.7, and 16.6 ± 0.7 mm for OEO-CL, Ag-CL, Ag-OEO5%-CL, and Ag-OEO10%-CL. The combination effects of OEO and AgNPs resulted in improved antibacterial action against B. subtilis, the sizes of the halo zones were significantly extended from 13.7 ± 0.9 to 16.6 ± 0.7 for Ag-CL and Ag-OEO10%-CL, respectively. However, OEO is not so potent against E. coli - gram negative bacteria when combining with AgNPs, with double OEO content in CL composite nanofibers, the diameters of the halo zones increased from just 14.3 ± 0.7 to 14.4 ± 0.7 for Ag-OEO5%-CL and Ag-OEO10%-CL, respectively. The consistent results were also reported in previous publication because of the bactericidal effects of OEO on diversities of bacterial cell structures, and OEO is less potent against gram-negative bacterial strains (Farahmandfar et al. 2020). OEO coating suppresses the silver release, thus the higher the OEO concentrations but the low silver discharge will not effectively extend the sizes of the bacterial inhibition zones against gram-negative bacteria.