HKG expression proportion is lower in the neocortex than that in the archicortex and subcortex. We constructed gene expression networks for all brain samples by combining human gene expression from the Allen Institute for Brain Science (http://human.brain-map.org/) and large-scale protein interaction data (see the Methods section). The gene expression data were obtained from six adult brains (two contributed both hemispheres, and four contributed one hemisphere), for a total of 3,702 brain samples22. Considering the diversity among the different subjects, we analyzed and compared the gene expression networks between samples within a given human brain. Based on the gene expression networks, we extracted the percentages of HKGs and specific genes, which were expressed in almost all samples23 and expressed in only one or two samples, respectively24.
The percentages of HKGs are mapped to the samples of Brain #1 (Fig. 1a). The samples with relatively low percentages of HKGs were primarily located in the neocortex of the human brain. Compared to the archicortex and subcortex, the neocortex in the human brain performs diverse and complex functions, and thus likely requires more expressed genes in addition to HKGs. Similar results were obtained in the other five human brains (Supplementary Fig. 1 and Supplementary Table 1). As shown in Fig. 1b, the HKG percentages in the neocortex in Brain #1 were significantly lower than those in the archicortex and subcortex (Both P-values<0.001 in two sample t-test). Not surprisingly, the genes expressed in the necortex tend to have lower gene expression levels and higher expression specificity than those in the archicortex and subcortex (Supplementary Table 1).
The HKG percentages were mapped to the main structures in Brain #1 (Fig. 1c). Interestingly, the cerebellum exhibited a relatively lower mean HKG percentage than the cerebral nuclei, interbrain, and brainstem. However, after dividing the cerebellum into interior structures, significant differences were observed in the HKG percentages between the cerebellar cortex and cerebellar deep nuclei. The cerebellar cortex, including the lateral hemisphere (33.60±1.58%) and paravermis (33.61±1.76%), exhibited a lower HKG percentage than the cerebellar deep nuclei (39.70±4.74%). Thus, significant expression difference may exist between the different structures of the cerebellum, coinciding with their functions. According to previous studies, the cerebellum in humans not only plays an important role in motor control, which is mainly executed by the cerebellar deep nuclei, but also is involved in certain higher-order cognitive functions, such as attention and language, which are executed by the cerebellar cortex25, 26.
To investigate the relationship of the HKG percentage and evolution, we analyzed the evolutionary rate of expressed genes (see the Methods section) to measure the selective constraints to which the brain regions were subjected. As shown in Fig. 1d, the HKG percentages in the samples of Brain #1 were found to decrease as the average evolutionary rates of the expression genes increase. Similar results can be observed in the other five brains. These results imply that the brain regions with lower HKG percentages show higher average evolutionary rate under less evolutionary pressure, compared the other regions.
Newly developed brain regions exhibit increased heterogeneity in their internal expression networks. To analyze the gene expression heterogeneity from a network perspective, we computed three typical topological indexes of gene expression networks, including the mean path length, clustering coefficient and eigen entropy, to measure the overall navigability, modularity, and orderness of the networks (see the Methods section and Supplementary Table 2). In general, a longer mean path length, smaller clustering coefficient and larger eigen entropy of a network may suggest that it is sparser, containing less clusters and more disorderly, and thus shows greater heterogeneity of gene expression.
The gene expression networks in the neocortex exhibited greater heterogeneity, with longer mean path lengths, smaller clustering coefficients and larger eigen entropies, than those in the archicortex and subcortex (Fig. 2ab). Meanwhile, significant correlations were observed among the three topological indexes and average evolutionary rate of genes. We found that the mean path lengths in the brain samples increase as the average evolutionary rates of genes increase, as shown in Fig. 2c. Our results revealed that the orderness of the gene expression networks in the brain regions presented a downward trend according to the evolution order of the brain regions, consistent with the evolution theory of life systems that the development of organisms and a highly complex brain is a process of diminishing entropy27, 28. The results obtained from the six brains were consistent.
Brain regions with greater expression heterogeneity were primarily located in multimodal association cortex of the human brain. To investigating the heterogeneity of internal structures in the neocortex, we integrated the gene expression data of brain samples from six adult individuals through the standard process described in previous studies29 (see Supplementary Methods for details) and mapped them to seven networks of cerebral cortex30. According to the gene expression heterogeneity, seven brain networks showed orderly topography from multimodal association cortex to unimodal primary cortex. The multimodal association cortex including frontoparietal control, attention, and default networks showed lower gene expression similarity within networks than the visual, motor, and limbic networks (Fig. 3a, see the Methods section), while the higher-order cognitive functional networks consistently exhibited more differences in gene expression compared with the visual and motor networks (Fig. 3b). Meanwhile, the gene expression similarity within networks was found positively correlated with the corresponding standard error of gene expression levels (R=0.87, P=0.01). The multimodal association cortex possessed lower standard error of gene expression levels compared with the unimodal primary cortex, implying its gene expression is more unbalanced, as shown in Fig. 3c. These results indicated that the multimodal association cortex exhibited greater expression heterogeneity, not only in the lower expression similarity within networks, but also the greater dispersion degree of gene expression levels.
Brain regions with greater expression heterogeneity tend to be connected to more regions in the functional connectivity networks. To explore whether genes with highly consistent cortical patterns across individuals drive this functional organization, we compared the gene expression with resting-state functional connectivity MRI data from the Human Connectome Project31,32. We generated a region-level functional connectivity matrix C averaged across 50 subjects using linear correlations of 116 regions from the automated anatomical labeling (AAL) atlas33 (see the Methods section). Then, we computed the topological properties of the functional connectivity networks in the human brain, including the degree and betweenness coefficient of each brain region.
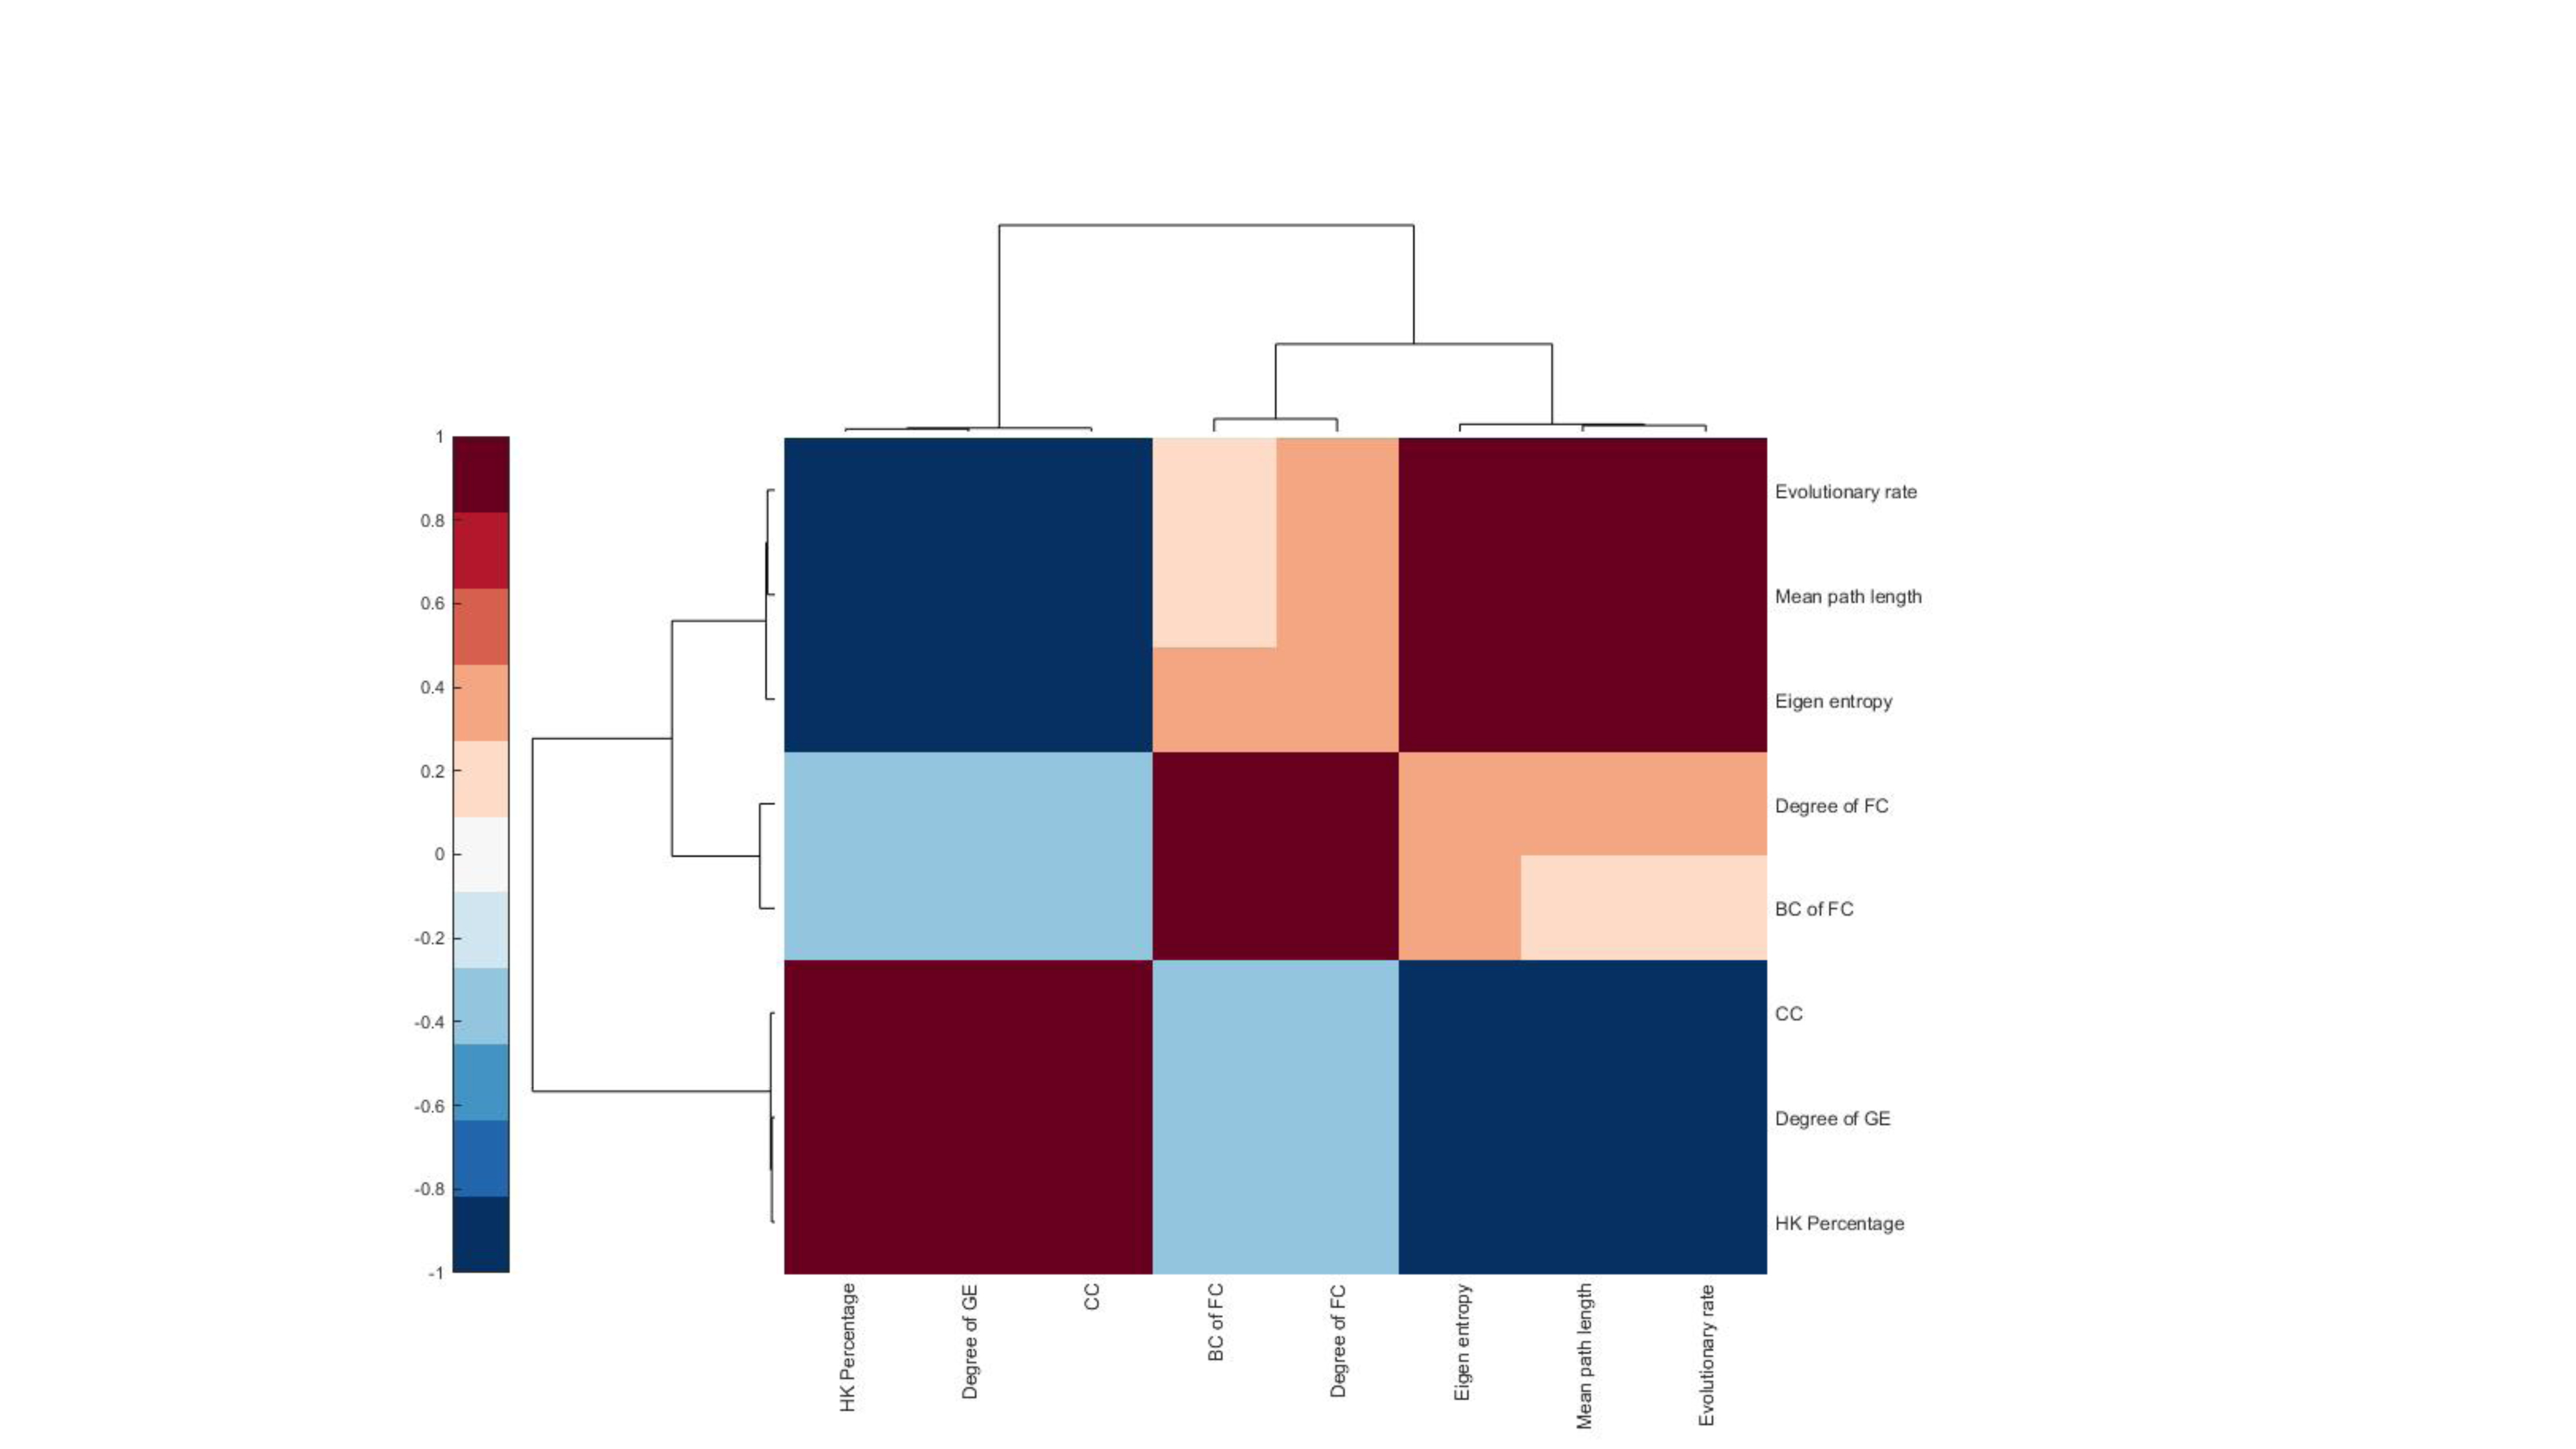
We compared the properties of the gene expression networks with those of the functional connectivity networks in the human brain. The degree of brain regions in the functional connectivity networks was negatively correlated with the HKG percentage (R=-0.39, -0.25, -0.31, -0.20, -0.20, and -0.33 for Brains #1-6, respectively, all with P<0.01) and positively correlated with the mean path length of gene expression network (R=0.35, 0.31, 0.37, 0.16, 0.25, and 0.32 for Brains #1-6, respectively, P<0.01). Thus, brain regions connected to more regions in the functional connectivity networks are primarily located in the neocortex of the human brain and tend to exhibit greater expression heterogeneity, with lower proportions of HKGs and longer mean path lengths in their expression networks (Fig. 4 and Supplementary Fig. 2). These results suggested that the brain regions with greater expression heterogeneity tend to be closely related to each other, in order to perform more interdependent functions.
The gene expression patterns in the mouse and rhesus macaque brain are similar to that in the human brain. Subsequently, based on the expression data from Allen Institute mouse brain atlas from a 56-day-old male C57BL/6J mouse brain34 and protein interactions in the mouse brain, we established gene expression networks in 73 structures of the adult mouse brain (see the Method, Supplementary Table 3). Mouse brain regions with lower HKG proportions tended to be newly developed, as shown in Fig. 5a. Focused on the isocortex of the mouse brain, the ‘Perirhinal area’ exhibited the lowest percentage of HKGs, followed by the ‘Prelimbic area’, with values of 29.17% and 30.76% (Supplementary Fig. 3), consistent with those of previous evolutionary analyses across species35. Especially, mouse cerebellum owns the highest HKG proportion (44.90%), suggesting that there may be significant evolutionary differences in the cerebellum between humans and mice36. We found the mean path length and eigen entropy of the gene expression networks in the isocortex (4.09±0.09 and 5.13±0.10, respectively) were significantly higher than those in the cerebral nuclei (3.83±0.10 and 4.96±0.05, respectively), indicating the brain structures that evolved later exhibit greater heterogeneity than those that evolved earlier. Based on resting-state functional MRI data of forty-eight male C57BL/6J mice37, 38, we established the functional connectivity networks of the mouse brains (see the Methods section) and found the negative correlation between the HKG percentage in gene expression and region degree in functional connectivity networks (R=-0.53, P=0.01, Fig. 5b), confirmed the results obtained from the human brains.
Furthermore, we generated the expression networks by integrating the gene expression data of the adult rhesus macaque specimen from the NIH Blueprint Non-Human Primate Atlas40 with interaction data from STRING database, and the functional connectivity networks based on monkey functional MRI data (see Method and Supplementary Table 4). We found the gene expression networks in neocortex tend to own greater heterogeneity, with lower HKG percentage, longer mean path length and higher functional degree, than those in archicortex and subcortex (Fig. 5cd), in line with the results obtained from human brain.