Table 1. Prognostic factors for overall survival identified by univariate and multivariate analyses (N = 139)
|
|
|
|
|
Univariate
|
Multivariate
|
|
Variables
|
n (%)
|
3-year survival
|
5-year survival
|
P-value
|
HR
|
95% CI
|
P-value
|
|
Male sex
|
110 (79%)
|
65.4%
|
56.7%
|
0.258
|
|
|
|
|
Female sex
|
29 (21%)
|
88.5%
|
68.5%
|
|
|
|
|
|
Age (years) ≤ 80
|
109 (78%)
|
74.1%
|
66.8%
|
0.002
|
1.979
|
1.050-3.732
|
0.035
|
|
> 80
|
30 (22%)
|
54.1%
|
33.7%
|
|
|
|
|
|
BMI (kg/m2) > 25
|
34 (25%)
|
74.4%
|
63.0%
|
0.441
|
|
|
|
|
≤ 25
|
105 (75%)
|
68.7%
|
58.1%
|
|
|
|
|
|
ALBI grade III
|
30 (22%)
|
64.2%
|
55.0%
|
0.677
|
|
|
|
|
< grade III
|
109 (78%)
|
71.4%
|
59.6%
|
|
|
|
|
|
HBV (+)
|
27 (19%)
|
78.3%
|
78.3%
|
0.027
|
1.681
|
1.037-2.726
|
0.035
|
|
(-)
|
112 (81%)
|
67.9%
|
52.7%
|
|
|
|
|
|
HCV (+)
|
70 (50%)
|
71.5%
|
59.4%
|
0.668
|
|
|
|
|
(-)
|
69 (50%)
|
68.0%
|
58.8%
|
|
|
|
|
|
DM (+)
|
29 (21%)
|
75.3%
|
58.6%
|
0.582
|
|
|
|
|
(-)
|
110 (79%)
|
68.6%
|
58.6%
|
|
|
|
|
|
NLR ≥ 4
|
13 (9%)
|
52.6%
|
52.6%
|
0.257
|
|
|
|
|
< 4
|
126 (91%)
|
71.3%
|
60.0%
|
|
|
|
|
|
PLT (×104/μL): normal (13- 35)
|
97 (70%)
|
73.4%
|
60.7%
|
0.582
|
|
|
|
|
:abnormal
|
42 (30%)
|
63.1%
|
55.4%
|
|
|
|
|
|
Hb (g/dL): normal (13.5-15.8)
|
95 (68%)
|
74.2%
|
63.7%
|
0.094
|
|
|
|
|
:abnormal
|
44 (32%)
|
61.2%
|
50.1%
|
|
|
|
|
|
PT (%): normal (70-130)
|
125 (90%)
|
72.3%
|
60.4%
|
0.172
|
|
|
|
|
:abnormal
|
14 (10%)
|
46.2%
|
46.2%
|
|
|
|
|
|
AST (U/L): normal (13-33)
|
71 (51%)
|
78.6%
|
59.9%
|
0.086
|
|
|
|
|
:abnormal
|
68 (49%)
|
61.1%
|
56.5%
|
|
|
|
|
|
ALT (U/L): normal (8-42)
|
100 (72%)
|
73.2%
|
59.7%
|
0.298
|
|
|
|
|
:abnormal
|
39 (28%)
|
61.8%
|
57.0%
|
|
|
|
|
|
CHE (g/dL): normal (229-521)
|
77 (55%)
|
74.6%
|
64.0%
|
0.110
|
|
|
|
|
:abnormal
|
62 (45%)
|
63.6%
|
52.6%
|
|
|
|
|
|
Alb (g/dL): normal (4.0-5.0)
|
115 (83%)
|
72.2%
|
60.3%
|
0.165
|
|
|
|
|
:abnormal
|
24 (17%)
|
58.4%
|
51.9%
|
|
|
|
|
|
T-chol (mg/dL): normal (128-219)
|
118 (85%)
|
71.7%
|
59.1%
|
0.732
|
|
|
|
|
:abnormal
|
20 (14%)
|
66.9%
|
66.9%
|
|
|
|
|
|
PIVKA-II (mAU/mL): normal (< 40)
|
62 (45%)
|
81.0%
|
74.7%
|
0.009
|
1.852
|
0.940-3.649
|
0.075
|
|
:abnormal
|
77 (55%)
|
60.8%
|
45.7%
|
|
|
|
|
|
AFP (ng/mL): normal (> 10)
|
68 (49%)
|
73.8%
|
66.9%
|
0.126
|
|
|
|
|
:abnormal
|
68 (49%)
|
66.2%
|
51.4%
|
|
|
|
|
|
Tumor number: solitary
|
113 (81%)
|
70.6%
|
65.5%
|
0.167
|
|
|
|
|
: multiple
|
26 (19%)
|
67.9%
|
37.0%
|
|
|
|
|
|
Tumor size 3 cm <
|
71 (51%)
|
68.0%
|
59.5%
|
0.185
|
|
|
|
|
≤ 3 cm
|
54 (39%)
|
78.5%
|
71.5%
|
|
|
|
|
|
Poor differentiation
|
20 (14%)
|
73.7%
|
48.4%
|
0.545
|
|
|
|
|
Others (well, moderately)
|
119 (86%)
|
69.2%
|
61.1%
|
|
|
|
|
|
IM (+)
|
19 (14%)
|
34.1%
|
22.7%
|
< 0.001
|
3.675
|
1.848-7.308
|
< 0.001
|
|
(-)
|
120 (86%)
|
77.1%
|
66.0%
|
|
|
|
|
|
Vp (+)
|
26 (19%)
|
49.6%
|
42.5%
|
0.009
|
1.700
|
0.940-3.649
|
0.130
|
|
(-)
|
113 (81%)
|
74.6%
|
62.8%
|
|
|
|
|
|
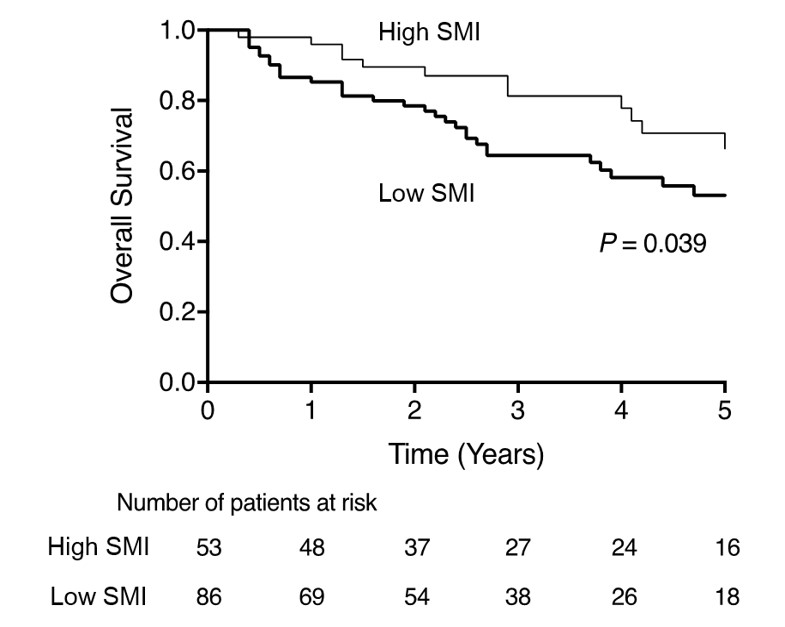
Low SMI
|
86 (62%)
|
63.6%
|
52.4%
|
0.039
|
2.006
|
1.012-3.974
|
0.046
|
|
High SMI
|
53 (38%)
|
80.9%
|
70.5%
|
|
|
|
|
|
Blood transfusion (+)
|
22 (16%)
|
40.0%
|
30.0%
|
0.002
|
2.012
|
1.001-4.045
|
0.050
|
|
(-)
|
117 (84%)
|
75.5%
|
64.3%
|
|
|
|
|
Variables in bold are statistically significant (P < 0.05). Abbreviations: BMI, Body mass index; ALBI, albumin-bilirubin; HBV, hepatitis type B; HCV, hepatitis type C; DM, diabetes mellitus; NLR, neutrophil-to-lymphocyte ratio; PLT, platelets; Hb, hemoglobin; PT, prothrombin time; AST, aspartate aminotransferase; ALT, alanine aminotransferase; CHE, cholinesterase; Alb, albumin; T-chol, total-cholesterol; PIVKAII, protein induced by vitamin K absence or antagonist-II; AFP, α-fetoprotein; IM, intrahepatic metastasis; VP, portal vain invasion; SMI, skeletal muscle mass index
Table 2. Prognostic factors for recurrence-free survival identified by univariate and multivariate analyses (N = 139)
|
|
|
|
|
Univariate
|
Multivariate
|
|
Variables
|
n (%)
|
3-year survival
|
5-year survival
|
P-value
|
HR
|
95% CI
|
P-value
|
|
Male sex
|
110 (79%)
|
45.8%
|
41.2%
|
0.180
|
|
|
|
|
Female sex
|
29 (21%)
|
56.6%
|
40.4%
|
|
|
|
|
|
Age (years) ≤ 80
|
109 (78%)
|
24.9%
|
24.9%
|
0.084
|
|
|
|
|
> 80
|
30 (22%)
|
52.4%
|
45.2%
|
|
|
|
|
|
BMI (kg/m2) > 25
|
34 (25%)
|
48.0%
|
48.0%
|
0.699
|
|
|
|
|
≤ 25
|
105 (75%)
|
48.3%
|
39.3%
|
|
|
|
|
|
ALBI grade III
|
30 (22%)
|
49.5%
|
44.6%
|
0.708
|
|
|
|
|
< grade III
|
109 (78%)
|
47.7%
|
40.1%
|
|
|
|
|
|
HBV (+)
|
27 (19%)
|
63.2%
|
47.7%
|
0.236
|
|
|
|
|
(-)
|
112 (81%)
|
44.1%
|
37.7%
|
|
|
|
|
|
HCV (+)
|
70 (50%)
|
40.8%
|
38.6%
|
0.163
|
|
|
|
|
(-)
|
69 (50%)
|
56.4%
|
44.2%
|
|
|
|
|
|
DM (+)
|
29 (21%)
|
57.5%
|
43.6%
|
0.674
|
|
|
|
|
(-)
|
110 (79%)
|
45.2%
|
39.9%
|
|
|
|
|
|
NLR ≥ 4
|
13 (9%)
|
19.4%
|
19.4%
|
0.279
|
|
|
|
|
< 4
|
126 (91%)
|
49.9%
|
42.5%
|
|
|
|
|
|
PLT (×104/μL): normal (13- 35)
|
97 (70%)
|
50.4%
|
42.4%
|
0.595
|
|
|
|
|
:abnormal
|
42 (30%)
|
44.1%
|
39.2%
|
|
|
|
|
|
Hb (g/dL): normal (13.5-15.8)
|
95 (68%)
|
50.5%
|
41.6%
|
0.795
|
|
|
|
|
:abnormal
|
44 (32%)
|
44.3%
|
40.9%
|
|
|
|
|
|
PT (%): normal (70-130)
|
125 (90%)
|
50.5%
|
42.5%
|
0.125
|
|
|
|
|
:abnormal
|
14 (10%)
|
28.8%
|
28.8%
|
|
|
|
|
|
AST (U/L): normal (13-33)
|
71 (51%)
|
45.6%
|
33.9%
|
0.888
|
|
|
|
|
:abnormal
|
68 (49%)
|
51.1%
|
48.1%
|
|
|
|
|
|
ALT (U/L): normal (8-42)
|
100 (72%)
|
48.8%
|
41.0%
|
0.770
|
|
|
|
|
:abnormal
|
39 (28%)
|
46.8%
|
40.9%
|
|
|
|
|
|
CHE (g/dL): normal (229-521)
|
77 (55%)
|
53.8%
|
44.9%
|
0.251
|
|
|
|
|
:abnormal
|
62 (45%)
|
41.7%
|
36.4%
|
|
|
|
|
|
Alb (g/dL): normal (4.0-5.0)
|
115 (83%)
|
48.5%
|
39.8%
|
0.878
|
|
|
|
|
:abnormal
|
24 (17%)
|
46.7%
|
46.7%
|
|
|
|
|
|
T-chol (mg/dL): normal (128-219)
|
118 (85%)
|
49.4%
|
43.0%
|
0.907
|
|
|
|
|
:abnormal
|
20 (14%)
|
42.1%
|
31.6%
|
|
|
|
|
|
PIVKA-II (mAU/mL): normal (< 40)
|
62 (45%)
|
61.0%
|
51.0%
|
0.048
|
1.321
|
0.778-2.240
|
0.320
|
|
:abnormal
|
77 (55%)
|
37.7%
|
33.0%
|
|
|
|
|
|
AFP (ng/mL): normal (> 10)
|
68 (49%)
|
58.8%
|
48.9%
|
0.036
|
1.612
|
0.960-2.707
|
0.071
|
|
: abnormal
|
68 (49%)
|
38.7%
|
33.5%
|
|
|
|
|
|
Tumor number: solitary
|
113 (81%)
|
51.8%
|
44.5%
|
0.025
|
1.810
|
1.025-3.197
|
0.041
|
|
: multiple
|
26 (19%)
|
31.4%
|
18.8%
|
|
|
|
|
|
Tumor size 3 cm <
|
71 (51%)
|
49.5%
|
43.4%
|
0.938
|
|
|
|
|
≤ 3 cm
|
54 (39%)
|
52.6%
|
42.7%
|
|
|
|
|
|
Poor differentiation
|
20 (14%)
|
42.1%
|
28.1%
|
0.337
|
|
|
|
|
Others (well, moderately)
|
119 (86%)
|
49.3%
|
43.6%
|
|
|
|
|
|
IM (+)
|
19 (14%)
|
5.6%
|
5.6%
|
< 0.001
|
4.115
|
2.255-7.510
|
< 0.001
|
|
(-)
|
120 (86%)
|
56.1%
|
47.5%
|
|
|
|
|
|
Vp (+)
|
26 (19%)
|
28.4%
|
28.4%
|
0.016
|
1.490
|
0.824-2.695
|
0.187
|
|
(-)
|
113 (81%)
|
52.8%
|
43.5%
|
|
|
|
|
|
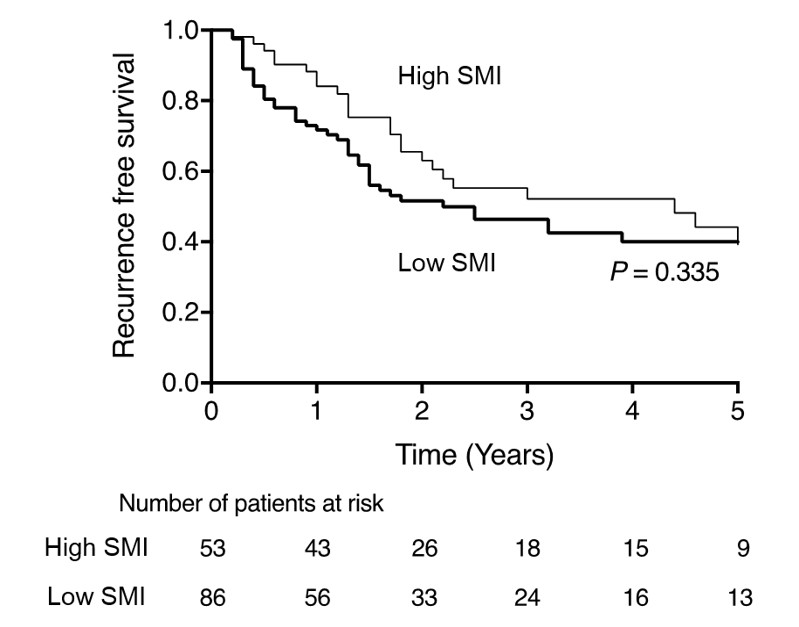
Low SMI
|
86 (62%)
|
46.1%
|
39.8%
|
0.335
|
|
|
|
|
High SMI
|
53 (38%)
|
51.9%
|
43.9%
|
|
|
|
|
|
Blood transfusion (+)
|
22 (16%)
|
24.6%
|
24.6%
|
0.008
|
2.288
|
1.244-4.207
|
0.008
|
|
(-)
|
117 (84%)
|
52.4%
|
44.4%
|
|
|
|
|
Variables in bold are statistically significant (P < 0.05). Abbreviations: BMI, Body mass index; ALBI, albumin-bilirubin; HBV, hepatitis type B; HCV, hepatitis type C; DM, diabetes mellitus; NLR, neutrophil-to-lymphocyte ratio; PLT, platelets; Hb, hemoglobin; PT, prothrombin time; AST, aspartate aminotransferase; ALT, alanine aminotransferase; CHE, cholinesterase; Alb, albumin; T-chol, total-cholesterol; PIVKAII, protein induced by vitamin K absence or antagonist-II; AFP, α-fetoprotein; IM, intrahepatic metastasis; Vp, portal vain invasion; SMI, skeletal muscle mass index
Table 3. Comparison of the characteristics of patients who underwent transfusion and those who did not undergo transfusion
|
|
All patients
(N=139)
|
With Transfusion
(n=22)
|
Without transfusion (n=117)
|
P-value
|
|
Male sex
|
110 (79%)
|
18 (82%)
|
92 (79%)
|
0.787
|
|
Age (years)
|
72 (32–92)
|
75 (57–88)
|
44 (32–92)
|
0.159
|
|
BMI (kg/m2)
|
23 (16–33)
|
22 (17–30)
|
23 (16–33)
|
0.228
|
|
HBV
|
27 (19%)
|
3 (14%)
|
24 (21%)
|
0.568
|
|
HCV
|
70 (50%)
|
12 (55%)
|
58 (50%)
|
0.817
|
|
DM
|
29 (21%)
|
2 (9%)
|
27 (23%)
|
0.165
|
|
NLR
|
2 (0.3–7.4)
|
2 (0.9–5.8)
|
12 (0.3–7.4)
|
0.481
|
|
PNI
|
47.4 (34.3–59.9)
|
45 (37–51)
|
48 (34.3–59.9)
|
0.002
|
|
GPS ≥1
|
24 (17%)
|
7 (32%)
|
17 (15%)
|
0.065
|
|
Hb (g/dL)
|
14.1 (9.4–18.2)
|
13.5 (9.4–17.8)
|
14.1 (9.4–18.2)
|
0.016
|
|
PLT (×104/μL)
|
19 (4–51)
|
15 (6–51)
|
18 (4–49)
|
0.256
|
|
PT (%)
|
84 (56–128)
|
83 (69–100)
|
84 (56–128)
|
0.398
|
|
T-Bil (mg/dL)
|
0.8 (0.2–2.0)
|
0.7 (0.2–2.0)
|
0.7 (0.2–1.5)
|
0.849
|
|
AST (U/L)
|
42 (11–130)
|
39 (14–123)
|
31 (11–130)
|
0.236
|
|
ALT (U/L)
|
37 (7–173)
|
27 (7–56)
|
30 (7–173)
|
0.548
|
|
ChE (g/dL)
|
234 (37–412)
|
196 (86–346)
|
235 (37–412)
|
0.303
|
|
Alb (g/dL)
|
4 (3–5)
|
4 (3–4.3)
|
4 (3–5)
|
0.016
|
|
ICGR15 (%)
|
13 (0.1–89)
|
13 (0.1–40)
|
13 (0.1– 89)
|
0.415
|
|
AFP (ng/mL)
|
10 (2–223330)
|
24 (4–65360)
|
8.4 (2–223330)
|
0.102
|
|
PIVKA-II (mAU/mL)
|
142 (12–675000)
|
428 (20–105000)
|
117 (12–675000)
|
0.017
|
|
Liver damage B
|
36 (26%)
|
6 (27%)
|
30 (26%)
|
1.000
|
|
Tumor diameter > 2 cm
|
34 (5–150)
|
45 (15–150)
|
31 (5–150)
|
0.372
|
|
Tumor number
|
1 (1–5)
|
1 (1–5)
|
1 (1–3)
|
0.718
|
|
Poor differentiation
|
20 (14%)
|
3 (14%)
|
17 (15%)
|
1.000
|
|
IM (+)
|
19 (6%)
|
4 (18%)
|
15 (13%)
|
0.738
|
|
Operation time (min)
|
303 (66–591)
|
383 (210–591)
|
282 (66–582)
|
<0.001
|
|
Intraoperative blood loss (g)
|
506 (0–6055)
|
820 (250–6055)
|
230 (0–2467)
|
<0.001
|
|
Hospital stay (days)
|
22 (5–100)
|
20 (11–80)
|
17 (5–100)
|
0.058
|
|
Recurrence
|
74 (53%)
|
14 (64%)
|
60 (51%)
|
0.026
|
Variables in bold are statistically significant (P<0.05). Continuous variables are expressed as medians (range). Qualitative variables are expressed as numbers (%). Abbreviations: BMI, Body mass index; HBV, hepatitis type B; HCV, hepatitis type C, DM, diabetes mellitus; NLR, neutrophil-to-lymphocyte ratio; PNI, prognostic nutritional index; GPS, Glasgow prognostic score; Hb, hemoglobin; PLT, platelets; PT, prothrombin time; T-Bil, total-bilirubin; AST, aspartate aminotransferase; ALT, alanine aminotransferase; ChE, cholinesterase; Alb, albumin; ICGR15, indocyanine green retention15; AFP, α-fetoprotein; PIVKA-II, protein induced by vitamin K absence or antagonist-II; IM, intrahepatic metastasis
Table 4. Comparison of the characteristics of patients who underwent transfusion and those who did not undergo transfusion
|
|
All patients
(N=139)
|
Transfusion
(n=22)
|
Without transfusion (n=117)
|
P-value
|
|
Male sex
|
110 (79%)
|
18 (82%)
|
92 (79%)
|
0.787
|
|
Age (years)
|
72 (32-92)
|
75 (57-88)
|
44 (32-92)
|
0.159
|
|
BMI (kg/m2)
|
23 (16-33)
|
22 (17-30)
|
23 (16-33)
|
0.228
|
|
HBV
|
27 (19%)
|
3 (14%)
|
24 (21%)
|
0.568
|
|
HCV
|
70 (50%)
|
12 (55%)
|
58 (50%)
|
0.817
|
|
DM
|
29 (21%)
|
2 (9%)
|
27 (23%)
|
0.165
|
|
NLR ≥4
|
2 (0.3-7.4)
|
2 (0.9-5.8)
|
12 (0.3-7.4)
|
0.481
|
|
PNI ≤40
|
47.4 (34.3-59.9)
|
45 (37-51)
|
48 (34.3-59.9)
|
0.002
|
|
GPS ≥1
|
24 (17%)
|
7 (32%)
|
17 (15%)
|
0.065
|
|
PLT (×104/μL)
|
19 (4-51)
|
15 (6-51)
|
18 (4-49)
|
0.256
|
|
PT (%)
|
84 (56-128)
|
83 (69-100)
|
84 (56-128)
|
0.398
|
|
T-Bil (mg/dL)
|
0.8 (0.2-2.0)
|
0.7 (0.2-2.0)
|
0.7 (0.2-1.5)
|
0.849
|
|
AST (U/L)
|
42 (11-130)
|
39 (14-123)
|
31 (11-130)
|
0.236
|
|
ALT (U/L)
|
37 (7-173)
|
27 (7-56)
|
30 (7-173)
|
0.548
|
|
ChE (g/dL)
|
234 (37-412)
|
196 (86-346)
|
235 (37-412)
|
0.303
|
|
Alb (g/dL)
|
4 (3-5)
|
4 (3-4.3)
|
4 (3-5)
|
0.016
|
|
ICGR15 (%)
|
13 (0.1-89)
|
13 (0.1-40)
|
13 (0.1- 89)
|
0.415
|
|
AFP (ng/mL)
|
10 (2-223330)
|
24 (4-65360)
|
8.4 (2-223330)
|
0.102
|
|
PIVKA-II (mAU/mL)
|
142 (12-675000)
|
428 (20-105000)
|
117 (12-675000)
|
0.017
|
|
Tumor diameter > 2cm
|
34 (5-150)
|
45 (15-150)
|
31 (5-150)
|
0.372
|
|
Tumor number
|
1 (1-5)
|
1 (1-5)
|
1 (1-3)
|
0.718
|
|
Poor differentiation
|
20 (14%)
|
3 (14%)
|
17 (15%)
|
1.000
|
|
IM (+)
|
19 (6%)
|
4 (18%)
|
15 (13%)
|
0.738
|
|
Operation time (min)
|
303 (66-591)
|
383 (210-591)
|
282 (66-582)
|
<0.001
|
|
Intraoperative blood loss (g)
|
506 (0-6055)
|
820 (250-6055)
|
230 (0-2467)
|
<0.001
|
|
Hospital stay (days)
|
22 (5-100)
|
20 (11-80)
|
17 (5-100)
|
0.058
|
|
Recurrence
|
74 (53%)
|
14 (64%)
|
60 (51%)
|
0.026
|
Variables in bold are statistically significant (P<0.05). Continuous variables are expressed as median (range). Qualitative variables are expressed as number (%). Abbreviations: BMI, Body mass index; HBV, hepatitis type B; HCV, hepatitis type C, DM, diabetes mellitus; NLR, neutrophil-to-lymphocyte ratio; PNI, prognostic nutritional index; GPS, Glasgow prognostic score; PLT, platelets; PT, prothrombin time; T-Bil, total-bilirubin; AST, aspartate aminotransferase; ALT, alanine aminotransferase; ChE, cholinesterase; Alb, albumin; ICGR15, indocyanine green retention15; AFP, α-fetoprotein; PIVKA-II, protein induced by vitamin K absence or antagonist-II; IM, intrahepatic metastasis