In this work, the tunicate cellulose nanocrystal (tCNC) was extracted from tunicate by bleaching and acid hydrolysis. It was used as filler in the preparation of sodium alginate-based enteric capsule. The addition of tCNC with high aspect ratio (65) rendered the enteric capsule excellent physical properties. Compared with the control sample, when the addition of tCNC was 10% (wt), the water contact angle of the capsule was enhanced by 46.0%, the opacity was increased by 356.8%, the maximum tensile stress was increased by 142.6%, the modulus of elasticity was increased by 240.3%, and the elongation at break was increased by 133.8%. In the in vitro degradation experiments, the capsule hardly degraded in the gastric environment (pH 1.2), while in the intestinal environment (pH 6.8), the degradation became slower with the increase of tCNC content, which was consistent with the properties of enteric capsule. This research developed a new direction for the application of tCNC in the pharmaceutical material productions.
Research Article
Study On The Effect of Tunicate Cellulose Nanocrystals in The Preparation of Sodium Alginate-Based Enteric Capsule
https://doi.org/10.21203/rs.3.rs-949624/v1
This work is licensed under a CC BY 4.0 License
Journal Publication
published 30 Jan, 2022
You are reading this latest preprint version
Tunicate cellulose nanocrystal
Sodium alginate
Enteric-soluble
Capsule
In the food and pharmaceutical industries, the capsule encapsulation (Samakradhamrongthai et al. 2019) technology has been widely used. The capsules are less likely to be broken down by saliva in the mouth than tablets (Fathi et al. 2018; Grill et al. 2020; Yan et al. 2020), providing good protection from damage and protecting the digestive and respiratory organs. Generally, according to the dissolution location, the capsules can be divided into two categories, the gastric capsule and the enteric capsule. Unlike the gastric capsule, the enteric capsule does not disintegrate in the lower pH environment, i.e., the acidic stomach. Upon reaching the small intestine, the enteric capsule starts to disintegrate and releases the drug in the neutral pH environment. This could protect the stomach from drug-induced irritation (Al-Gousous and Langguth 2015).
Materials with good physical properties and biocompatibility are used to produce enteric capsules to maintain the stability of the medicine during the storage (Kathpalia et al. 2014). Currently in the market, the raw material for capsule manufacturing is mainly gelatin (derived from the skin and bone of animals such as pigs and cows). In addition, gelatin is prone to cross-linking (Digenis et al. 1994) and the high moisture content of the capsules leads to instability of the filled hygroscopic drugs (Duconseille et al. 2015). Recently, some non-gelatin-based capsules attracted interest in the pharmaceutical material industry. The most common alternatives are hydroxypropyl methylcellulose (HPMC) (Fu et al. 2020), pullulan (Ding et al. 2020) and starch-based capsules (Chen et al. 2020; Ji et al. 2017). They serve as good substitutes for gelatin, but have some limitations since they are not pH-dependent and unstable in the enteral therapy. Sodium alginate (SA) is widely used in food, pharmaceutical, and bioengineering fields owing to its non-toxicity, stability, biocompatibility, and biodegradability (Abbasiliasi et al. 2019; Fayaz et al. 2009). Thus, SA has the potential to be used in the capsule production and could be an alternative of the traditional gelatin capsules. However, the mechanical properties of SA are weak, which makes it difficult to form capsule in the molding process.
The tunicates cellulose nanocrystal (tCNC) is extracted from the mantle of tunicate (a kind of marine animal). The tCNCs are linear polymers with many D-glucopyranose rings linked by α- and β-(1,4) glycosidic bonds. Recently, our research group has found that the crystallinity index (CrI) and aspect ratio of tCNC are 93.9% and 65.0, respectively. However, the CrI and aspect ratio of the softwood nanocellulose are 70.9% and 10.5, respectively. These high CrI and aspect ratio render the tCNC excellent physical strength (Cheng et al. 2020). Therefore, from this point of view, the tCNC might be used as enforcement agent in the SA capsule formation to increase the physical strength.
In this work, we applied the tCNC in the SA-based capsule using as a plasticizer. The prepared capsules were analyzed by mechanical characterizations, Fourier-transform infrared spectroscopy (FT-IR), and scanning electron microscope (SEM). The results showed that the tCNC was uniformly embedded into the SA matrix to form a rigid capsule. With the addition of tCNC, the hydrophobic property, opacity and tensile properties were significantly improved in the resulted capsule. In addition, the capsule was relatively stable in acidic medium but degraded well in neutral medium. Therefore, the SA-tCNC capsule is expected to load gastric irritant drug as enteric capsules. As far as we know, this is the first research on the effect of tCNC in the enteric capsule formation. This research would provide potential use of tCNC in the pharmaceutical material industry.
2.1 Materials
Tunicate were purchased from Weihai Sea Food Market in Shandong, China. Treasure blue edible pigment was purchased from Wilton Industries, Inc. Dialysis bag was purchased from MYM biological technology Co., Ltd. Phenyl isocyanate was purchased from Xiya Reagent Co., Ltd. KBr, KOH, phosphate buffered solution (PBS), NaClO2, H2SO4, CH3OH, acetic acid, glycerol, tetrahydrofuran, pyridine and sodium alginate (SA) were purchased from Shanghai Aladdin Biochemical Technology Co., Ltd. All the chemicals were used in this study without further purification.
2.2 Methods
2.2.1 Preparation of tCNC
The tunicate specimens were slit with a knife to remove the internal organs. The residual tunicate mantles were washed thoroughly with deionized water (DI water). After that, the mantles were soaked in a 5% (w/v) KOH solution for 10 h. Then, 300 mL 2% sodium chlorite solution and 5 mL of anhydrous acetic acid were mixed properly to make bleaching solution. The mantles were washed 3 times with DI water to neutral, and bleached with 300 mL bleaching solution at 70℃ for 6 hours, and the bleach solution was changed every 2 hours. At last they were washed thoroughly and cut into small pieces, which were designated as tunicate cellulose.
The tunicate cellulose was further hydrolyzed by sulfuric acid following a literature method (Tang et al. 2014). The tunicate cellulose was weighed 3 g in 105 mL 64% (v/v) sulfuric acid solution and stirred continuously for 2 h at 45 ℃. The reaction was terminated by adding excess (10 times) DI water, and the precipitate was collected by centrifugation at 8000 r/min for 30 min. The precipitate was dialyzed in a dialysis bag with a cut-off molecular weight of 12000-14000 until the pH of the solution became neutral. After dialysis, the suspension was sonicated for 30 min and designated as tCNC.
2.2.2 Gel permeation chromatography (GPC) analysis of tCNC and SA
The gel permeation chromatography (GPC) (Waters, Polymer Standards Service, Milford, USA) was used to determine the weighted average molecular weight (Mw) and degree of polymerization (DP) of tCNC and SA. Prior to the analysis, the tCNC and SA were derivatized by phenyl isocyanate based on a literature method (Hubbell and Ragauskas 2010). The tCNC/SA (15 mg) was weighed and placed in a test tube equipped with a micro-stirring bar. Then anhydrous pyridine (4.00 mL) and phenyl isocyanate (0.50 mL) were added and the tubes were capped with rubber film and reacted in an oil bath (DF101, Shanghai Qiuzuo Scientific Instrument Co., Ltd, China) at 70 ℃ for 72 h. And then 1.00 mL of CH3OH was added to quench the reaction. The reaction solution was added dropwisely to a volume ratio of 7:3 CH3OH/H2O solution (100.0 mL) to precipitate the reaction product. The solids were collected by filtration and then washed with methanol/water (1×50.0 mL) followed by water (2×50.0 mL). The derivatized tCNC/SA was dried under vacuum at 40 ℃ for 12 h. The derivatized tCNC and SA were then dissolved in tetrahydrofuran (2 mg/mL) for the GPC analysis. The DP is calculated by dividing the Mw of tCNC and SA by 519 g/mol and 436 g/mol, which are the molecular weights of the derivatized cellulose repeating units and SA repeating units, respectively.
2.2.3 Transmission electron microscopy (TEM) analysis of tCNC
The morphology of tCNC was studied by TEM (TECNAI G2 F20, FEI Co., USA). One drop of tCNC suspension (1 wt%) was deposited on the surface of a copper grid covered with a porous carbon film. The grids were then allowed to float in a 2 wt% uranyl acetate solution for 3 min to stain the samples. Finally, the samples were dried at room temperature for 24 h and then tested by TEM with a resolution of 0.2 nm at an accelerating voltage of 100 KV.
2.2.4 Preparation of tCNC-SA film
In order to perform the physical and mechanical properties testing of the tCNC-SA capsule, the tCNC-SA was firstly form a film since it has flat shape which is convenient for testing. The tCNC-SA film was formed as following: SA (3g) was firstly dissolved in DI water (100 mL) at 70°C in the water shaking bath (SY-2230, Crystal Instruments, USA). Then the glycerol (0.75 mL) was dropwisely added in the SA solution. After that, the tCNC was added to the solution in amounts of 0%, 1%, 3%, 5% and 10% of the total dry weight mass, which were marked as F0, F1, F2, F3 and F4, respectively. The tCNC was dispersed evenly in the SA solution by ultrasound and the tCNC-SA gel was formed. After that, the resulted gel was degased by water vacuum pump for 30 mins prior to the viscosity measurement. The viscosity of the tCNC-SA gel was determined by a viscometer (NDJ-5S, Shanghai Xingliang Optical Instrument Co., Ltd, China). In the meanwhile, the resulted gel was poured into a 90 mm diameter Petri dish and dried at 45℃ for 24 h to form the tCNC-SA film. The preparation process is shown in Fig. 1.
2.2.5 Mechanical properties measurement
The mechanical properties (tensile strength, modulus of elasticity, elongation) of the tCNC-SA film were measured by universal material testing machine (Instron 3365, Instron Corporation, USA). The tCNC-SA film was cut into long strips of 62 mm × 20 mm and the film thickness was measured by vernier calipers (Baigong 0-150mm, Shanghai Shenhan Measuring Tools Co., Ltd, China). The clamping distance was 25 mm and the stretching speed was 10 mm/min. Three parallel samples were measured and the average value was adopted. In addition, the tCNC-SA films (F0 and F3) were bended and twisted to visually observe its flexibility.
2.2.6 Opacity measurement
The opacity of the tCNC-SA film was determined by its UV absorbance based on a literature method (Abbasiliasi et al. 2019). Briefly, the tCNC-SA film was cut into squares with the size of 20 mm × 20 mm. The UV absorbances of these samples were recorded at 600 nm by UV spectrophotometer (Agilent 8453, Agilent Technologies Co. Ltd, USA) to calculate the opacity with the following equation (1) (Siripatrawan and Harte 2010):

Where A is the UV absorbance of the film at 600 nm, t is the film thickness, mm.
2.2.7 FT-IR analysis
The SA, glycerol, tCNC, and tCNC-SA film samples were placed on a Fourier infrared spectrometer (VERTEX 70, Germany Brooke Technology Co., Ltd, Germany) to determine the infrared spectrum. The resolution was set to 4 cm−1 and the samples were scanned 32 times in the range of 4000 to 400 cm−1.
2.2.8 X-ray diffraction analysis
The X-ray diffraction (XRD) was used to analyze the crystallinity of the tCNC and tCNC-SA film samples. The scanning speed was set to 2°/min and scanned in the range of 2θ = 5°~45° with a voltage of 40 kV and a current of 40 mA.
According to the study of French (French 2014), the tCNC was judged to be cellulose Iβ. The crystallinity index (CrI) was calculated according to Segal’s equation (2) (Segal et al. 1959; Yousefhashemi et al. 2019):

Where I200 is the diffraction intensity (2θ = 22.5°) of the (200) lattice plane in type I cellulose, and Iam is the diffraction intensity of the non-crystalline region at the minimum in the intensity near 18°.
2.2.9 Preparation of tCNC-SA capsule
The tCNC-SA capsules were prepared to observe the morphological changes in the in vitro degradation experiments. Basically, the tCNC-SA capsule and the tCNC-SA film shared the same chemical compositions. Their differences were on the formation process: the tCNC-SA capsule was dried in a mold while the tCNC-SA film was dried in a Petri dish.
The capsules were prepared following a reference method (Abbasiliasi et al. 2019). Preheat the stainless steel capsule mold at 70℃ oven. Repeat the experimental step 2.2.4 to prepare tCNC-SA gel with different tCNC ratios, and 1% (wt) of treasure blue edible pigment was also added in the mixture. The formed gel was stirred well and was poured into the preheated mold. Finally, the mold was dried in 45℃ oven for 4h. The amounts of 100 capsules were prepared by adding different proportions of tCNC film (F0-F4). The following equation (3) is used to calculate the capsule formation rate (C). Finally, the dried capsules were removed from the mold for subsequent characterization.

Where N1 is the number of capsules formed, and N2 is the number of capsules made.
2.2.10 Characterization of the tCNC-SA capsule
The capsule characterization includes the appearance, the dry loss and water contact angle testing. The appearance of the tCNC-SA capsule was characterized by visual observation, and the dry loss was tested according to US Pharmacopoeia (USP) (Pharmacopeial 2016) method. The cap and body of the capsule were separated and weighed. After that, they were dried at 105℃ oven for 6 hours and weighed the dry weight. The following equation (4) was used to calculate the dry loss.

Where m1 is the mass of the sample before drying, and m2 is the mass of the sample after drying.
The capsule appearance includes surface smoothness, color uniformity, shape deformation and odor. The water contact angle testing of the capsules was described as following: at ambient temperature, a certain size of capsule (20 mm × 20 mm) was cut and fixed on a carrier table, and the water of 5 µL was dropped onto the capsule surface. The WCA was measured by goniometer (DSA 30, Kruss, Germany) to characterize the film hydrophobicity. Five points were tested for each sample and the average value was adopted.
2.2.11 Scanning electron microscopy (SEM) analysis
The morphology of the tCNC-SA capsule was measured by SEM (Nova Nano SEM 230, FEI Co., USA). The treated sample was gold sprayed (100 s) by vacuum ion sputter (JFC-1600, JEOL Ltd, Japan), and the morphology of the sample was observed.
2.2.12 In vitro degradation experiments of tCNC-SA capsule
In order to protect the gastric mucosa from the irritation caused by the drug components, the capsules should not disintegrate and release drugs under acidic conditions. Therefore, in this research, the degradation study of the tCNC-SA was divided into two steps. The influences of tCNC loading and pH of PBS buffer solution on the capsule degradation were studied in the first and second step, respectively.
The first step focused on the effect of tCNC loading on capsule degradation time in a simulated human intestinal fluid of pH 6.8 and temperature (37℃). The optimized tCNC loading was based on the degradation time (60 min). In practice, each tCNC-SA capsule (F0, F1, F2, F3, F4) was weighed into glass test tubes, and 7 mL of pH 6.8 PBS was added separately and dissolved in a 37℃ water shaking bath. The undissolved solid samples were collected through filteration at different time intervals (0 min, 15 min, 30min and 60 min). The sample weight loss during the dissolution was calculated by the ratio of the initial sample weight (o.d. weight) and the o.d. weight of the sample in a certain time interval.
In the second step, the optimized tCNC loading was applied in the tCNC-SA capsule formation. These capsules were used to study the pH effect on their degradation. Two pHs, 1.2 and 6.8 were chosen to simulate the human gastric and intestinal fluid environment, respectively (Ilgin et al. 2020). In this step, the capsules were dissolved in two PBS (pH 1.2 and pH 6.8) at 37℃. During this process, the undissolved capsules were collected and the weight losses were also calculated, as described in the first step.
3.1 GPC analysis of SA and tCNC
The Mw,Mn, DP and DPI of tCNC and SA are summarized in Table 1. The Mw of tCNC is 2.49 × 10⁶ g/mol, Mn of of tCNC is 1.28× 10⁶ g/mol, the DP is 4672 and DPI is 1.95. While the Mw of SA is 2.97 × 10⁵ g/mol, Mn of SA is 1.69× 10⁵ g/mol, DP is 681 and DPI is 1.76.
|
Sample |
Mw (g/mol) |
Mn (g/mol) |
DP |
DPI |
|---|---|---|---|---|
|
tCNC |
2.49 × 10⁶ |
1.28× 10⁶ |
4798 |
1.95 |
|
SA |
2.97 × 10⁵ |
1.69× 10⁵ |
681 |
1.76 |
3.2 TEM analysis of tCNC
As shown in the TEM image (Fig. 2), the length and width of the tCNC were measured as 1300 nm and 20 nm, respectively. Then the aspect ratio was calculated as 65, which is in the range of previous report (Peng et al. 2011).
3.2 Formation of tCNC-SA film/capsule
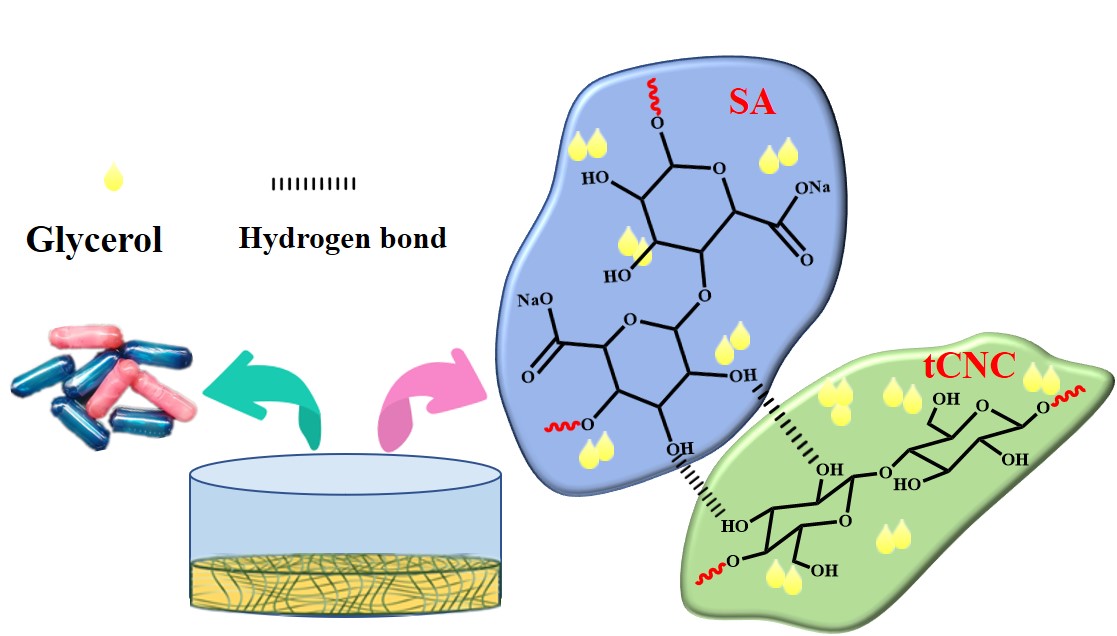
During the tCNC-SA film/capsule formation, the hydrogen bonding is formed between the hydroxyl groups in SA and the hydroxyl groups in tCNC, which forms a network structure (Fig. 3a). The glycerol is inserted between the molecular chains of SA and tCNC as a plasticizer. The intermolecular forces between the cellulose and SA molecular chains can be weakened by the glycerol, and the distance between them is increased (Xu et al. 2012). As a result, the possibility of movement between SA and the tCNC is increased, and the entanglement between molecular chains is reduced, resulting in increased plasticity of the composites.
The viscosity of the tCNC-SA gel is demonstrated in Fig. 3b. As the tCNC content increases, the viscosity of the tCNC-SA film gradually increases from 1.28 Pa s to 1.69 Pa s, which is 31.32% higher than that of blank sample F0. This phenomenon is attributed to the hydrogen bonding between tCNC and SA (Salas et al. 2014).
3.3 Mechanical property analysis of tCNC-SA film
Five stress-strain curves of tCNC-SA films are shown in Fig. 4a. There is basically no residual strain after the fracture, and the section is perpendicular to the direction of stress, indicating the film has a certain degree of rigidity and toughness (Revin et al. 2019). As the content of tCNC increases from 0 wt% to 10 wt%, the tensile stress of the tCNC-SA film increases from 12.64 MPa to 30.67 MPa, with a maximum increase of 142.6%. Fig. 4b shows the elastic modulus of different tCNC-SA films. With the addition of tCNC, compared with the control F0 sample, the elastic modulus of the film increases up to 240.3% when it contains 10% of tCNC (sample F4). Generally, the higher the modulus of elasticity, the more rigid the sample is and the less likely to be deformed. The improvements of the tensile stress and elastic modulus of the tCNC-SA film are due to the inherent advantages of high aspect ratio and high elastic modulus of the tCNCs, which shows excellent reinforcement in the polymer matrix (Iwamoto et al. 2009). When the tCNC was applied in the capsule formation, it has a certain degree of resistance to compression, which is conducive to alleviating the extrusion of the capsule during production, handling and storage.
When tCNC were added at 1% (sample F1), the elongation of the film before fracture is increased by 100% compared to F0, as shown in the Fig. 4c. In a previous study by our group, it was found that tCNC had significant high aspect ratio of 65, which renders it forming mesh-like structure in the composite. The high aspect ratio of the tCNC could enhance the binding sites between tCNC and SA (Boufi et al. 2016; Ming et al. 2021), forming interweaving network in the film. That might be the reason that the increase the tCNC content in the film could improve the elongation, as shown in Fig. 4c. It should be noted that, when the adding amounts increased from the 1% (sample F1) to 10% (sample F4), the film elongation rate was increased from 100–144% when compared with the contrast F0 sample. The results indicate the small quantity of tCNC could significantly increase the mechanical strength of the tCNC-SA. Further addition of tCNC has limit strength enhancement for the film. Furthermore, the addition of tCNC could also improve the film flexibility, as shown in Fig. 4 (d, e, f, g, h and i). The film made from the pure SA (sample F0) was rigid. Upon the bending and twisting force, it recovered to the original form rapidly. In contrast, the tCNC enhanced film (sample F3) is soft and flexible. The flexibility and softness is important for the capsules since these properties could reduce the irritation to the mucosa during the deglutition (Kathpalia et al. 2014)
The elasticity modulus and elongation rate of the enteric capsule are compared with previous report, as shown in Table 2. In current work, the elasticity modulus is much higher than that of HPMC/Gelatin and NCC/Gelatin, and the rate of elongation at break is slightly higher than that of HPMC/Gelatin. This indicates the mechanical properties of the capsule prepared in this study are superior or comparable to the reported capsules (Bae et al. 2008; Jimenez et al. 2010; Zhang et al. 2017).
|
Filler/main ingredient |
Elasticity modulus (MPa) |
Rate of elongation at break (%) |
Reference |
|---|---|---|---|
|
tCNC/SA |
607.7-1789.7 |
4.6-10.9 |
This work |
|
HPMC/Gelatin |
168-255 |
9.3 |
(Bae et al. 2008; Jimenez et al. 2010) |
|
NCC/Gelatin |
56-610 |
- |
(Zhang et al. 2017) |
3.4 Physical properties of tCNC-SA capsules
Physical properties of the capsule mainly include appearance, opacity, testing of water contact angle and the SEM observations. Table 3 summarizes the appearance, dry loss and formation rate data of capsules with different addition of tCNC. Without the addition of tCNC, the capsule formation rate was 0 (sample F0) since there is no complete tCNC-SA capsule formed in the mold. Upon the visually observation, the formed capsules (F1 to F4) have smooth surface with no cracks, no air bubbles and no odor.
As the amount of tCNC increases, the capsule formation rate gradually increases. The capsule formation rate reaches 92% when the amount of tCNC increases to 10%. The addition of tCNC renders the enhancement of physical strength and flexibility of the SA film, eventually leading to the increase of the capsule formation rate.
The dry loss of F0 was only 8.61% and reached a maximum of 15.45% (sample F4) with the 10 wt% of tCNC added. This is due to the hydrogen bonding between tCNC and SA, which results in the absorption of water (Gilormini and Verdu 2018) in the prepared film and therefore the dry loss increases.
It can be visually observed in Fig. 5a and Fig. 5c that the opacity of the tCNC-SA capsule increases with the increase of the tCNC content. The F0 is a SA film with an opacity of 0.44 and high transparency. When 1% tCNC and 10% tCNC were added (Sample F1 and F4), the increases of opacity are 15.9% and 356.8%, respectively. This is due to the reason that the tCNC is partially agglomerated in the film and forms a self-assembled network, which hinders the passage of light through the film (Qian et al. 2010). Since all the film thickness are similar as discussed in the sample preparation, the film opacity is directly related to the film UV absorbance, as indicated in Equation 1. According to the opacity data in Table 3, the tCNC-SA film opacities increases with the increase of tCNC content, which means that the film material has the potential to act as a UV absorber, rendering it light sheltering abilities. Therefore, the adding of tCNC in the capsule could reduce the amount of shading agent added during the preparation of capsules.
|
Testing items |
Samples |
||||
|---|---|---|---|---|---|
|
F0 |
F1 |
F2 |
F3 |
F4 |
|
|
Appearance |
- |
No cracks, smooth surface, no bubbles and no odor |
|||
|
Dry Loss (%) |
8.61 |
12.01 |
13.16 |
15.15 |
15.45 |
|
Capsule formation rate (%) |
0 |
76 |
84 |
90 |
92 |
The WCA is used to determine the resistance of the tCNC-SA capsule surface to liquid water, which can reflect the hydrophobicity/hydrophilicity of the sample surface (Rhim 2011). The pure SA film (sample F0) has poor water resistance, and the addition of tCNC can improve this hydrophobicity, as shown in Fig. 5b. There is no tCNC in the F0 sample, which has a WCA of 36.5°, and the water diffuses randomly in all directions. As the tCNC content increases, the WCA of the film becomes enlarged, which also leads to a more circular water permeation shape. This indicates that the addition of tCNC makes the propagation of water resistance more uniform. When the addition of tCNC was 10%, the water contact angle of the film surface was 53.3°, which increased by 46.0% compared with 0% tCNC addition sample. A strong hydrogen bonding can occur between the hydroxyl group on tunicate nanocellulose and the hydroxyl groups in SA, thus improving the bonding of these two substrates and inhibiting the water absorption of the sample. After wetting, water molecules cannot break through these strong hydrogen bonds, so it plays a role in improving the hydrophobic property of the film (Abdollahi et al. 2013).
The ratios of tCNC are different, and the surface structure of the tCNC-SA capsule is also different. The surface and cross-section of the tCNC-SA films were characterized using SEM to investigate the morphology of tCNC in the SA substrate film, as shown in Fig. 6. From the surface diagram (a-e), it can be observed that tCNC with high aspect ratio exists in the film in the form of thin strips. From F0 to F4, the tCNC is added more and more, the surface of the film becomes rougher and even some agglomeration occurs. In the cross-sectional view (Fig. 6: h-j), it is observed that tCNC is uniformly distributed in the film in the form of network, which could enhance the physical properties of the film. This is the reason why the mechanical properties of tCNC-CA films become stronger as the amount of tCNC increases.
3.5 Chemical characterization of tCNC-SA film
Figure 7a represents the FT-IR spectra of tCNC,glycerol, SA, F0, F1, F2, F3 and F4. No chemical reaction occurred during the preparation of the tCNC-SA film, so no new characteristic peaks appear in F0, F1, F2, F3 and F4. And the transmittance of F0, F1, F2, F3 and F4 in the IR spectrum increases with the increase of tCNC content. The absorption peaks at 3415 cm−1, 3342 cm−1, 1638 cm−1 and 1413 cm−1 are attributed to the O-H stretching vibration. The absorption peaks at 2920 cm−1 and 2904 cm−1 is attributed to the C-H stretching vibration. The absorption peak at 1620 cm−1 is attributed to C=C stretching vibration. The two absorption peaks at 1299 cm−1 and 1089 cm−1 are caused by C-O stretching vibration, and the absorption peak at 817 cm−1 is attributed to the C=C bending vibration (Saravanakumar et al. 2020). Two characteristic peaks of glycerol at 2937 cm−1 and 2879 cm−1 belong to CH2 asymmetric and symmetric stretching vibration, respectively. The characteristic peaks of tCNC, SA, and glycerol interact with each other, which results in peak overlaps in two large ranges (3778 cm−1-2437 cm−1 and 1856 cm−1-1016 cm−1) (Zhao et al. 2020).
Figure 7b shows the XRD spectrum of the crystal structure of the tCNC and tCNC-SA films (samples F0 to F4). It can be seen that the diffraction characteristics of the films (F1, F2, F3 and F4) are essentially the same as those of tCNC, which is a typical cellulose I-type structure with three typical lattice surfaces with intensities of 2θ = 14.66° (1-10), 16.58° (110) and 22.76° (200), respectively (Cheng et al. 2020; Narita et al. 2005). The calculated CrI values of F1, F2, F3, F4 and tCNC are 32.4%, 57.3%, 68.8%, 82.1% and 96.1%, respectively. The F0 results show that SA had no obvious crystalline features, indicating the amorphous structure of alginate. In the film samples (F0 to F4), the intensity of the characteristic peaks gradually increases with the increase of tCNC.
3.6 Degradation of tCNC-SA capsule
3.6.1 Degradation of tCNC-SA capsule with different tCNC ratios
The addition of tCNC inhibited the degradation of the capsule as analyzed in Fig. 8a and Fig. 8b. F1, F2, F3 and F4 disintegrate at 15 mins without affecting the release of drug, which is in accordance with the US Pharmacopoeia requirements on disintegration time of hard capsules (Pharmacopeial 2016). F1 degrades completely within 60 min, F2, F3 and F4 cannot be completely degraded within 60 min, especially F4, where the mass loss value is about 50% at 60 min. This is due to the fact that tCNC and SA are cross-linked by hydrogen bonds and form a mesh structure, which hinder the disintegration of the capsules. Therefore, with the increase of tCNC content, the mass loss is smaller.
3.6.2 In vitro degradation of tCNC-SA capsule in different pH environments
Figure 9a shows the in vitro degradation mass loss and degradation photos of F2 at different pH environments (pH 1.2 and pH 6.8). The mass loss of the tCNC-SA capsule in pH 6.8 increases continuously with time and finally reached 67.3% at 60 min. In contrast, in the solution with pH=1.2, the mass loss of the tCNC-SA capsule is 8.2% after 30 min, and then the mass is stabilized (Fig. 9b). The SA contains a large amount of -COO−. Under acidic conditions, it is turned into -COOH. Thus, the ionization and the hydrophilicity of SA decrease, leading to the contraction of molecular chains (Hua et al. 2010). Therefore, the prepared tCNC-SA capsule hardly degrades in acidic conditions. The capsule in pH 6.8 is softened at 15 min and cannot maintain their original shape, and most of them degrade at 60 min. Based on these observations, the tCNC-SA capsule can be applied as enteric-soluble capsule, which is loaded with drugs that are irritating to the stomach. As a result, the tCNC-SA capsule can be digested and absorbed in the intestine.
In this study, the tCNC enhanced SA-based capsules were prepared. Due to the formation of hydrogen bonds between tCNC and SA, the mechanical properties, water contact angle, opacity of the tCNC-SA capsules are significantly improved. When tCNC loading was 10% (w/w), the water contact angle of the capsules increased by 46.0%, opacity increased by 356.8%, tensile stress increased by 142.6%, elastic modulus increased by 240.3%, and elongation increased by 137.0%, respectively.
During the in vitro disintegration experiment, the conversion of -COO− in SA to -COOH under acidic conditions leads to decrease of capsule ionization. As a result, the tCNC-SA capsules barely disintegrated under acidic conditions (pH 1.2), while they could disintegrate at a pH of 6.8 in 15 min, which indicates the excellent pH responsibilities.
Therefore, the prepared tCNC-SA composite is expected to be used as enteric capsules, which lays the foundation for the application of tCNC in pharmaceutical material production.
CRediT authorship contribution statement
Dezhong Xu: Conceptualization, Methodology, Validation, Formal analysis, Investigation. Yanan Cheng: Conceptualization, Methodology, Validation, Formal analysis, Investigation. Shuai Wu: Resources, Data curation, Writing – original draft. Qiuxia Zou & Ajoy Kanti Mondal: Methodology, Validation, Formal analysis, Investigation. Dengwen Ning: Writing – review & editing, Visualization. Fang Huang: Supervision, Writing – review & editing, Project administration, Funding acquisition.
Declaration of Competing Interest
The authors report no declarations of interest.
Acknowledgements
This work was supported by National Key Research and Development Program of China (2017YFB0307900), National Natural Science Foundation of China (22078061), the guide project from Department of Science and Technology of Fujian Province (2018H0006), and the Foundation (KF201922) of State Key Laboratory of Biobased Material and Green Papermaking, Qilu University of Technology, Shandong Academy of Sciences.
- Abbasiliasi S, Tan JS, Ibrahim T, Ismail N, Ariff AB, Mokhtar NK, Mustafa S (2019) Use of sodium alginate in the preparation of gelatin-based hard capsule shells and their evaluation in vitro. RSC Adv 9:16147–16157. https://doi.org/10.1039/C9RA01791G
- Abdollahi M, Alboofetileh M, Behrooz R, Rezaei M, Miraki R (2013) Reducing water sensitivity of alginate bio-nanocomposite film using cellulose nanoparticles. Int J Biol Macromo 54:166–173. https://doi.org/10.1016/j.ijbiomac.2012.12.016
- Al-Gousous J, Langguth P (2015) European versus United States Pharmacopeia Disintegration Testing Methods for Enteric-Coated Soft Gelatin Capsules. Dissolut Technol 22:6–8. https://doi.org/10.14227/DT220315P6
- Bae HJ, Cha DS, Whiteside WS, Park HJ (2008) Film and pharmaceutical hard capsule formation properties of mungbean, waterchestnut, and sweet potato starches. Food Chem 106:96–105. https://doi.org/10.1016/j.foodchem.2007.05.070
- Boufi S, Gonzalez I, Delgado-Aguilar M, Tarres Q, Angels Pelach M, Mutje P (2016) Nanofibrillated cellulose as an additive in papermaking process: A review. Carbohyd Polym 154:151–166. https://doi.org/10.1016/j.carbpol.2016.07.117
- Chen Q, Zong Z, Gao X, Zhao Y, Wang J (2020) Preparation and characterization of nanostarch-based green hard capsules reinforced by cellulose nanocrystals. Int J Biol Macromo 167:1241–1247. https://doi.org/10.1016/j.ijbiomac.2020.11.078
- Cheng Y, Mondal AK, Wu S, Xu D, Ning D, Ni Y, Huang F (2020) Study on the Anti-Biodegradation Property of Tunicate Cellulose. Polymers 12:3071. https://doi.org/10.3390/polym12123071
- Digenis GA, Gold TB, Shah VP (1994) Cross-linking of gelatin capsules and its relevance to their in vitro-in vivo performance. J Pharm Sci 83:915–921. https://doi.org/10.1002/jps.2600830702
- Ding Y, Jiang F, Chen L, Lyu W, Chi Z, Liu C, Chi Z (2020) An Alternative Hard Capsule Prepared with the High Molecular Weight Pullulan and Gellan: Processing, Characterization, and In Vitro Drug Release. Carbohyd Polym 237:116172. https://doi.org/10.1016/j.carbpol.2020.116172
- Duconseille A, Astruc T, Quintana N, Meersman F, Sante-Lhoutellier V (2015) Gelatin structure and composition linked to hard capsule dissolution: A review. Food Hydrocolloid 43:360–376. https://doi.org/10.1016/j.foodhyd.2014.06.006
- Fathi M, Kazemi S, Zahedi F, Shiran MR, Moghadamnia AA (2018) Comparison of oral bioavailability of acetaminophen tablets, capsules and effervescent dosage forms in healthy volunteers. Curr Iss Pharm Med S 31:5–9. https://doi.org/10.1515/cipms-2018-0001
- Fayaz AM, Balaji K, Girilal M, Kalaichelvan PT, Venkatesan R (2009) Mycobased Synthesis of Silver Nanoparticles and Their Incorporation into Sodium Alginate Films for Vegetable and Fruit Preservation. J Agric Food Chem 57:6246–6252. https://doi.org/10.1021/jf900337h
- French AD (2014) Idealized powder diffraction patterns for cellulose polymorphs. Cellulose 21:885–896. https://doi.org/10.1007/s10570-013-0030-4
- Fu M, Blechar JA, Sauer A, Al-Gousous J, Langguth P (2020) In Vitro Evaluation of Enteric-Coated HPMC Capsules-Effect of Formulation Factors on Product Performance. Pharmaceutics 12:696. https://doi.org/10.3390/pharmaceutics12080696
- Gilormini P, Verdu J (2018) On the role of hydrogen bonding on water absorption in polymers. Polymer 142:164–169. https://doi.org/10.1016/j.polymer.2018.03.033
- Grill S, Bruderer S, Sidharta PN, Antonova M, Globig S, Carlson J, Csonka D (2020) Bioequivalence of macitentan and tadalafil given as fixed-dose combination or single-component tablets in healthy subjects. Brit J Clin Pharmaco 86:2424–2434. https://doi.org/10.1111/bcp.14347
- Hua S, Ma H, Li X, Yang H, Wang A (2010) pH-sensitive sodium alginate/poly (vinyl alcohol) hydrogel beads prepared by combined Ca2+ crosslinking and freeze-thawing cycles for controlled release of diclofenac sodium. Int J Biol Macromo 46:517–523. https://doi.org/10.1016/j.ijbiomac.2010.03.004
- Hubbell CA, Ragauskas AJ (2010) Effect of acid-chlorite delignification on cellulose degree of polymerization. Bioresource Technol 101:7410–7415. https://doi.org/10.1016/j.biortech.2010.04.029
- Ilgin P, Ozay H, Ozay O (2020) Synthesis and characterization of pH responsive alginate based-hydrogels as oral drug delivery carrier. J Polym Res 27:251. https://doi.org/10.1007/s10965-020-02231-0
- Iwamoto S, Kai W, Isogai A, Iwata T (2009) Elastic Modulus of Single Cellulose Microfibrils from Tunicate Measured by Atomic Force Microscopy. Biomacromolecules 10:2571–2576. https://doi.org/10.1021/bm900520n
- Ji Z, Bao X, Liu H, Wang Y, Chen L, Yu L (2017) Engineering starch-based capsules for controlled delivery. J Control Release 259:e88. https://doi.org/10.1016/j.jconrel.2017.03.191
- Jimenez A, Fabra MJ, Talens P, Chiralt A (2010) Effect of lipid self-association on the microstructure and physical properties of hydroxypropyl-methylcellulose edible films containing fatty acids. Carbohyd Polym 82:585–593. https://doi.org/10.1016/j.carbpol.2010.05.014
- Kathpalia H, Komal, Sharma, Doshi G (2014) Recent trends in Hard Gelatin capsule delivery System. J Adv Pharm Edu & Res 4:165–177. https://doi.org/10.13140/2.1.2731.4884
- Ming X, Li Q, Feng J, Jiang W (2021) Analysis and optimization of process parameters of the degradable fiber mulch paper made from pineapple leaf and rice straw by response surface method. BioResources 16:3454–3468. https://doi.org/10.15376/biores.16.2.3454-3468
- Narita T, Hébraud P, Lequeux F (2005) Effects of the rate of evaporation and film thickness on nonuniform drying of film-forming concentrated colloidal suspensions. Eur Phys J E 17:69–76. https://doi.org/10.1140/epje/i2004-10109-x
- Peng BL, Dhar N, Liu HL, Tam KC (2011) Chemistry and applications of nanocrystalline cellulose and its derivatives: A nanotechnology perspective. Can J Chem Eng 89:1191–1206. https://doi.org/10.1002/cjce.20554
- Pharmacopeial US (2016) The United States Pharmacopeia and National Formulary USP 40–NF 35. The United States Pharmacopeia.
- Qian L, Zhou J, Zhang L (2010) Structure and properties of the nanocomposite films of chitosan reinforced with cellulose whiskers. J Polym Sci Pol Phys 47:1069–1077. https://doi.org/10.1002/polb.21711
- Revin V, Pestov V, Shchankin NA, Mishkin MV, Platonov VP, Uglanov VI D, A (2019) A Study of the Physical and Mechanical Properties of Aerogels Obtained from Bacterial Cellulose. Biomacromolecules 20:1401–1411. https://doi.org/10.1021/acs.biomac.8b01816
- Rhim JW (2011) Effect of clay contents on mechanical and water vapor barrier properties of agar-based nanocomposite films. Carbohyd Polym 86:691–699. https://doi.org/10.1016/j.carbpol.2011.05.010
- Salas C, Nypeloe T, Rodriguez-Abreu C, Carrillo C, Rojas OJ (2014) Nanocellulose properties and applications in colloids and interfaces. Curr Opin Colloid In 19:383–396. https://doi.org/10.1016/j.cocis.2014.10.003
- Samakradhamrongthai RS, Angeli PT, Kopermsub P, Utama-ang N (2019) Optimization of gelatin and gum arabic capsule infused with pandan flavor for multi-core flavor powder encapsulation. Carbohyd Polym 226:115262. https://doi.org/10.1016/j.carbpol.2019.115262
- Saravanakumar K, Sathiyaseelan A, Mariadoss A, Hu X, Wang MH (2020) Physical and bioactivities of biopolymeric films incorporated with cellulose, sodium alginate and copper oxide nanoparticles for food packaging application. Int J Biol Macromo 153:207–214. https://doi.org/10.1016/j.ijbiomac.2020.02.250
- Segal L, Creely JJ, Martin A Jr, Conrad C (1959) An empirical method for estimating the degree of crystallinity of native cellulose using the X-ray diffractometer Textile research journal. 29:786–794. https://doi.org/10.1177/004051755902901003
- Siripatrawan U, Harte BR (2010) Physical properties and antioxidant activity of an active film from chitosan incorporated with green tea extract. Food Hydrocolloid 24:770–775. https://doi.org/10.1016/j.foodhyd.2010.04.003
- Tang Y, Yang S, Zhang N, Zhang J (2014) Preparation and characterization of nanocrystalline cellulose via low-intensity ultrasonic-assisted sulfuric acid hydrolysis. Cellulose 21:335–346. https://doi.org/10.1007/s10570-013-0158-2
- Xu H, Chai Y, Zhang G (2012) Synergistic Effect of Oleic Acid and Glycerol on Zein Film Plasticization. J Agr Food Chem 60:10075–10081. https://doi.org/10.1021/jf302940j
- Yan X, Zhang K, Yang Y, Deng D, Lyu C, Xu H, Du Y (2020) Dispersible and Dissolvable Porous Microcarrier Tablets Enable Efficient Large-Scale Human Mesenchymal Stem Cell Expansion. Tissue Eng Part C-Me 26:263–275. https://doi.org/10.1089/ten.tec.2020.0039
- Yousefhashemi SM, Khosravani A, Yousefi H (2019) Isolation of lignocellulose nanofiber from recycled old corrugated container and its interaction with cationic starch–nanosilica combination to make paperboard. Cellulose 26:7207–7221. https://doi.org/10.1007/s10570-019-02562-2
- Zhang Y, Zhao Q, Wang H, Jiang X, Cha R (2017) Preparation of green and gelatin-free nanocrystalline cellulose capsules. Carbohyd Polym 164:358–363. https://doi.org/10.1016/j.carbpol.2017.01.096
- Zhao J, Li S, Zhao Y, Peng Z (2020) Effects of cellulose nanocrystal polymorphs and initial state of hydrogels on swelling and drug release behavior of alginate-based hydrogels. Polym Bull 77:4401–4416. https://doi.org/10.1007/s00289-019-02972-z