Apelin Expression was Increased in Lung Cancer Tissues
In this study, the expression of apelin in tissue samples of patients with lung cancer was detected by immunohistochemistry. Of the 51 patients enrolled in the study (32 men and 19 women), 24 had adenocarcinoma of the lung tissues (LUAD) and 27 had squamous carcinoma of the lung tissues (LUSC; Supplementary Table 1). In addition to 51 resected tumor samples, 39 distant healthy tissues were used as controls. Staining intensity was classified as low or high (Fig. 1a). Apelin expression was significantly higher in tumor tissues than in normal tissues (Fig. 1a). Kaplan-Meier analysis indicated that increased apelin expression was related to poorer survival of lung cancer patients, although not significantly so (P=0.362; Fig. 1b). As in our previous study, Apelin expression was markedly elevated in lung tumor tissues.
Apelin Increased the proliferation of Lung Cancer Cells
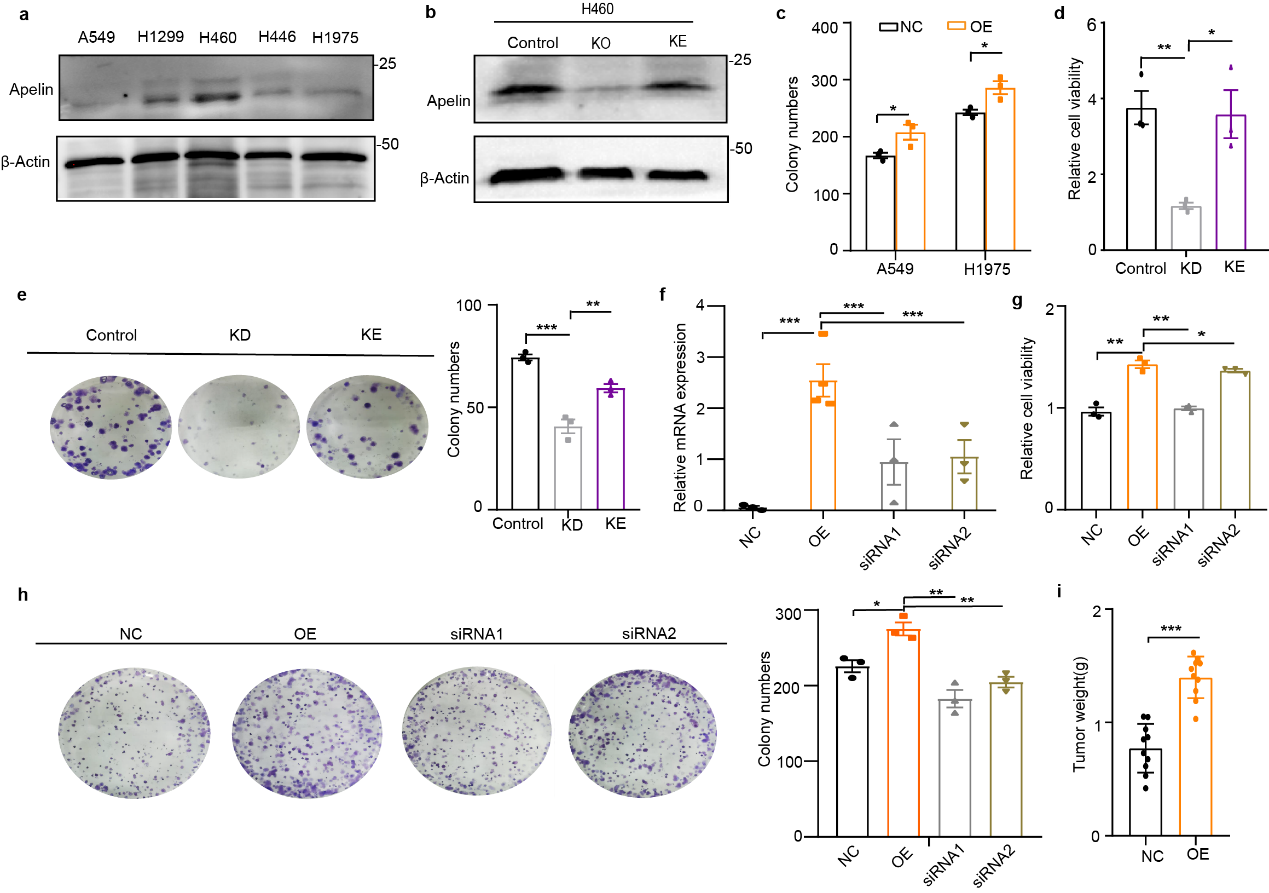
To further explore the functions of apelin in lung cancer, we first analyzed the expression of apelin in cell lines from both tumor (A549, H1299, H446, H1975, and H460) and normal lung tissue (HBE). The expression of apelin was higher in H1299 and H460 cells in both mRNA and protein concentrations (Fig. 1d and Supplementary Fig. 1a) than in A549, H1975, and H446 (Fig. 1d).
In the next study, A549 (A549-OE) and H1975 (H1975-OE) were selected for apelin stable overexpression (Fig. 1e), and H460 (H460-KD) (KD, knock-down) was used for sh-RNA knockdown of apelin and restored with Apelin(KE) (Supplementary Fig. 1b). Overexpression of apelin increased cell viability (Fig. 1f) and colony formation (Fig. 1g and Supplementary Fig. 1c) in A549 and H1975 cells. Decreased G1 phase (A549) and enhanced S phage (A549 and H1975) were also observed in the A549-OE and H1975-OE groups (Fig. 1h). Knock down of apelin greatly suppressed cell viability and colony formation, whereas re-expression of apelin rescued the cellular proliferation in H460-KD cells (Supplementary Fig. 1d,e).
In addition, we found that knock-down expression of apelin in A549-OE substantially reduced cell viability and colony formation after apelin-siRNA treatment (Supplementary Fig. 1f-h). These results confirmed that apelin enhances cellular proliferation and colony formation in lung cancer cells. Finally, A549-OE and –NC cells implanted into nude mice resulted in subcutaneous tumor formation and increased tumor formations (Fig. 1i). Tumor volume (Fig. 1j), and tumor weight (Supplementary Fig. 1i) in A549-NC and -OE group were detected from 6 weeks after implantation. All these results indicate that apelin promoted tumor growth in lung cancer cells.
Apelin Induced Metabolic Reprogramming in Lung Cancer Cells by Enhancing Lipid Metabolism
To investigate how apelin promotes tumor formation, A549-OE and –NC cells detected by RNA-Seq revealed enrich variation were metabolic-related genes in A549-OE cells (Fig. 2a), indicating changes in apelin expression are associated with changes in metabolism. Quantitative PCR showed that fatty acid synthesis-related genes were upregulated in both A549-OE (OE, over-expression) and H1975-OE cells, including GLUT4, FASN, ACC1, and SREBF1(Fig. 2b), which were also observed in protein concentrations (Fig. 2c).
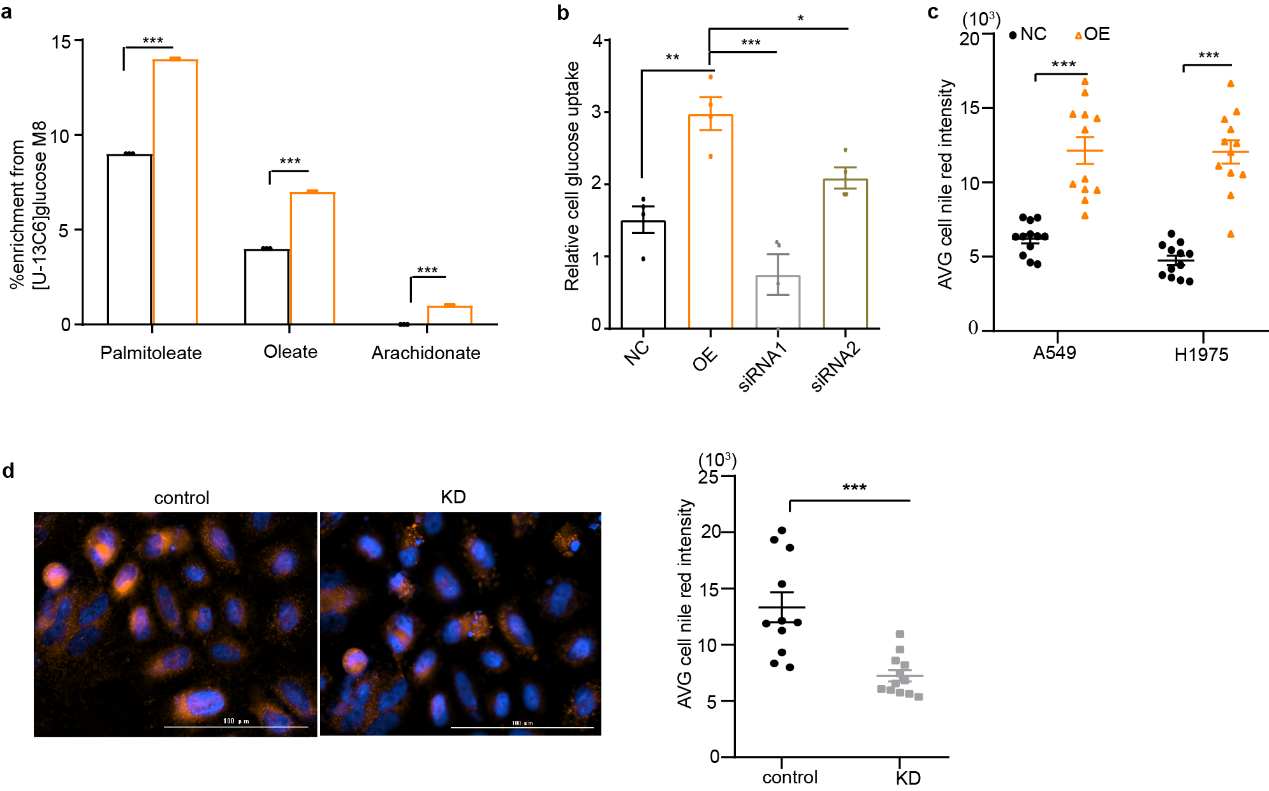
Glucose was the most important material in both the tricarboxylic acid cycle (TCA) and lipid synthesis (Fig. 2d). To test whether apelin uses glucose as an energy source to increase fatty acids synthesis, both A549-OE and –NC (NC, negative controls) cells were labelled with [U-13C6] glucose to measure carbon incorporation into newly synthesized fatty acids over 24 hours. The results indicated that apelin promoted the synthesis of both saturated fatty acids (palmitate, stearate, and myristate; Fig. 2e) and unsaturated fatty acids (palmitoleate, oleate, and arachidonate (Supplementary Fig. 2a). The intermediaries of the TCA cycle were mostly decreased in A549-OE cells except citrate (Fig. 2f). Glucose uptake was also elevated in A549-OE and H1975-OE cells (Fig. 2g), and apelin-siRNAs reduced the elevated glucose uptake (Supplementary Fig. 2b), which indicated that apelin preferentially used glucose as source for lipogenesis.
We next used nile red staining to detect the lipid concentration on apelin-overexpression or knock-down cells. Lipid components markedly were greatly increased in A549-OE and H1975-OE cells (Fig. 2h and Supplementary Fig. 2c). Instead, glucose uptake declined, and lipid components accumulation was restrained in H460-KD cells (Fig. 2i and Supplementary Fig. 2d).
To verify the effect of lipids on cell proliferation, H460-negative control (control, H460) and apelin knock-down cells (KD, H460) cells were grown in palmitate and then plated into media containing either regular fetal bovine serum (FBS) or delipidated FBS (FCS) in the presence or absence of exogenous palmitate. Cellular growth in apelin knock-down cells (KD, H460) was markedly lower than in controls(control, H460) in medium containing regular FBS, a result that was even more pronounced in delipidated FBS, but apelin-KD cells (KD, H460) were rescued by exogenous palmitate (Fig. 2j).
Finally, nile red staining in H460-control and –KD cells, as well as those treated and untreated with palmitic acid in a medium containing FBS or FCS, also confirmed that apelin knock-down greatly decreased lipid content (Fig. 2k). Taken together, these results indicate that apelin can induce metabolic reprograming by promoting lipid synthesis.
SREBP1 was Important in Apelin-Mediated Lipid Metabolism
Our study indicated that apelin markedly promoted the expression of sterol-regulatory-element-binding proteins 1 (SREBP1; Fig. 2b), a transcription factor that induces the expression of genes synthesizing cholesterol and fatty acids26. High glucose stimulation enhances SREBP1 expression and prevents SREBP1 binding to ER-anchored, insulin-induced gene protein (Insig1) and activates the expression genes involved in lipid metabolism14. Therefore, we further investigated whether SREBP1 was involved in apelin-induced abnormal lipid metabolism.
Overexpression of apelin promoted mature (SREBP1-N) and precursor-SREBP1 (SREBP1-P) expression in A549-OE and H1975-OE cells (Fig. 3b). Cellular immunofluorescence experiments confirmed that apelin promoted the expression of endogenous SREBP1 and the localization of SREBP1 to the Golgi apparatus and to the nucleus in A549-OE cells (Fig. 3b), a finding further confirmed by nuclear protein detection (Fig. 3c). To further confirm the effect of apelin on SREBP1, knock-down apelin in H460 cell(H460-KD), SREBP1 expression level and activity were reduced, but were rescued with reconstituted of apelin in H460-KE cell (Fig. 3d).
Next, SREBP1-siRNA was introduced to confirm the function of SREBP1 in apelin-mediated lipid metabolism. We found that inhibiting SREBP1 decreased both mature and precursor-SREBP1, as well as the lipid synthesis-related molecules, ACC1 and FASN, in both protein (Fig. 3e) and mRNA concentrations (Fig. 3f). Nile red staining revealed that lipid synthesis was also inhibited in A549-OE and H1975-OE cells in the knockdown of SREBP1 (Fig. 3g). Finally, si-SREBP1 also inhibited cell viability in A549-OE and H1975-OE cells (Fig. 3h). These results strongly suggest the importance of SREBP1 in abnormal lipogenesis and cell viability mediated by apelin.
Apelin Improved SREBP1 Activity by Forming Apelin-SREBP1 Complexes and Inhibiting SREBP1-Insig1 Binding
Th above results confirmed that apelin promotes SREBP1 activity, but the molecular mechanism is still unknown. Insulin-induced gene protein 1 (Insig1) could bind to SREBP1 on the endoplasmic reticulum, restrain the movement of SREBP1 to the Golgi apparatus, inhibit the N-terminal cleavage of SREBP1 into the nucleus, and regulate the expression of lipid metabolism genes. Therefore, a co-immunoprecipitation (Co-IP) assay was performed to verify whether apelin regulated the binding of SREBP1 and Insig1. Overexpression of apelin markedly inhibited SREBP1 from combining with Insig1 in A549-OE and H1975-OE cells (Fig. 4a,4b). To the contrary, knockdown of apelin greatly increased the binding of SREBP1 to Insig1, and re-expression of apelin in H460-KD cells re-inhibited SREBP1-Insig1 binding (Fig. 4c).
Next, we investigated whether apelin inhibited SREBP1 from binding to Insig1 by direct interaction with SREBP1. Using apelin as a bait protein, the Co-IP result confirmed that binding of apelin to SREBP1 was increased in A549-OE and H1975-OE cells (Fig. 4d,e). Our results indicated that apelin promoted SREBP1 activity by dissociating SREBP1 with Insig1 to forming an apelin-SREBP1 complexes.
Apelin-HMGA1 Complexes Facilitates Lipid Metabolism and Lung Cancer Cell Proliferation
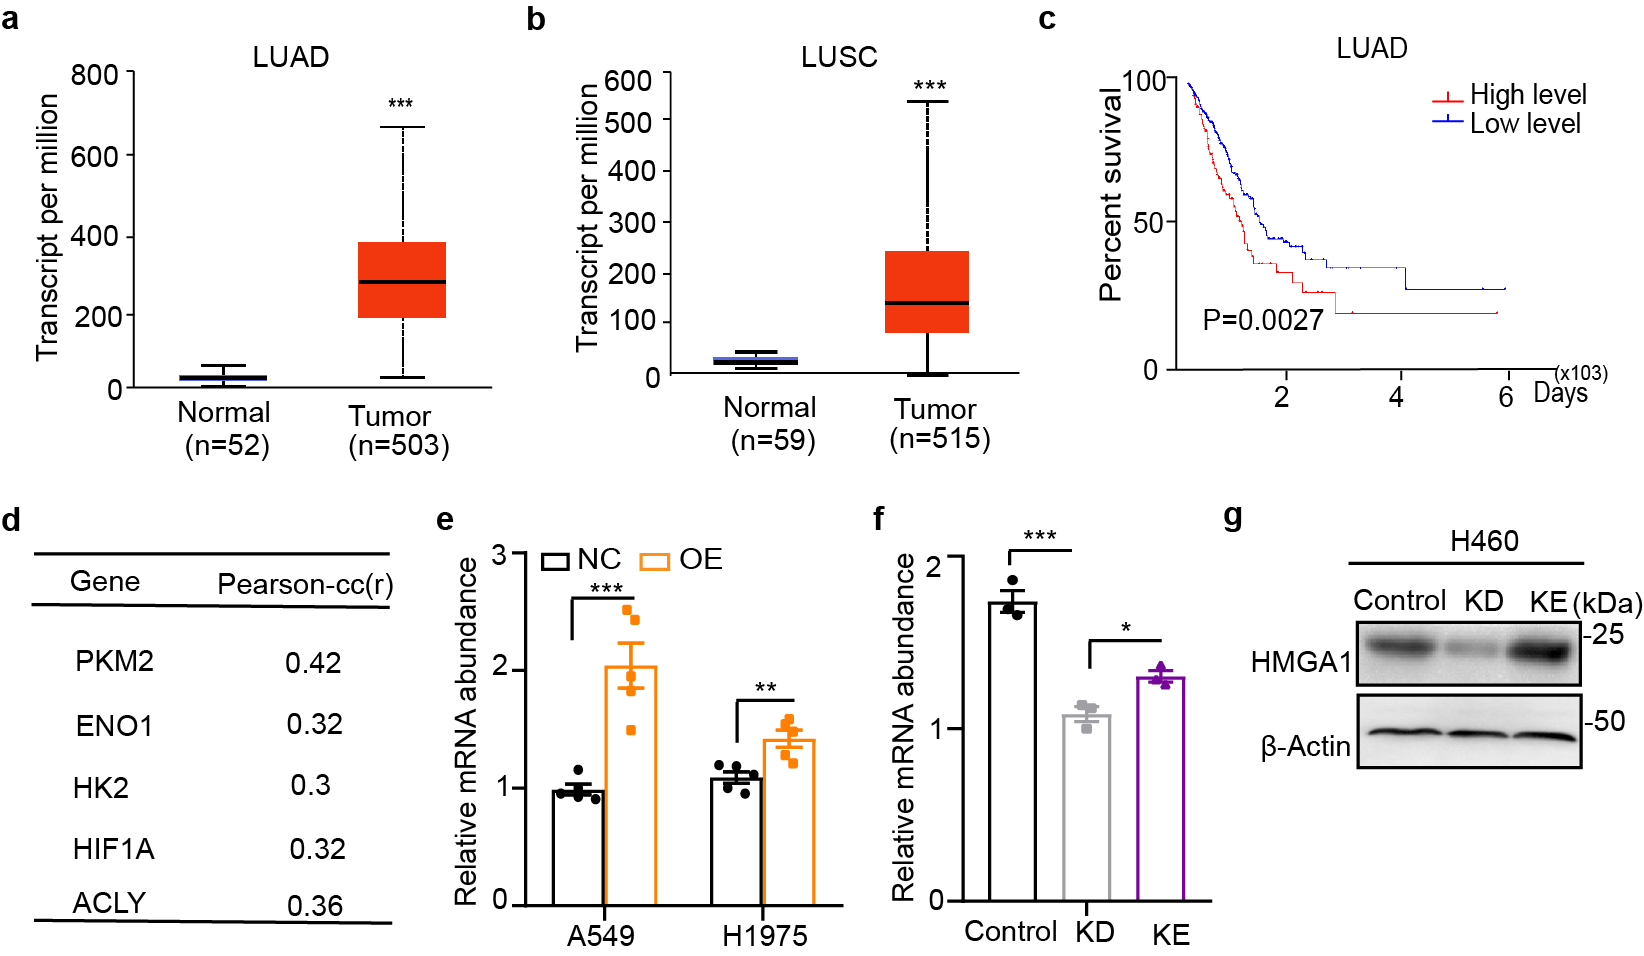
Several molecules contribute to metabolic reprograming in malignant tumors. High Mobility Group A1 (HMGA1) is an architectural transcription factor involved in regulating lipid metabolism by promoting GLUT3 expression27. Cancer Genome Atlas (TCGA) data analysis showed that expression of HMGA1 was substantially increased in tissues of patients with lung adenocarcinoma (LUAD) and squamous carcinoma (LUSC; Supplementary Fig. 3a,b). Furthermore, elevated HMGA1 concentrations were associated with poor prognosis in patients with LUAD (P=0.0027; Supplementary Fig. 3c) but not with survival in patients with LUSC (data not shown). In addition, Pearson correlation analysis revealed that HMGA1 concentration was related to multiple lipid synthesis-related genes (Supplementary Fig. 3d), which suggested the importance of HMGA1 in lipid metabolism. Therefore, we speculated that HMGA1 might be involved in apelin-mediated abnormal lipid synthesis.
We first observed that the expression of HMGA1 was increased in A549-OE and H1975-OE cells (Supplementary Fig. 3e and Fig. 5a) and decreased in H460-KO cells (Supplementary Fig. 3f,g). A Co-IP assay revealed increased binding of apelin to HMGA1 in A549-OE and H1975-OE cells (Fig. 5a). In addition, apelin and HMGA1 were co-localized in the nucleus of A549 -OE cells (Fig. 5b).
When HMGA1-siRNA was introduced to confirm this observation, we found that knockdown HMGA1 greatly inhibited cell viability (Fig. 5c) and colony formation in A549-OE and H1975-OE cells (Fig. 5d). Moreover, glucose uptake capacity and acetyl-CoA activity were also restrained in A549-OE and H1975-OE cell after si-HMGA1 treatment (Fig. 5e,f), as with the expression of lipid synthesis genes, including ACC1, SREBP1, and FASN (Fig. 5g).
The most interesting observation was that si-HMGA1 inhibited SREBP1 concentrations in both the mature (SREBP1-N) and precursor (SREBP1-P) forms in A549 -OE and H1975-OE cells (Fig. 5h), which suggested a close relationship between HMGA1 and SREBP1 in abnormal lipid metabolism induced by apelin. Finally, cholesterol - modified si-HMGA1 in the treatment of subcutaneous tumors in nude mice indicated that si-HMGA1 slightly reduced the tumor volume and weight of A549-OE engrafted mice (Fig. 5i,j). Oil red staining confirmed that lipid components also decreased more in si-HMGA1 tumor tissues than in A549-OE tissues (Fig. 5k). These results confirm that HMGA1 is important in apelin-mediated abnormal lipid metabolism in lung cancer cells.
Deamidated HMGA1 Increased the Binding of Apelin to HMGA1 and Increased the Activity of SREBP1
Our study confirmed that HMGA1 can increase abnormal lipid synthesis by forming an HMGA1-apelin complexes (Fig. 5a); however, the binding regions in HMGA1 and the regulation mechanism are unknown. Immunoprecipitation and mass spectrometry revealed that two fragments of the HMGA1 protein directly bind to apelin. We constructed three deficient mutant plasmids of HMGA1: delete 1 and delete 2 were deficient in the binding region of 30-47 and 92-107 respectively, and delete 3 was co-deficient in two binding fragments (Fig. 6a). The three described above deficient mutant plasmids of HMGA1(HMGA1-Del1, Del2, Del3), as well as HMGA1 full length control (HMGA1-FL/WT), were co-transfected into 293T cells. The results indicated that apelin interacted with wild-type HMGA1 (Fig. 6a and Supplementary Fig. 4a ), but this interaction was sharply reduced in HMGA1 deletes 1 and 3, but not in delete 2 (Fig. 6a), which indicated that fragment 30-47 was the region important in binding HMGA1 to apelin.
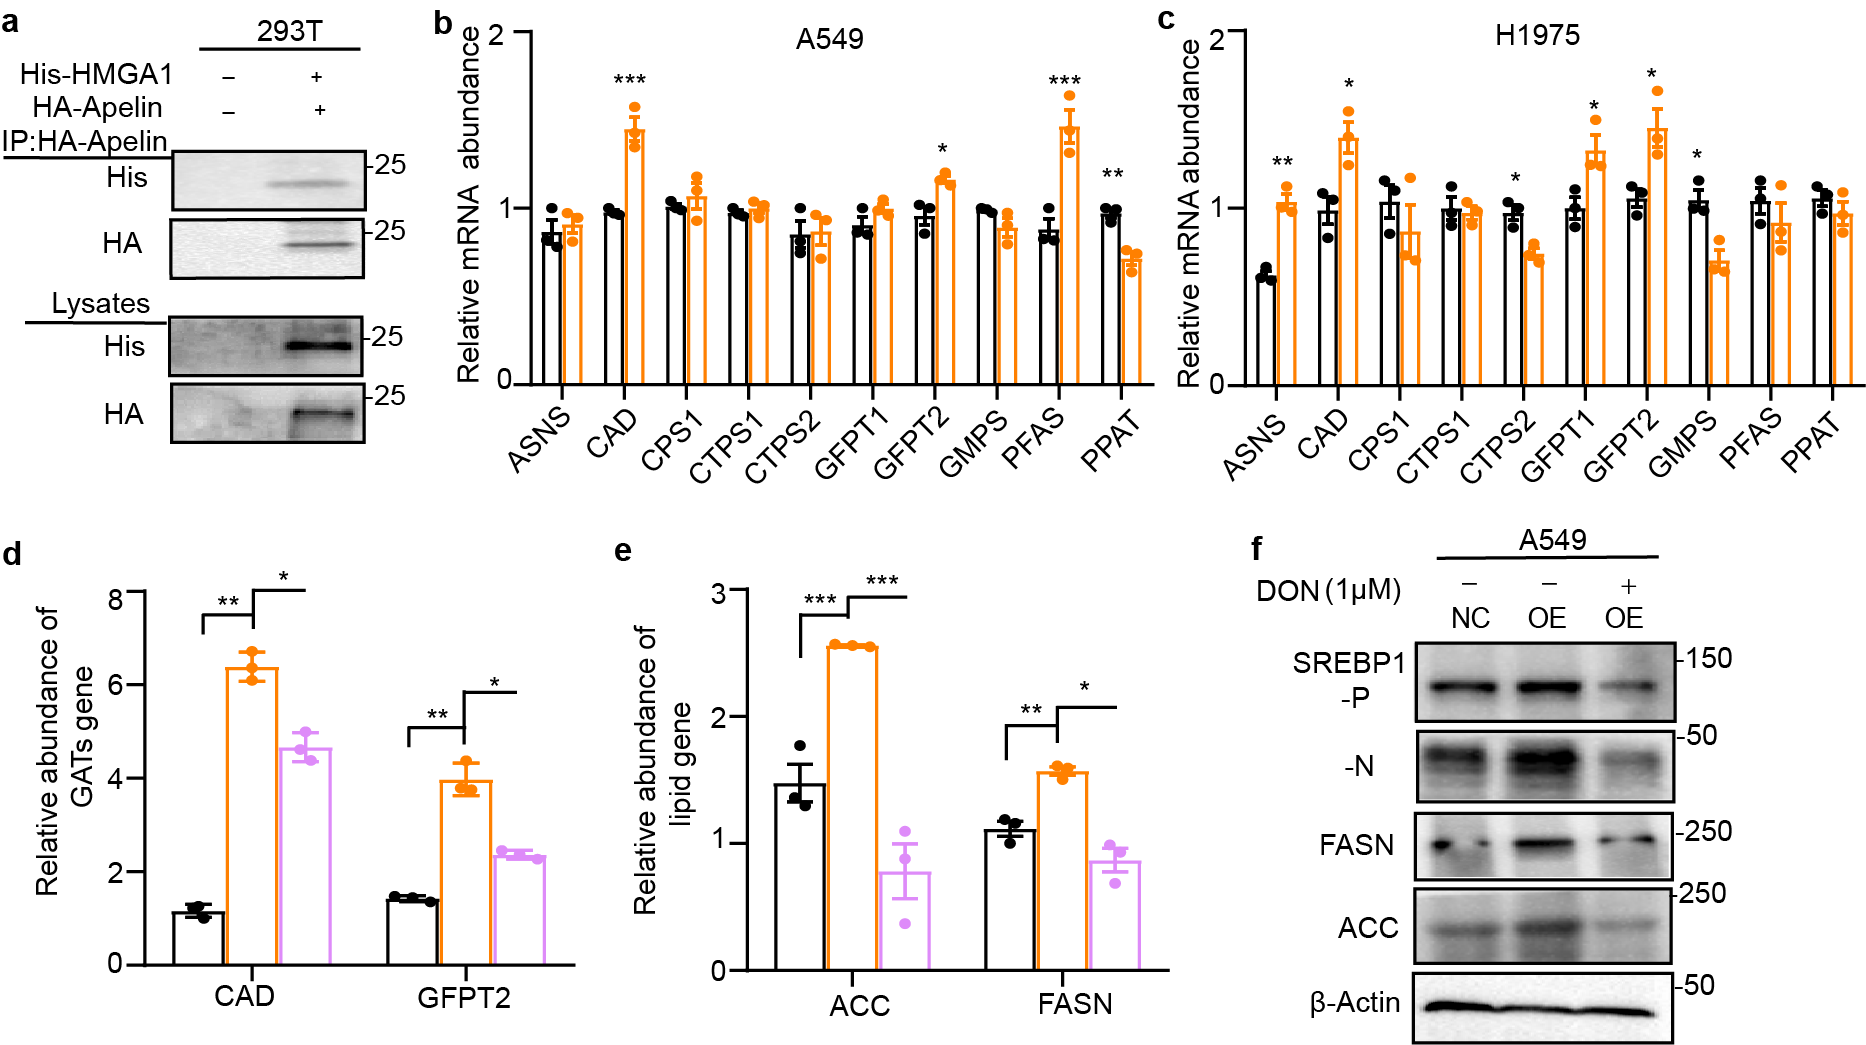
In this region, Glu 32 was an important site that had undergone deamidation of glutamine into glutamate (Fig. 6a). In addition, expressions of many glutamine amidotransferases increased in A549-OE and H1975-OE cells (Supplementary Fig. 4b,c), which suggested that apelin might increase the expression of glutamine amidotransferases, induce deamidation in HMGA1, and increase the binding of apelin to HMGA1.
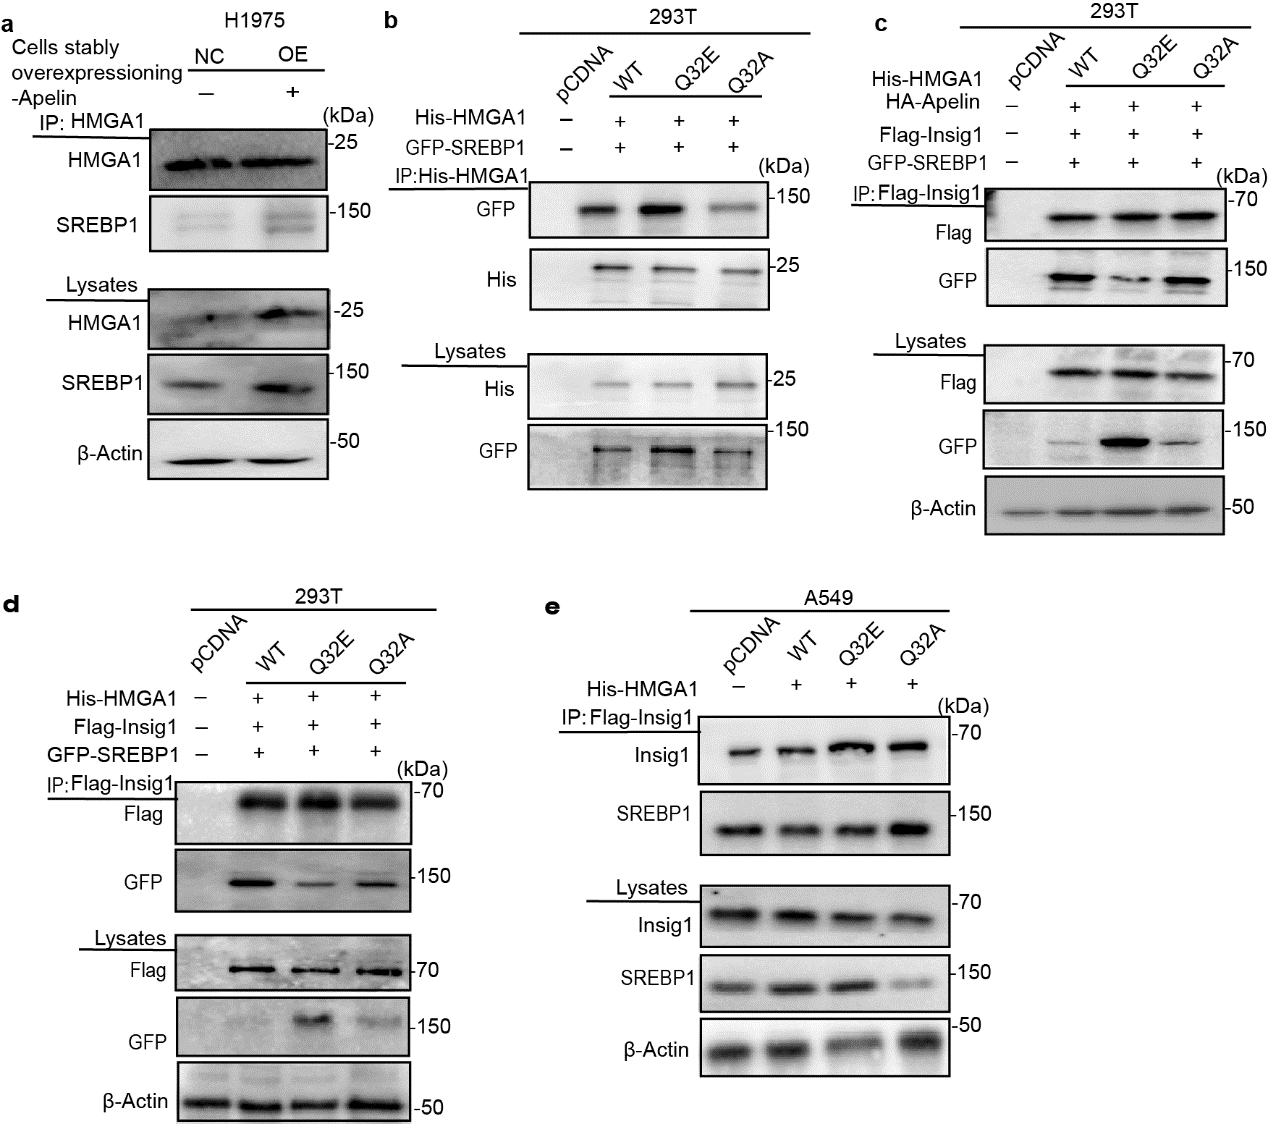
To confirm this hypothesis, glutamine amidotransferase inhibitor (DON) was used to investigate whether deamidation modification regulated the binding of HMGA1 to apelin. We found that DON reduced binding of apelin to HMGA1 (Fig. 6c). To confirm the importance of deamidation modification in apelin-HMGA1 interaction, two HMGA1 mutants, Q32E (glutamic acid, Glu) and Q32A (alanine, Ala), at a deamidation site resistant to deamidated were generated. Substituting Gln-32 with Glu, not Ala, increased binding of apelin to HMGA1 in both 293T (Fig. 6d) and A549-OE cells (Fig. 6e), showing that HMGA1 deamidation increased apelin-HMGA1 binding. Furthermore, we also found that HMGA1-WT and Q32E increased the viability of A549-OE cells compared with Q32A (Fig. 6f), as well as promoted mRNA expression of lipid metabolism genes (Fig. 6g). SREBP1 activity also was elevated in A549-OE and 293T cells with transfected HMGA1-WT and Q32E (Fig. 6h).
When we studied the effect of endogenous deamidation modification in lung cancer cells, we found that DON inhibited glutamine amidotransferases expression (Fig. 6i, Supplementary Fig. 4d) in A549-OE and H1975-OE cells and restrained apelin-HMGA1 interactions (Fig. 6j). DON treatment also reduced the expression of lipid-related genes in A549-OE and H1975-OE cells (Fig. 6k and Supplementary Fig. 4e,f). Finally, adding DON markedly restrained the viability of A549-OE cells (Fig. 6l). All these results indicated that deamidation modification of HMGA1 increased the binding affinity of apelin and HMGA1, subsequently activated SRBEP1, and promoted SREBP1-responsive lipogenesis.
Deamidated HMGA1 Promoted the Formation of Apelin-SREBP1-HMGA1 Complexes
We found that apelin can bind to SREBP1 and HMGA1 separately and that HMGA1 deamidation modification promoted the formation of an apelin-HMGA1 complexes and improved SREBP1 activity. However, whether HMGA1 directly interacts with SRBEP1 is unknown. Immunoprecipitation revealed that HMGA1 could interact with SREBP1 in A549-OE (Fig. 7a) and H1975-OE cells (Supplementary Fig. 5a), which indicated the formation of an apelin-SREBP1-HMGA1 complexes. Deamidated HMGA1 increased the activity of SREBP1, but whether it affected the binding of HMGA1 to SREBP1 was still unclear.
We found that si-HMGA1 and DON treatment increased the binding of SREBP1 to Insig1(Fig. 7b). Furthermore, si-HMGA1 and DON treatment both inhibited the formation of an apelin-SREBP1-HMGA1 complexes, then suppressed SREBP1 activity and the expression of lipogenic-related molecules (Fig. 7c,d). It illustrated that HMGA1 was essential for formation of multi-proteins complexes.
To further explore the relationship between apelin, HMGA1, and SREBP1, the 293T co-transfection experiment confirmed that apelin and HMGA1 both directly interact with SREBP1, while apelin can enhance the combination with HMGA1 and SREBP1(Fig. 7e). It was showed that apelin was key regulator to form of multiprotein complexes. To further confirmed whether deamidation modification promoted the formation of an apelin-HMGA1 -SREBP1complexes, it was showed multiprotein complexes was restrained in the presence of DON (Fig. 7f), like effect on A549-OE cell (Fig. 7c). The HMGA1-Q32E mutation increased the binding of SREBP1 to HMGA1(Fig.7g and Supplementary Fig. 5b) and dissociated SREBP1 from Insig1 in the presence or absence of apelin, whereas HMGA1-Q32A had no similar effect (Supplementary Fig. 5c,d), indicating that deamidation modification of HMGA1 competitively combined with SREBP1 and reduced the binding of Insig1 with SREBP1. We further confirmed that the HMGA1-Q32E mutation promoted the formation of an apelin-HMGA1-SREBP1 complexes both in lung cancer A549-NC and -OE cells, whereas Q32A had no effect (Fig. 7h). This phenomenon further illustrated that deamidated HMGA1 was essential for regulating the activity of SREBP1 and the interaction SREBP1 with Insig1. Deamidated HMGA1 acted independently to regulate the SREBP1 activity. Deamidation modification of HMGA1 also reduced Insig1-SREBP1 interaction in A549 cell (Supplementary Fig. 5e). Taken together, deamidation modification strongly enhanced the formation of an apelin-SREBP1-HMGA1 complexes and increased of SREBP1 activity.