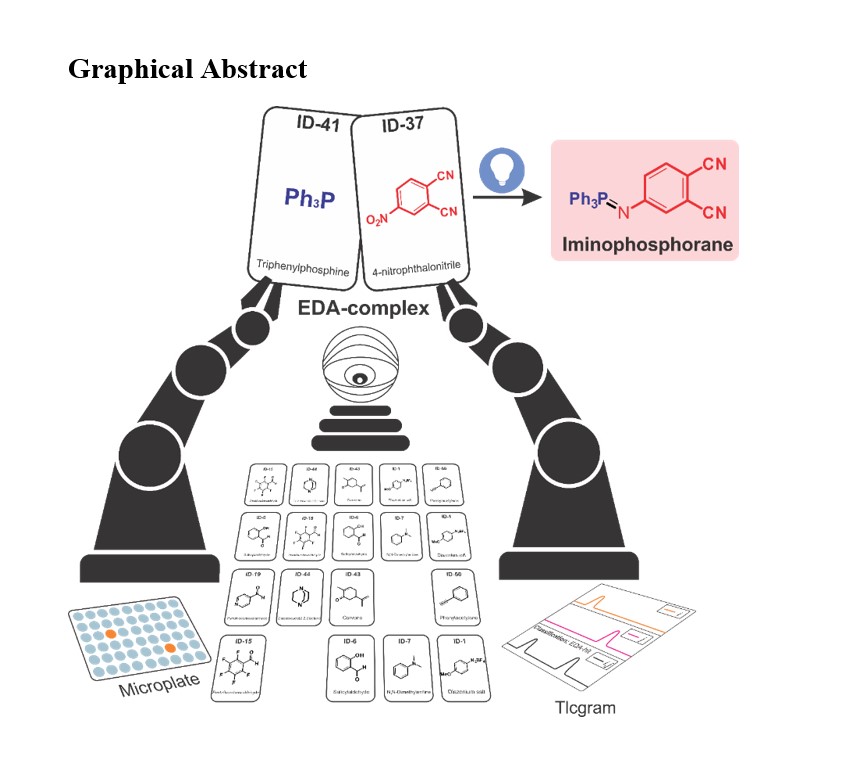
Herein, we report a multidimensional screening strategy for the discovery of EDA-complex photocatalyzed reactions using only photographic devices (webcam, cellphone) and TLC analysis. An algorithm was designed to identify automatically EDA-complex reactive mixtures in solution from digital image processing in a 96-wells microplate and by TLC-analysis. The code highlights the region of absorption of the mixture in the visible spectrum, and the quantity of the color change through grayscale values. Furthermore, the code identifies automatically the blurs on the TLC plate and classifies the mixture as colorimetric reactions, non-reactive or potentially reactive EDA mixtures. This strategy allowed us to discover and then optimize a new EDA-mediated approach for obtaining iminophosphoranes in up to 90% yield.
Article
Discovery of EDA-Complex Photocatalyzed Reactions Using Multidimensional Image Processing: Iminophosphorane Synthesis as a Case Study
https://doi.org/10.21203/rs.3.rs-955369/v1
This work is licensed under a CC BY 4.0 License
Version 1
posted
You are reading this latest preprint version
Complex molecules of biological interest are increasingly in more demand by the pharmaceutical industry, requiring efforts in the discovery of new chemical reactions or more efficient processes. The most notable example of obtaining complex molecules from simple substrates can be found in Nature in photosynthesis, which converts carbon dioxide and water into carbohydrates and oxygen.1 In this sense, photochemical reactions are an important tool for building molecules of biological interest, since they have the potential to access chemical transformations that would be unavailable through conventional ground-state pathways.
Over the last few decades, great efforts have been invested in the development of methodologies and mechanistic investigations of photoredox catalysis using metal- and organic-photocatalysts.2 In particular cases, researchers have observed serendipitous photocatalytic reactivities in the absence of a photocatalyst (control experiment), even for substrates that are transparent at the range of excitation wavelengths. The researchers suggested that the reactions were performed through the formation of photoactive aggregates, called electron donor-acceptor (EDA) complexes. These EDA complexes are formed by the weak and reversible association between electron-rich and electron-poor compounds in the ground state.2–5 A common aspect of these complexes is the appearance of a colored solution and a red-shifting band in the UV-Vis spectroscopy experiment.6 Recently, the synthetic community has recognized the potential of this photochemical approach, mainly for dispensing the use of exogenous photoredox catalysts6. Examples of the synthetic potential of this approach include hetero-arene arylations,4,5,7–9 α-alkylation of aldehydes,10 hydrotrifluoromethylation of unsaturated β-keto esters,11 hydroalkylation of 1,7-enynes12 and other chemical transformations.6
Similar to the discovery of the EDA complex-mediated reactions, many other important chemical reactions have also been discovered serendipitously, such as the Friedel-Crafts and Wittig reactions.13,14 To supply the high demand for new synthetic methodologies and speed up the serendipitous outcome, screening strategies have been developed to rationalize and accelerate the process of discovery of new chemical reactions or synthetic methodologies using high-throughput experimentation (HTE).15–17 These strategies may employ reaction- and/or mechanism-based screening methods such as the formation of new products (or the consumption of substrates) in the crude mixture, and/or evaluating the key-step of a particular reaction, such as the fluorescence quenching of a photocatalyst.18
Screening methodologies for photoinduced reactions have been developed specifically for discovering photocatalyst-mediated reactions. MacMillan's group reported an iridium complex-photocatalyzed α-amino C–H arylation reaction using an automated system for mixing of the reactants and analyses of reaction mixtures after irradiation.16 Subsequently, Glorius's group discovered two iridium complex photocatalyzed energy transfer-based cycloaddition reactions combining reaction- and mechanism-mediated screening methods in a two-dimensional approach19. The first dimension sought efficient fluorescence quenchers for the selected photocatalyst (mechanism-based screening) and the second the formation of new chemical products (reaction-based screening) after irradiation.
Overall, many reaction screening strategies have been developed in the last two decades. However, as well-observed by Hartwig,17 although all experimental design has merit, few have been used by laboratories beyond those which disclosed the original studies. Undoubtedly, robotic platforms have allowed reproducibility and speed mainly in HTE, but nowadays their employment is limited and not cost-competitive. The analytical structure required for some strategies also has hampered their adoption in organic synthesis laboratories due to the full-time lack of equipments such as fluorescence,18,19 nuclear magnetic resonance spectroscopies,20 cyclic voltammetry,21 and mass spectrometry.22 Although most strategies have been developed using GC-MS,16,17 which is relatively common in organic laboratories, sequential analysis of each reaction mixture takes time, which can make the adopted strategy unfeasible. Thus, we decided to invest efforts in the development of a screening strategy for quickly identifying EDA complex-mediated reactions using materials and equipment readily available in any organic synthesis laboratory and at a suitable cost.
Initially, we aimed at identifying specific features of EDA complexes in reaction mixtures (mechanism-based screening). As mentioned above, EDA complexes present a new absorption band in UV-Visible spectroscopy, which can then be used to identify them in solution. Although multi-analysis UV-Vis spectrometers are available, their costs are still high. Other devices for single analysis are inexpensive and relatively common in organic synthesis laboratories, however, time-consuming sequential analyses (one by one) would be impractical for screening methodologies. The appearance of colored solutions after the mixture of colorless substrates in the visible region is another feature of EDA complexes. Human perception of color change is limited and subjective, however, these factors can be eliminated by the suitable manipulation of a simple digital image.23,24 An ordinary 8-bit RGB color digital image has more than 16 million possible colors and computer vision, which is the image data manipulation through an algorithm, has been successfully applied in several areas such as medical diagnosis, traffic control, facial recognition, autonomous cars, and others.25,26
We hypothesized that digital image processing would be a sensitive and objective tool to identify color change in a reaction mixture. Using multi-well microplates to evaluate the color change of several mixtures, the method would be able to classify them in a single analysis. Although colorimetric reactions also cause a color change of the mixture by the formation of chemical products, the color change observed for EDA complexes is due to the interaction between substrates without the formation of chemical products. Thus, employing analytical methods that identify products formation or the substrate consumption in a colored mixture could segregate the “EDA-hit” from colorimetric reactions (reaction-based screening).27 In this study, we have explored EDA complex-mediated reactions, where the substrates (electron donor and acceptor) are mixed and submitted to visible-light irradiation to undergo chemical transformations.5,6,8 Other approaches, which use sacrificial electron donor- or acceptor-species for EDA complex formation, and subsequent trapping of the target radical with a third substrate,7,11 were not covered in this study. The analysis of new products after visible-light irradiation of the “EDA-hit” solutions could select potential EDA complex-promoted reactions (reaction-based screening).
As mentioned before, the analysis of the crude mixture by GC-MS, mainly in sequential injections is time-demanding. We hypothesized that a simple analysis of the crude mixture by thin-layer chromatography (TLC) would be adequate for our proposal since TLC can deliver multiple and simultaneous analyses, and is available in any organic synthesis laboratory. Furthermore, a TLC-analysis automatic system that classifies quickly the mixture as reactive or non-reactive would speed up the screening processes and avoid possible human errors during the handling and classification of various TLC plates.
Therefore, we proposed a three-dimensional screening strategy, which would use a digital image processing method in the first dimension to identify color change of mixtures (mechanism-based screening) and two TLC analyses of the crude reaction mixture in the other two dimensions to identify the formation of products (reaction-based screening). The second dimension would segregate the “EDA-hit” from colorimetric reactions and the third dimension would select the potential new EDA complexes-promoted reactions after irradiation of an EDA-hit (Figure 1). A code was written in Python 3 using IDE PyCharm and the OpenCV library for both data management and microplate- and TLC-image processing.
Substrate selection
The 50 substrates, where 4 (pyridine, 4-methoxybenzenediazonium tetrafluoroborate, Umemoto’s reagent, and N,N-dimethylaniline) were intentionally added as a positive control,5,11 were selected by a randomized computer driven manner from our organic compounds laboratory stockroom list (details shown in the SI). Although the formation of EDA complexes requires two groups of compounds, one electron-donor and other electron-acceptor, this substrate separation was not considered during the choice of compounds. The substrates were mixed in pairs (50 µmol of each substrate in 200 µL of acetonitrile), totalizing 1225 mixtures. Inorganic and organometallic compounds were excluded, and poorly soluble compounds were sonicated for 5 minutes and filtered before use.
Microplate Digital Image Processing-based screening (first dimension)
The first dimension has the purpose of identifying mixtures that cause a change of color using digital image processing methods and an algorithm to make decisions. Image processing begins with the capture of an image in a suitable acquisition system.26 The illumination, focus, distance, and position between the camera and the sample were the main parameters considered to build the acquisition system. A homemade MDF (medium density fiberboard) box coated by a white laminated board was equipped with white-LED tapes on internal walls, and a sample holder was built for the image acquisitions (details of the box building are shown in the SI). A camera of 8 megapixels resolution was used for the digital image acquisition. The substrates were mixed in a transparent 96-well microplate, whose cover was crucial to identify the wells by our algorithm (see SI).
The RGB color system was inspired by the three types of cones cells of human vision, whose maximum sensitivities are at 575 nm (red), 535 nm (green), and 445 nm (blue).28 Slicing a color image into its respective channels R, G, and B infers the electromagnetic spectrum region that the image absorbs. An RGB color image from our microplate experiment, which contained both mixtures 1 and 2 (Figure 2a), showed that all channels (R, G, B) detected the mixture-2 while only the blue channel detected the mixture-1. These results are consistent and validated with the absorption spectra (UV-Vis) acquired for both mixtures. Mixture-1 showed a strong band absorption between 400 and 475 nm, and mixture-2 showed several absorption bands across the entire range of the visible region (Figure 2b).
The conversion of a color image to grayscale is a common approach in different tasks carried out by digital image processing, of which one is quantitative visualization.26 After slicing the color image for the channels B, G, R, each channel was converted into inverted grayscale to produce dark backgrounds (Figure 2a).29 The measure of the absorption intensity of each well of the microplate was performed in the grayscale (Figure 2d). The color change was determined by the subtraction of the average grayscale value from the mixture-well by the average of the highest grayscale value of the substrates-well (j-well, Figure 2e). The mixture was considered colored if the result is higher than the established criterium for the Color Change Threshold (CCT) (Equation 1).
$$\sum _{B,G,R}\stackrel{-}{{GS}_{i,j}}-\sum _{B,G,R}\stackrel{-}{{GS}_{j}}\ge CCT$$
1
where,
\(\sum _{B,G,R}\stackrel{-}{{GS}_{i,j}}\) : sum of grayscale values average of the mixture i,j in the BGR channels;
\(\sum _{B,G,R}\stackrel{-}{{GS}_{j}}\) : sum of highest grayscale values average of the substrate j in the BGR channels;
CCT: Color Change Threshold;
Different factors can influence a quantitative analysis such as illumination, light scattering, refraction, and others.26 The CCT value was established empirically using 208 mixtures, whose grayscale values were up to 40, together with their respective spectroscopic absorbance data. The false-positive percentage was inversely proportional to the grayscale values, indicating that the method increases its sensitivity for darker mixtures (Figure 2c). We established that a maximum error of up to 20% would be adequate for this method. Thus, we adopted the grayscale value of 20 as the cut-off for the CCT. Colored images with grayscale values of up to 20 are still difficult for human eye perception, suggesting that even slightly colored mixtures can be detected by this method.
The code automatically recognizes the microplate wells, identifies the absorbance region of a colored mixture, measures the grayscale values, and classifies a mixture as colored or colorless, following the established criterium for CCT (operation details of the code are described in the SI).
TLC-based screening (second and third dimensions)
TLC is an analytical method commonly used by organic chemists in their laboratory routine to determine the purity of a sample, follow the progress of a reaction, or the purification of a mixture. In the last two decades, advanced applications have been developed in TLC analysis,30–32 including TLC coupled to mass spectrometry33 and digital image processing for the quantitative determination of the reaction yield.34,35 The great advantage of this method is its availability in organic laboratories and the ability to carry out multi-analysis simultaneously. However, many organic compounds, depending on the revelation method, may not be detectable.
The detection method for common TLC (sensitized F254 plates) and UV-lamp detection (emission at 254 nm to 6 W) was more suitable for our proposal. An image box with a black background sample holder, which was required to improve the contrast of the TLC, was built for the image acquisitions (details of the construction are shown in the SI). The code recognizes the TLC from digital images and extracts the blurs of each dot for a graphical representation, which we call “tlcgram”. Thus, the algorithm classifies the mixture as reactive or non-reactive by comparison of both, substrates- and mixture-tlcgram, respectively (details of the operation of this code are shown in the SI).
The mixtures are classified following the adopted criteria (details are shown in the SI). Colorless mixtures are classified when the grayscale value is less than 20, and for grayscale values greater than or equal to 20, the mixtures are classified as colored. The colored mixtures that show some reactivity, by TLC screening, before irradiation are classified as colorimetric reactions. The colored mixtures that do not show any reactivity before and after irradiation are classified as an EDA-hit, and finally, the colored mixtures that do not show any reactivity before irradiation, but present evidence of reaction after irradiation are classified as EDA-mediated reactions (EDA-reaction).
The TLC-mediated screening was validated using gas chromatography coupled to mass spectrometry (GC-MS). We randomly selected 75 colored mixtures, of which 29 have been classified, by the TLC manual classification method, as colorimetric reactions and 46 as EDA-hit. The GC-MS analysis did not identify chemical products for 4 mixtures classified as colorimetric reactions and identified chemical products for 5 mixtures classified as EDA-hit, resulting in an error of 13.8% and 10.9%, respectively. In general, the TLC method showed a classification error of 12.0%, an error that we considered satisfactory due to the simplicity, availability, low cost, and ability of the TLC method to carry out multicomponent analysis simultaneously. Furthermore, the automatic classification method showed a high agreement index (96%, n = 109) compared to the classification made by an organic chemist.
The EDA-hit mixtures were irradiated with blue LED (10 W) for 3 h at 25 ºC in a homemade 12-wells photoreactor (details of the photoreactor are shown in SI). Subsequently, a new TLC-mediated screening was performed. Thus, the EDA-hit mixture that promotes the formation of chemical products, after irradiation, would be a possible EDA-photoinduced reaction.
EDA Chemical Space
The microplate digital imaging processing-based screening classified 108 mixtures (8.9% from 1225 mixtures) as colored (CCT > 20). From these mixtures, the TLC-mediated screening (second dimension) classified 61 as EDA-hit (5.0% from 1225 mixtures – 56.5% from 108 colored mixtures) and 47 as colorimetric reactions. After irradiation of the EDA-hit mixtures, a new TLC-mediated screening (third dimension) was performed. Chemical products were observed in 33 mixtures (2.7% from 1225 mixtures – 54.1% from 61 EDA-hit mixtures), which were classified as possible EDA-photoinduced reactions (Figure 3). These data show us that the chemical space of these reactions is increased by 2.7% by visible-light irradiation, which can include EDA-induced reactions and other photoinduced transformations.
Both the reactions which were intentionally added to the study as a positive control were successfully identified by this screening method. The mixtures between pyridine (ID-36) and the diazonium salt (ID-1), and between Umemoto’s reagent (ID-4) and N,N-dimethylaniline (ID-7) were classified as EDA-reactions. The mixture between 4-nitro-phthalonitrile (ID-37) and triphenylphosphine (ID-41) showed a grayscale value of 38 and a red-shift band in the UV-Vis spectrum before irradiation, and the TLC-mediated screening (performed before and after irradiation) classified the mixture as a possible EDA-photoinduced reaction. This reaction between ID-37 and ID-41 also called our attention because of the complete consumption of triphenylphosphine after irradiation and the formation of a single product (details are shown in the SI).
The isolated product was characterized as iminophosphorane (51a) (Figure 4a), which is an important organic function in synthetic chemistry, mainly in C-N bond formation reactions, such as observed for isocyanates and isothiocyanates, carbodiimides, aziridines, imines by aza-Wittig reactions, and also amines by Staudinger’s reduction (Figure 4b, Equation a-e). In general, iminophosphoranes are obtained by Staudinger’s method, which involves the reaction between aromatic azides and trivalent phosphorous compounds.36 Other methods can also be employed including the use of halogenating37 or oxidizing agents,38,39 alkylation of aminophosphoranes,40 and condensation of N-aryl 2-nitrosoanilines41 or 2-nitroadiarylamines (Figure 4b, Equation f-j).42,43
The transformation of nitroarenes into iminophosphoranes via thermal conditions has been extensively studied by Wróbel’s group.43 A mixture of nitroarenes with an excess of triphenylphosphine (5-10 equivalents) at high temperatures (150-220 °C) produced the corresponding iminophosphorane in 27-97% yields after up to 12 h of stirring. Therefore, the discovery that we present in this study is remarkable as it can be performed in mild and photocatalyzed conditions, increasing the options for iminophosphorane synthesis. Up to the limit of our knowledge, there are no reports in the literature on the formation of iminophosphoranes by photocatalysis. Thus, we decided to invest efforts in the development of this photocatalyzed conversion by an EDA approach (details of the screening conditions are described in the SI).
After a brief screening study of reaction conditions (see SI), the synthesis of (51a) was optimized and this product was isolated in 82% yield using a mixture of 4-nitrophthalonitrile (0.5 mmol) with 4 equivalents of triphenylphosphine in CH2Cl2 (0.10 M). The optimal reaction time was 48 h and the irradiation was performed with blue-LED light (120 W) at -20 °C (see SI). A small library of iminophosphoranes was obtained from the reaction of triphenylphosphine with electron-deficient nitroarenes (Table 1) evidencing the potential of this synthetic protocol and ratifying the power of our screening methodology to discover new photocatalyzed transformations in a simple and accessible manner.
Table 1: Iminophosphorane library obtained by the EDA protocol

Reaction conditions: nitroarenes (0.5 mmol) and triphenylphosphine (2.0 mmol) in CH2Cl2 (5 mL, 0.10 M) at -20 ºC, irradiated with blue LED (120 W) for 48 hours. Isolated yields after chromatographic column. (*) with 4.0 mmol of triphenylphosphine.
In summary, we have demonstrated that the adoption of digital image processing combined with TLC analysis can be used for the discovery of new methodologies for EDA-mediated chemical transformations using a multi-dimensional approach. An algorithm was written to automatically identify colored mixtures from digital image processing in 96-wells microplates with an error lower than 20%. The code highlights the region of absorption of the mixtures in the electromagnetic spectrum and the quantification of the color changes through grayscale values. The colored mixtures were selected for two reaction-based screening, which was performed before and after visible-light irradiation, using a simple and efficient TLC analysis (error of 12% with respect to GC-MS analysis, which was the validation method). A TLC-analysis system was also developed to automatically recognize the TLC plate, the blurs of each dot analysis and classifies the mixture into colorimetric reactions and unreactive or reactive potential EDA mixtures (EDA-reaction). By this strategy, we identified that 5.0% of 1225 mixtures were EDA-hit, of which 57% were reactive (EDA-reaction) after visible-light irradiation. The investigation of one particular EDA reaction allows us to disclose a new EDA-mediated methodology for obtaining iminophosphoranes in up to 90% yield.
Code availability
The data and code can be found at https://github.com/LQBO/Discovery_EDA
Acknowledgments
Financial support was provided by the São Paulo Research Foundation - FAPESP - (grant numbers: 2019/27176-8, 2020/06874-6; fellowship 2018/00879-6) as well as the Conselho Nacional de Pesquisa - CNPq (Grant 407990/2018-6 and K.T.O. research fellowship 303890/2019-3), and the Coordenação de Aperfeiçoamento de Pessoal de Nível Superior – Brasil (CAPES) – Financial Code 001.
Author Contributions
R.C.S., K.T.O. and T.J.B. conceived the project. R.C.S performed all experiments and computational codes. G.M.F.B helped with key discussions during the project. All authors contributed to the experimental design, the interpretation of data, and wrote the manuscript.
Competing Interests
The authors declare no competing interests.
- Marzo, L., Pagire, S. K., Reiser, O. & König, B. Visible-Light Photocatalysis: Does It Make a Difference in Organic Synthesis? Angew. Chem., Int. Ed. 57, 10034–10072 (2018).
- Romero, N. A. & Nicewicz, D. A. Organic Photoredox Catalysis. Chem. Rev. 116, 10075–10166 (2016).
- Lima, C. G. S., de M. Lima, T., Duarte, M., Jurberg, I. D. & Paixão, M. W. Organic Synthesis Enabled by Light-Irradiation of EDA Complexes: Theoretical Background and Synthetic Applications. ACS Catal. 6, 1389–1407 (2016).
- Marzo, L., Wang, S. & König, B. Visible-Light-Mediated Radical Arylation of Anilines with Acceptor-Substituted (Hetero)aryl Halides. Org. Lett. 19, 5976–5979 (2017).
- Bartolomeu, A. D. A., Silva, R. C., Brocksom, T. J., Noël, T. & de Oliveira, K. T. Photoarylation of Pyridines Using Aryldiazonium Salts and Visible Light: An EDA Approach. J. Org. Chem. 84, 10459–10471 (2019).
- Crisenza, G. E. M., Mazzarella, D. & Melchiorre, P. Synthetic Methods Driven by the Photoactivity of Electron Donor–Acceptor Complexes. J. Am. Chem. Soc. 142, 5461–5476 (2020).
- Lee, J., Hong, B. & Lee, A. Visible-Light-Promoted, Catalyst-Free Gomberg–Bachmann Reaction: Synthesis of Biaryls. J. Org. Chem. 84, 9297–9306 (2019).
- Silva, R. C., Villela, L. F., Brocksom, T. J. & de Oliveira, K. T. Direct C–H photoarylation of diazines using aryldiazonium salts and visible-light. RSC Adv. 10, 31115–31122 (2020).
- Tobisu, M., Furukawa, T. & Chatani, N. Visible Light-mediated Direct Arylation of Arenes and Heteroarenes Using Diaryliodonium Salts in the Presence and Absence of a Photocatalyst. Chem. Lett. 42, 1203–1205 (2013).
- Arceo, E., Jurberg, I. D., Álvarez-Fernández, A. & Melchiorre, P. Photochemical activity of a key donor–acceptor complex can drive stereoselective catalytic α-alkylation of aldehydes. Nat. Chem. 5, 750–756 (2013).
- Batista, G. M. F., de Castro, P. P., Dos Santos, H. F., de Oliveira, K. T. & Amarante, G. W. Electron-Donor–Acceptor Complex-Enabled Flow Methodology for the Hydrotrifluoromethylation of Unsaturated β-Keto Esters. Org. Lett. 22, 8598–8602 (2020).
- Correia, J. T. M. et al. Metal-Free Photoinduced Hydroalkylation Cascade Enabled by an Electron-Donor–Acceptor Complex. J. Org. Chem. 85, 9820–9834 (2020).
- Hopf, H. Serendipity: Accidental Discoveries in Science. Von R. M. Roberts. John Wiley, New York 1989. XVIII, 270 S., Broschur $ 12.95. — ISBN 0-471-60203-5. Angew. Chemie 102, 1210–1211 (1990).
- Eleuterio, H. S. Olefin metathesis: chance favors those minds that are best prepared. J. Mol. Catal. 65, 55–61 (1991).
- Collins, K. D., Gensch, T. & Glorius, F. Contemporary screening approaches to reaction discovery and development. Nat. Chem. 6, 859–871 (2014).
- McNally, A., Prier, C. K. & MacMillan, D. W. C. Discovery of an -Amino C-H Arylation Reaction Using the Strategy of Accelerated Serendipity. Science (80-.). 334, 1114–1117 (2011).
- Robbins, D. W. & Hartwig, J. F. A Simple, Multidimensional Approach to High-Throughput Discovery of Catalytic Reactions. Science (80-.). 333, 1423–1427 (2011).
- Hopkinson, M. N., Gómez-Suárez, A., Teders, M., Sahoo, B. & Glorius, F. Accelerated Discovery in Photocatalysis using a Mechanism-Based Screening Method. Angew. Chem., Int. Ed. 55, 4361–4366 (2016).
- Strieth-Kalthoff, F. et al. Discovery of Unforeseen Energy-Transfer-Based Transformations Using a Combined Screening Approach. Chem 5, 2183–2194 (2019).
- Granda, J. M., Donina, L., Dragone, V., Long, D.-L. & Cronin, L. Controlling an organic synthesis robot with machine learning to search for new reactivity. Nature 559, 377–381 (2018).
- Liedtke, T., Spannring, P., Riccardi, L. & Gansäuer, A. Mechanism-Based Condition Screening for Sustainable Catalysis in Single-Electron Steps by Cyclic Voltammetry. Angew. Chem., Int. Ed. 57, 5006–5010 (2018).
- Markert, C. & Pfaltz, A. Screening of Chiral Catalysts and Catalyst Mixtures by Mass Spectrometric Monitoring of Catalytic Intermediates. Angew. Chem., Int. Ed. 43, 2498–2500 (2004).
- Buzzetti, L., Crisenza, G. E. M. & Melchiorre, P. Mechanistic Studies in Photocatalysis. Angew. Chem., Int. Ed. 58, 3730–3747 (2019).
- Merkel, D. et al. Comparison Between Various Color Spectra and Conventional Grayscale Imaging for Detection of Parenchymal Liver Lesions With B-Mode Sonography. J. Ultrasound Med. 34, 1529–1534 (2015).
- Burger, W. & Burge, M. J. Principles of Digital Image Processing. Design (Springer London, 2009). doi:10.1007/978-1-84800-191-6
- Jähne, B. Digital Image Processing, 5th revised and extended edition. Meas. Sci. Technol. 13, 711 (2002).
- Woolf, M. S., Dignan, L. M., Scott, A. T. & Landers, J. P. Digital postprocessing and image segmentation for objective analysis of colorimetric reactions. Nat. Protoc. 16, 218–238 (2021).
- Hunt, R. W. G. The Reproduction of Colour. Color Research & Application 30, (John Wiley & Sons, Ltd, 2004).
- Zaidi, M., Fu, F., Cojocari, D., McKee, T. D. & Wouters, B. G. Quantitative Visualization of Hypoxia and Proliferation Gradients Within Histological Tissue Sections. Front. Bioeng. Biotechnol. 7, 1–9 (2019).
- Ferenczi-Fodor, K., Végh, Z. & Renger, B. Thin-layer chromatography in testing the purity of pharmaceuticals. TrAC Trends Anal. Chem. 25, 778–789 (2006).
- Attimarad, M., Mueen Ahmed, K. K., Aldhubaib, B. E. & Harsha, S. High-performance thin layer chromatography: A powerful analytical technique in pharmaceutical drug discovery. Pharm. Methods 2, 71–75 (2011).
- Lancaster, M., Goodall, D. M., Bergström, E. T., McCrossen, S. & Myers, P. Real-Time Image Acquisition for Absorbance Detection and Quantification in Thin-Layer Chromatography. Anal. Chem. 78, 905–911 (2006).
- Morlock, G. & Schwack, W. Coupling of planar chromatography to mass spectrometry. TrAC Trends Anal. Chem. 29, 1157–1171 (2010).
- Boulgakov, A. A. et al. Next-Generation TLC: A Quantitative Platform for Parallel Spotting and Imaging. J. Org. Chem. 85, 9447–9453 (2020).
- Jo, H. H., Gao, X., You, L., Anslyn, E. V. & Krische, M. J. Application of a high-throughput enantiomeric excess optical assay involving a dynamic covalent assembly: parallel asymmetric allylation and ee sensing of homoallylic alcohols. Chem. Sci. 6, 6747–6753 (2015).
- Leffler, J. E. & Temple, R. D. Staudinger reaction between triarylphosphines and azides. Mechanism. J. Am. Chem. Soc. 89, 5235–5246 (1967).
- Omran, O. A., Sayed, S. M. & Raslan, M. A. Iminophosphoranes in Heterocyclic Synthesis: A Facile Synthesis of Pyrido[4,3- D ]Pyrimidine and Pyrido[4,3- D ][1,3]Oxazine Derivatives via Intermolecular aza-Wittig Reactions. J. Heterocycl. Chem. 54, 1103–1108 (2017).
- Yavari, I., Adib, M. & Hojabri, L. Vinyltriphenylphosphonium salt mediated serendipitous synthesis of aryliminophosphoranes. Tetrahedron 58, 7213–7219 (2002).
- Adib, M., Sheikhi, E. & Deljoush, A. Reaction between triphenylphosphine and aromatic amines in the presence of diethyl azodicarboxylate: an efficient synthesis of aryliminophosphoranes under neutral and mild conditions. Tetrahedron 67, 4137–4140 (2011).
- Ciganek, E. Iminophosphoranes from the reaction of ylides with nitriles. J. Org. Chem. 35, 3631–3636 (1970).
- Łukasik, E. & Wróbel, Z. Simple Synthesis of 2-Aminoaryliminophosphoranes from N-Aryl-2-nitrosoanilines and Their Application in 2-Aminobenzimidazole Synthesis. Synlett 25, 217–220 (2013).
- Łukasik, E. & Wróbel, Z. 2-(Arylamino)aryliminophosphoranes from 2-nitrodiarylamines. Heteroat. Chem. 27, 372–380 (2016).
- Tryniszewski, M. et al. Direct Reductive Cyclocondensation of the Nitro Group with the Amido Group: Key Role of the Iminophosphorane Intermediate in the Synthesis of 1,4-Dibenzodiazepine Derivatives. J. Org. Chem. 84, 2277–2286 (2019).
There is NO Competing Interest.
- GraphicalAbstract.jpg
- SupportingInformationNatChem04102021.docx
supporting information for the manuscript Discovery of EDA-Complex Photocatalyzed Reactions Using Multidimensional Image Processing: Iminophosphorane Synthesis as a Case Study