Data acquisition and processing: The BRCA project of the TCGA (TCGA_BRCA) dataset, METABRIC data, and GSE42568 dataset were acquired from the GDC hub of the UCSC Xena website (http://xena.ucsc.edu/public) and the Gene Expression Omnibus (GEO) database (https://www.ncbi.nlm.nih.gov/gds/), respectively. Data were processed as described in our previous study [25].
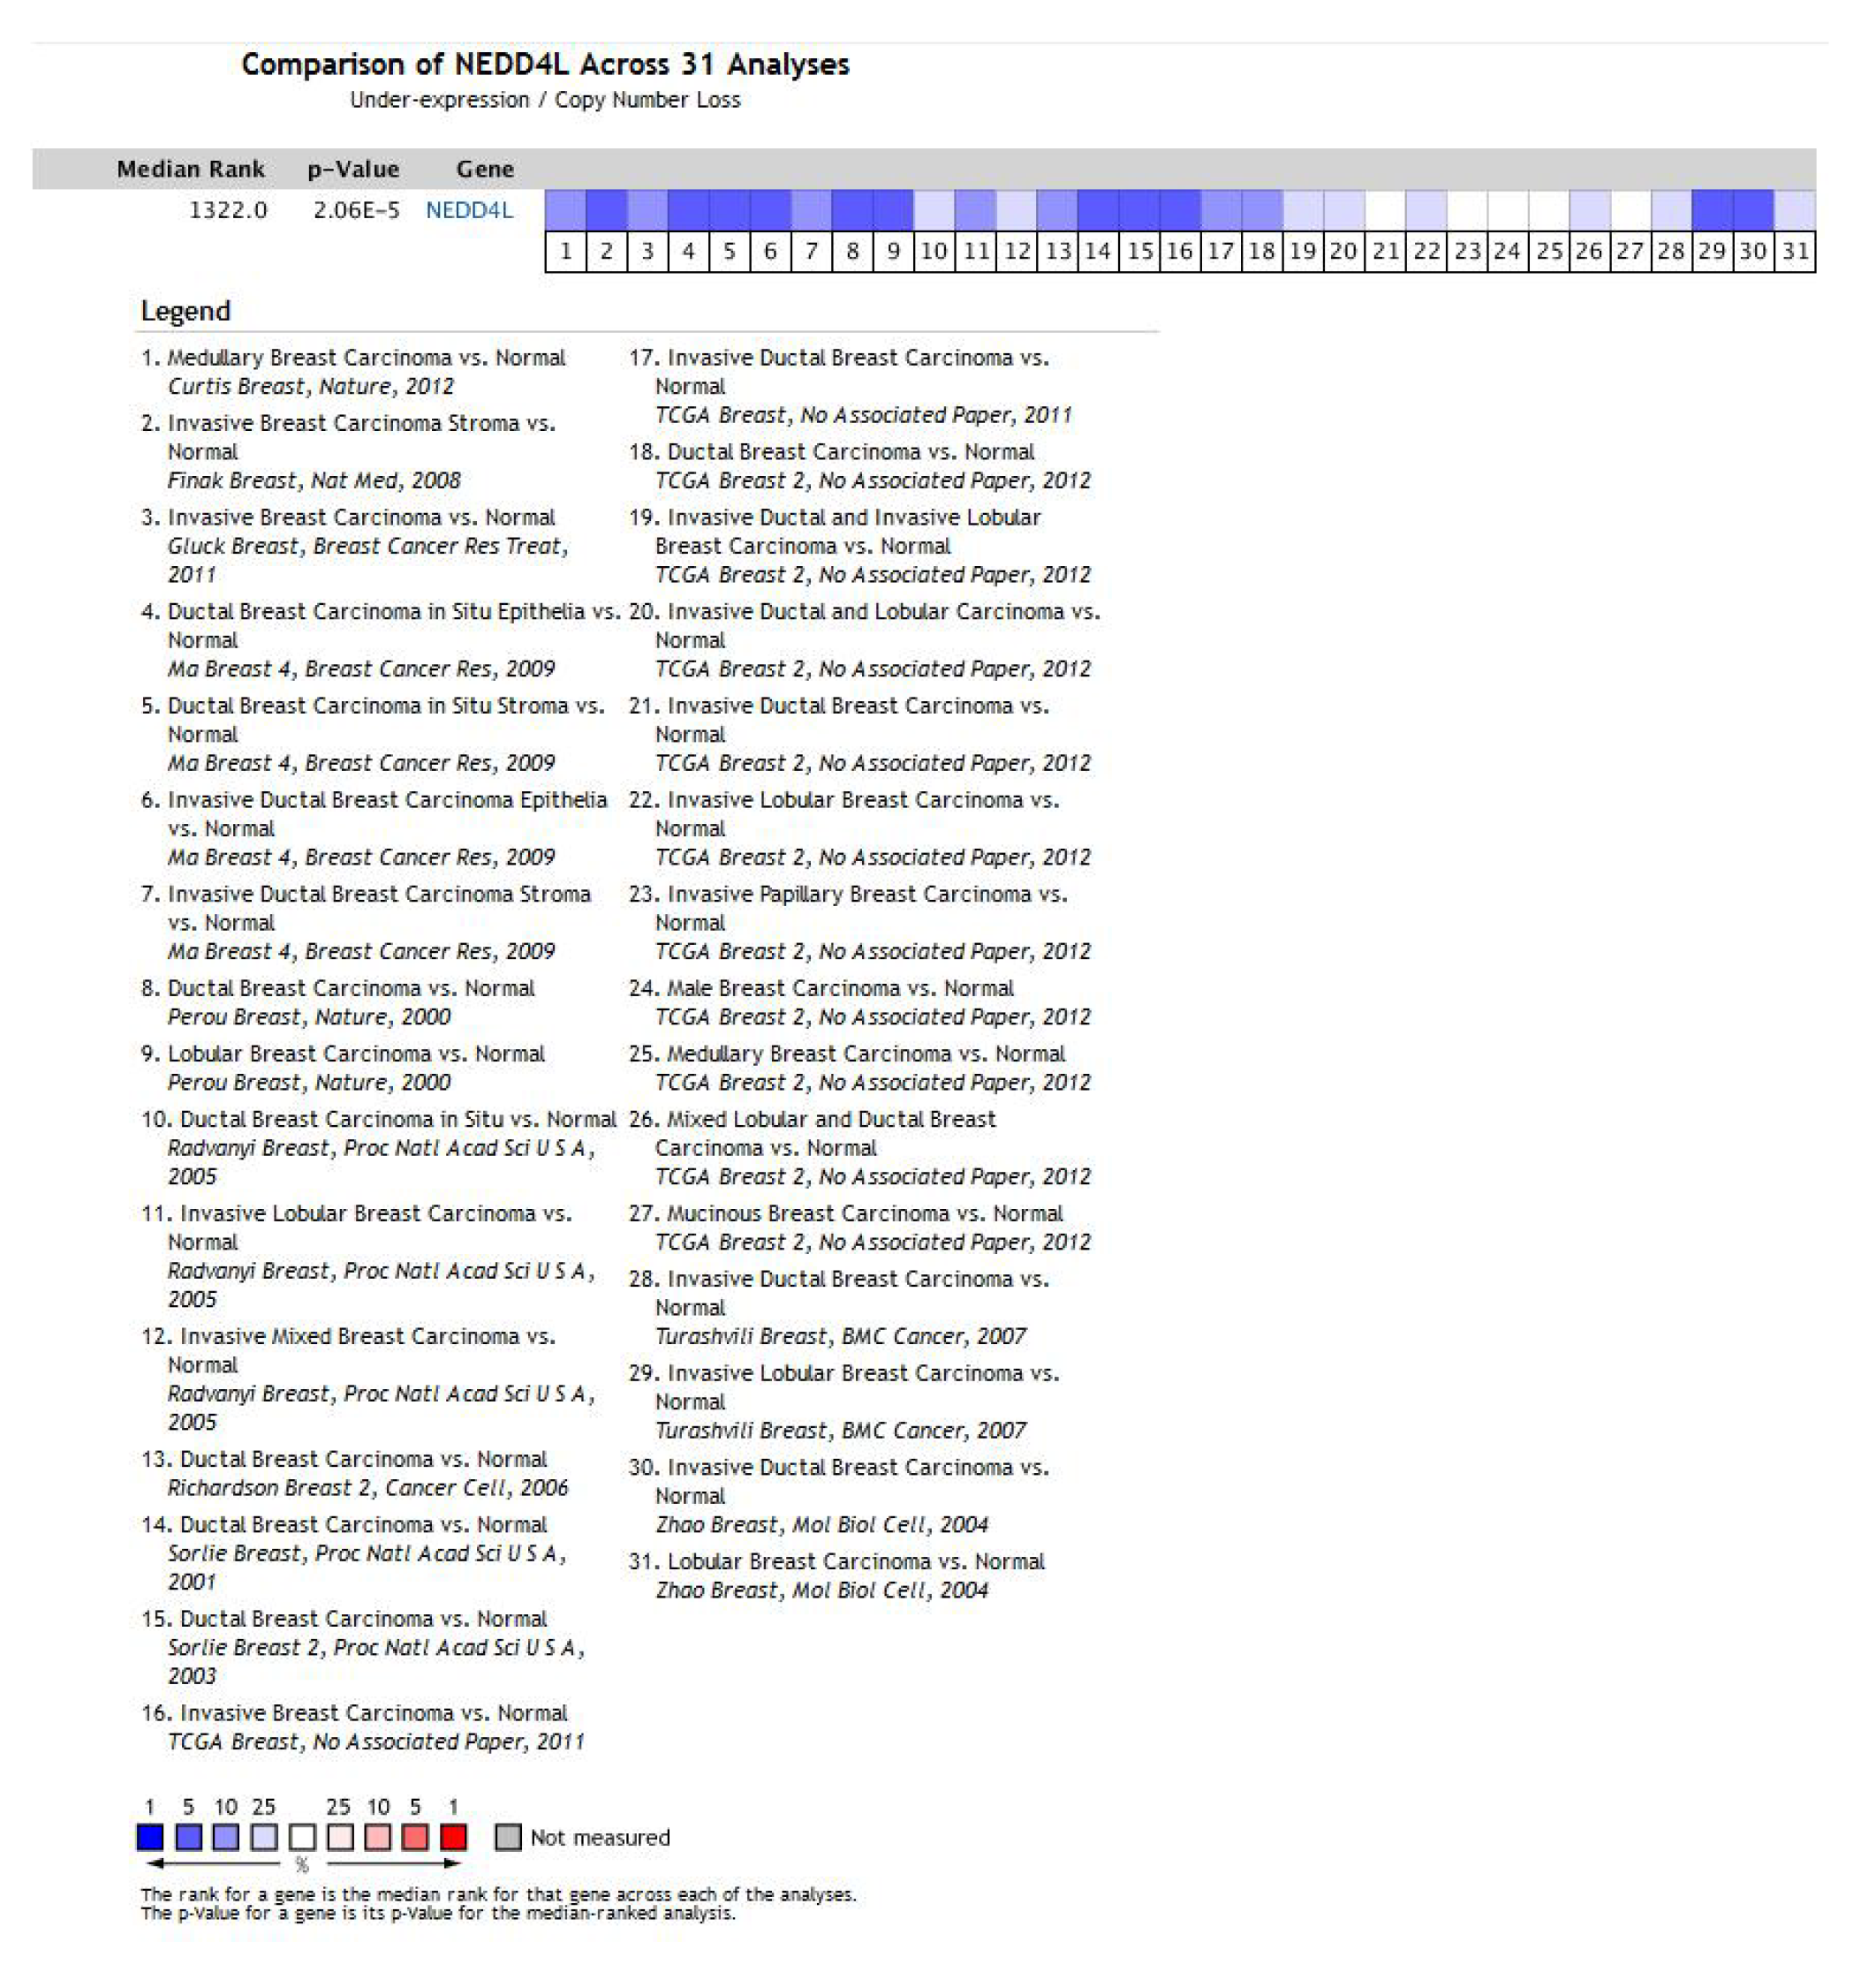
Online database analysis: A meta-analysis of NEDD4L transcriptional level in BRCA was performed by the Oncomine database (https://www.oncomine.org/resource/login.html). NEDD4L expression data were retrieved from 31 BRCA datasets containing normal and cancer tissues. Data were processed as described in our previous study [25].
Functional analysis and enrichment analysis: Gene ontology (GO) and Kyoto Encyclopedia of Genes and Genomes (KEGG) enrichment analyses were performed by the clusterProfiler package in R version 4.1.0. C2.cp.kegg.v7.1.symbols.gmt was chosen as the gene set database. Signaling pathways that meet the following criteria can be significantly enriched: nominal P-value < 0.05, P-value < 0.25, and normalized enrichment score > 1 [25].
Development of the prognostic model: The least absolute shrinkage and selection operator (LASSO) Cox regression analysis was performed using the glmnet package in R as described in our previous study [25]. A new score was calculated by the key genes and their corresponding coefficients generated by LASSO Cox regression analysis, as follows: Score=-0.3089*CCDC24+0.2944*CHORDC1+0.3609*FAM114A1+0.2795*EPB41L4B-0.4132*GPR171. In order to make the results applicable to different datasets, the riskScore was calculated by the following formula:
riskScore =(Score-min(Score))/abs(max(Score)) [25].
Development and evaluation of the nomogram
The nomogram was developed by the independent risk factors determined by multivariate Cox regression analysis, used to predict the total overall survival (OS) probability described in the previous study [25].
Cell culture and treatment
Human BRCA cancer MD-MBA-231 and BT549 cells were obtained from Cell Bank of Shanghai Institute for Biological Sciences, Chinese Academy of Sciences. Cells were cultured in L-15 (MD-MBA-231) and DMEM (BT549) medium, containing 10% FBS and maintained in an incubator with constant temperature and CO2. Cells were treated with Mith A (HY-A0122, MCE).
Transfection and lentiviral transduction: The small interfering RNA of SP1 was synthesized by GenePharma Company (Shanghai, China), and the sequence was as follows: siSP1#1, 5'-UCCUUUUUCAAUUUUCACCAC-3'; siSP1#2, 5'-UUGAUACUGAAUAUUAGGCAU-3'; negative control, 5'-UUCUCCGAACGUGUCACGUTT-3'. Transfection was performed using Lipo8000™ (C0533, Beyotime). The lentivirus was acquired from Genechem company (Shanghai, China). The target sequence of shNEDD4L is as follow: 5'-GGAACUAAGCAGAAGGCUUTT-3'. Infection of the cells was performed according to the virus operation manual.
Western Blotting
Cells were washed with precooled PBS, then lysed with RAPA lysate on the vertical rotator at 4°C for 10 mins. Subsequently, the supernatant was obtained by centrifugation at 4°C for 10 mins (12000 rpm/min), and the protein concentration was determined by the BCA protein concentration determination kit (Beyotime, POO10S). Finally, add loading buffer and cook in boiling water for 10 minutes, and the sample is stored at - 20°C. Western blotting was performed using antibodies against NEDD4L (ab46521, Abcam), SNAI2 (#9585S, CST), GAPDH (#5174S, CST), and SP1 (#9389S, CST). Anti-rabbit IgG, HRP-linked Antibody (#7074, CST) was used as secondary antibodies.
Transwell migration assay
Briefly, 2×10⁴ MDA-MB-231 cells (starved for 12 h) suspended in medium without FBS were plated in the top chamber (24-well insert; pore size, 8 µm; Corning Costar), and medium supplemented with 10% FBS was added in the lower chamber. Cell culture and staining refer to our previous studies[27].
Immunohistochemistry and immunofluorescence assay: Breast cancer and adjacent normal tissues were fabricated into a tissue chip. Immunohistochemical (IHC) staining of FFPE sections was performed as described [28]. The H-score system was used to assess the expression of target proteins, and the formula for the H-score is as follows: Histoscore = Σ (I × Pi), where I = intensity of staining and Pi = percentage of stained tumor cells [28]. MDA-MB-231 cells were seed on the dish with a density of about 30% and treated with 400 nM Mith A for 24 h. Immunofluorescence (ICC) was performed as described in our previous study [29].
Luciferase reporter assays
For the promoter activity assay, a 2 kb fragment upstream of the transcription start site of NEDD4L (wild type and mutant) was cloned into the GP-Check2 vector (GenePharma). The resulting construct, together with a Renilla luciferase construct, was introduced into 293T cells. The preparation of cell extracts and the determination of luciferase activity were described in our previous study [28].
Patients and specimens
The 76 pairs of human BRCA and adjacent normal tissues were obtained from patients at Shanxi Provincial People's Hospital (Taiyuan, China). The use of clinical specimens was approved by the Ethics Committee of Shanxi Province Peoples Hospital. (2021196).
Pulmonary metastasis model of breast cancer
For the Pulmonary metastasis model of breast cancer, 6-week-old BALB/c nude mice were obtained from Weitong Lihua Experimental Animal Technology Co., Ltd (Beijing, China). MDA-MB-231 cells (2 × 10⁶ per mouse) were injected into the peripheral blood of mice by tail vein injection. After three weeks, the mice were sacrificed to obtain lung tissues, and HE staining was performed to detect lung metastasis of breast cancer cells. All animal experiments were approved by the Ethics Committee of Shanxi Province Peoples Hospital. (2021191).
Statistical analysis
The difference analysis and correlation analysis was conducted by R (version 4.1.0) with pearson and wilcox test. Survival analysis of BRCA patients was also performed by R (version 4.1.0) using the Kaplan–Meier method and log-rank test. The "ggplot2", "ggpubr", "survival", "survminer", "clusterProfiler", "org.Hs.eg.db", "enrichplot", "DOSE", "GSVA"and "GSEABase" packages in R (version 4.1.0) were used for visualization. A p-value of less than 0.05 was considered to be statistically significant (*, P < 171 0.05; **, P < 0.01; ***, P < 0.001).