Structure and morphology. In order to examine the influence of nanoparticle abundance on nanocomposite properties, four SBA15/Gd2O3 systems with increasing concentration of Gd2O3 NPs (gadolinium precursor concentrations 0.01 M, 0.1 M, 0.5 M and 4 M) have been prepared and denoted as SBA15/Gd2O3-0.01M, SBA15/Gd2O3-0.1M, SBA15/Gd2O3-0.5M and SBA15/ Gd2O3-4M. The structure of SBA15/Gd2O3 nanocomposite series has been investigated by means of small angle neutron scattering (SANS). Neutrons with their excellent penetration ability are recognized as an appropriate tool for the examination of structures hidden in the bulk material. Unlike the X-rays, neutrons are dominantly scattered by the nuclei and their interaction with electron shell of the atoms in the compound is negligible. The amplitude of neutron scattering varies independently of the element’s position in the periodic table and differs for isotopes of the same element. Due to this, neutron scattering offers a specific sensitivity to certain elements.
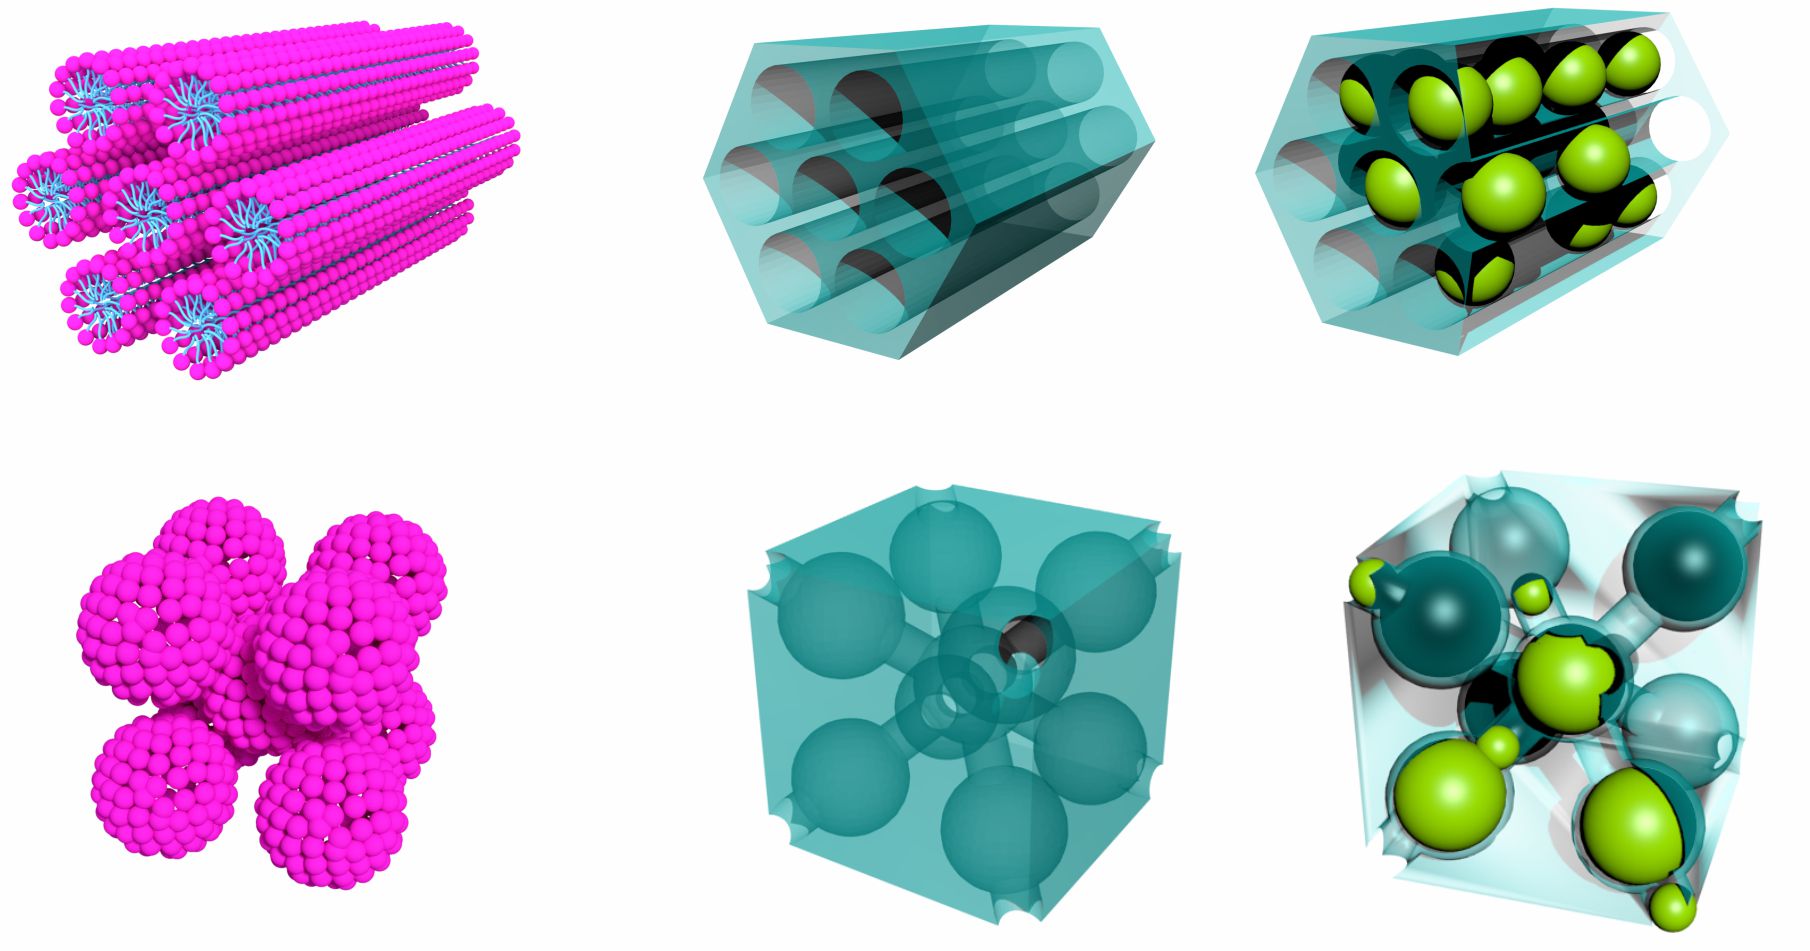
Figure 1a shows SANS data obtained for the SBA15/Gd2O3-0.01M composite. The system is characteristic of very low nanoparticle concentration what has been evidenced by a number of experimental methods (HRTEM, HE-XRD, nitrogen adsorption/desorption volumetry, magnetic measurements) previously11,13. The matrix pores are therefore deemed sparsely occupied by the Gd2O3 NPs and the scattering signal from the composite is supposed to closely resemble that of the hollow SBA15 matrix. In order to address the structure of the system, we have applied the model that we have developed for similar series of nanocomposites, where Fe2O3 instead of Gd2O3 NPs were introduced into the SBA15 matrix12. Briefly, total SANS intensity of the composite is assumed as a superposition of signals corresponding to the two subsystem contributions – scattering from the blank matrix and the system of Gd2O3 NPs. Employing the model, we have analyzed the SANS data of SBA15/Gd2O3-0.01M (Figure 1a) composite with the following results. As expected, the contribution of nanoparticle subsystem to the total scattering has been found about six orders of magnitude lower than the signal corresponding to the model of hollow silica matrix. Hence, features characteristic of the amorphous SBA15 matrix with regular cylindrical pores arranged in hexagonal symmetry (the schematics in the inset of the Figure 1a) can be unequivocally recognized. It is the major peak at momentum transfer value Q ~ 0.07 Å-1, followed by the two less clearly resolved minor peaks at Q ~ 0.13 Å-1 and Q ~ 0.15 Å-1. These peaks attribute to the system of cylinders (pores) with average radius Rc ~ 4 nm (σc = 0.5) that are arranged in the regular lattice with parameter a0 ~ 9.8 nm (σa = 0.0006).
Figure 1b presents SANS data of our complete series of the examined SBA15 nanocomposites. One can notice the similarities between the I(Q) patterns corresponding to the two systems with a low concentration of gadolinium oxide NPs (i.e., 0.01M and 0.1M). Apparently, only a modest difference in the SANS data between the 0.01M and 0.1M systems suggests a low degree of Gd2O3 nanoparticles incorporation into the pores. To proceed further, let’s consider the changes in the I(Q) pattern of 0.5M and 4M systems with respect to those of low particle concentration. The first significant feature is the increase in the scattered neutron intensity in the range of 0.01 Å-1 < Q < 0.06 Å-1. This can be explained by the progressive occupation of the pores by the NPs. The elevated population of the Gd2O3 particles is reflected in the increase of its scattering contribution (see the magenta curve in Figure 1a) to the total SANS signal. Since the pores are partially filled with NPs, the matrix pattern is becoming less resolved and the major peak at Q ~ 0.07 Å-1 smeared.
The presence of Gd₂O₃ nanoparticles within the matrix pores is evidenced by the transmission electron microscope (TEM) images in Figure 2. The periodic structure with hexagonal symmetry (upper panel) and cubic symmetry (lower panel) is documented by the high resolution transmission electron microscopy (HRTEM) in STEM mode. The unit cell parameter of the hexagonal structure in SBA15/Gd2O3-4M matrix has been estimated from the HRTEM micrographs to a0 ~ 12 nm, while a0 ~ 15 has been attributed to the cubic system SBA16/Gd2O3-4M. Hexagonal and cubic pore diameters have been determined to be dSBA15 ~ 7 nm and dSBA16 ~ 10 nm, respectively, in good agreement with references17,18.
The survey X-ray photoelectron spectroscopy (XPS) spectrum is shown in Figure 3a. The results of the XPS survey confirm the chemical composition of studied SBA15/Gd2O3 and SBA16/Gd2O3 samples without additional chemical contamination. This verifies the existence of Si, Gd, and O atoms only in studied samples. The core-level spectra from XPS, Figure 3b, clearly exhibit essentially broader Gd 4d peaks in core-level spectra. The valence band (VB) area up to 30 eV was recorded for the samples and compared with that of the Gd-Ox XPS external standard (see Figure 3c). The range of binding energies (BE) from 18 eV to 24 eV usually belongs to the O 2s electronic core-like states for the case of simple oxides, vertical blue line. The band at 22.51 eV is from the partial contribution from Gd 5p due to band overlap. The manifestation of the strongly asymmetric shoulder at 8.5 eV (see Figure 3c, red line) allows us to assume that this is also from the Gd 4f electronic states. XPS analysis confirms the presence of Gd2O3 nanoparticles without any further contamination.
Magnetic entropy study and scaling analysis. The magnetocaloric effect has been evaluated in the series of nanocomposites with higher nanoparticle concentration, i.e. 0.5M and 4M, in both SBA15 and SBA16 matrix types. Figure 4 shows the temperature dependence of magnetic entropy change −ΔSM calculated for the examined systems according to Eq. (1) (Methods section) for the field change from 0 to 5 T. All of the systems exhibit typical paramagnetic behavior with abrupt −ΔSM(T) increase when approaching low temperatures. The only exception is SBA16/Gd2O3-4M composite, where two peaks of −ΔSM(T) dependences at T ~ 3 K and T ~ 9 K have been recognized.
Apparently, there is a lack of data at low temperature region for the clear −ΔSM(T) peak recognition. Consequently, the direct application of scaling analysis was not possible and the universal curve had to be constructed alternatively. For this purpose, the exponent n characterizing applied field dependence of ΔSM ∝ Hn has been calculated according to the Eq. (2) and the data are displayed in Figure 5.
The common feature of all the examined systems is a steep increase of n at low temperatures (up to T ~ 9 K) while in the higher temperature region it converges to the value n = 2 regardless of applied field magnitude. One can also recognize that data are noisy when approaching higher temperatures (T > 25 K). This is a consequence of low field dependence of ΔSM in the region (significant thermal fluctuations) that is the source of inaccuracy when calculating logarithm and differentiating according to the Eq. (2). In the case of the second order phase transition (SOPT), n(T,H) curves should collapse onto universal curve after rescaling temperature axis (Section Methods). Due to the absence of a peak in the both -ΔSM(T) (except of SBA16/Gd2O3-4M) and its corresponding minimum in n(T) data (all the systems), we have determined the TCW = -2 K from the Curie-Weiss law fit to the magnetic susceptibility data (Supplementary Figure 1). Further, Tr has been selected for each branch of n(T) as temperature corresponding to n = 1.62 for the composites SBA15/Gd2O3-0.5M, SBA16/Gd2O3-0.5M and n = 1.55 for SBA15/Gd2O3-4M and SBA16/Gd2O3-4M (Supplementary Figure 2). The values have been set arbitrarily, although with the requirement of the proximity to the expected phase transition. The collapse of the data along with its comparison to the SOPT model of mean field theory19 can be seen in the Figure 6.
Employing rescaled temperature axis, the collapse of ΔS’M = ΔSM/ΔSM(Tr) has been obtained for the systems SBA15/Gd2O3-0.5M, SBA16/Gd2O3-0.5M and SBA15/Gd2O3-4M, Figure 7 (section Discussion). Due to the presence of minor peak (T ~ 9 K) in the −ΔSM (T) data, the collapse has not been achieved in the case of SBA15/Gd2O3-4M. Therefore, an alternative (standard) method has been applied19. We assigned TCW to the peak value -ΔSpkM at T ~ 9 K. Magnetic entropy change values have been rescaled according to ΔS’M = ΔSM/ΔSpkM while temperature axis with respect to Tr that corresponds to the ΔSM(Tr) = 0.7ΔSpkM. The rescaled data are shown in Figure 7. Apparently, the universal curve has been obtained on the right side of the minor peak, whereas in the lower temperature region the scaling failed.